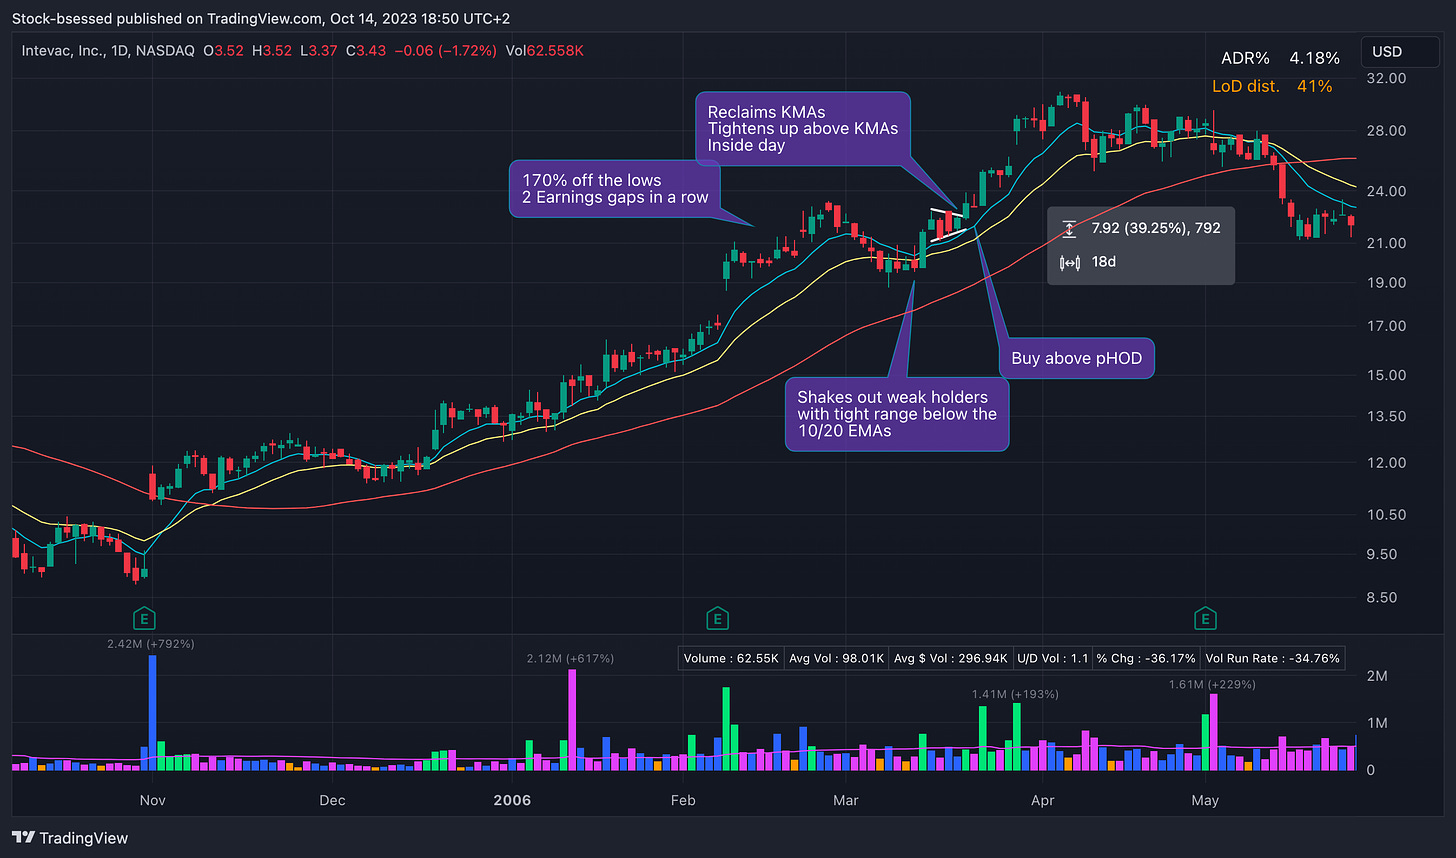
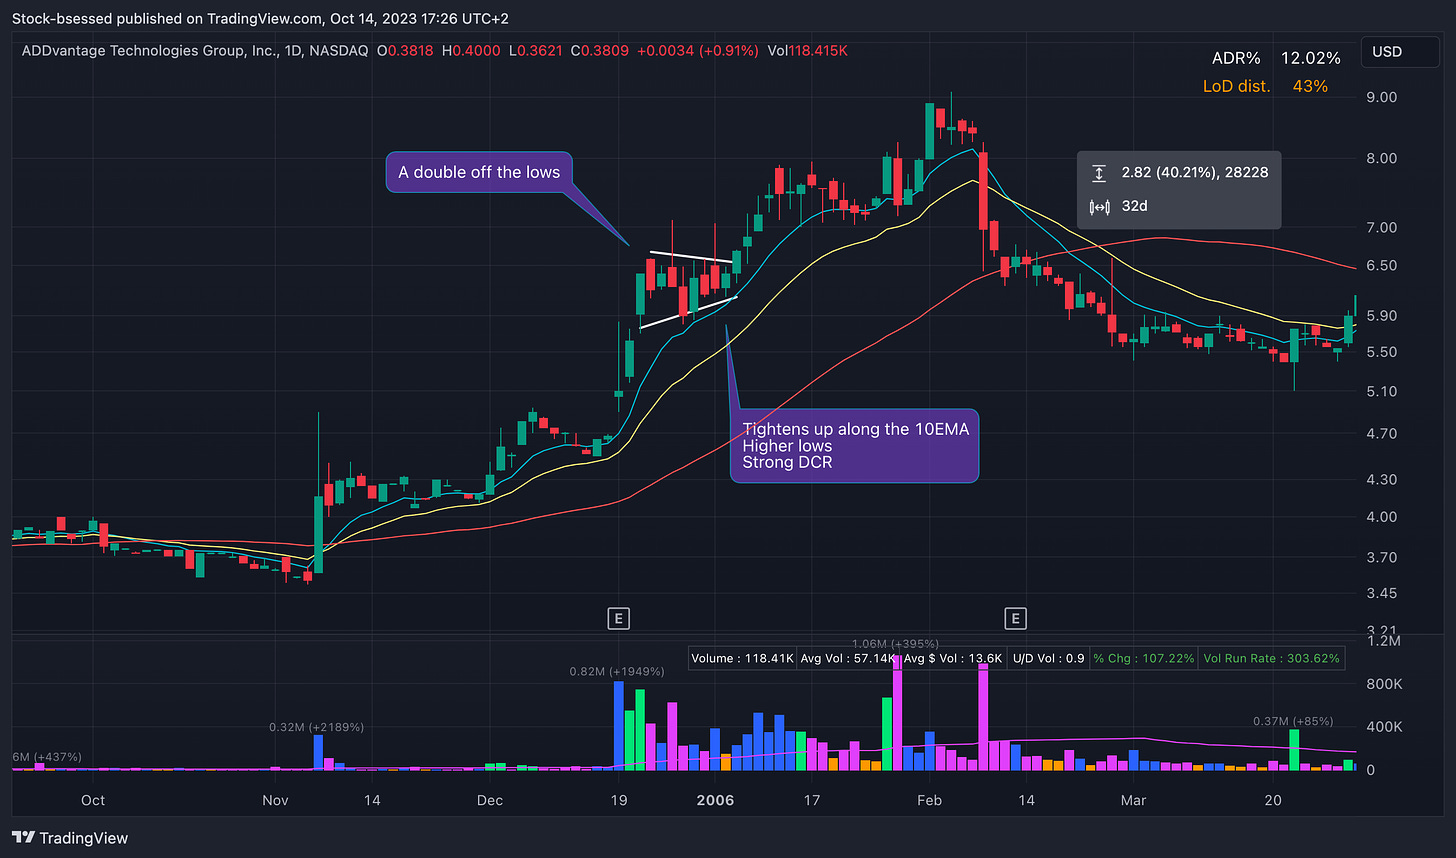
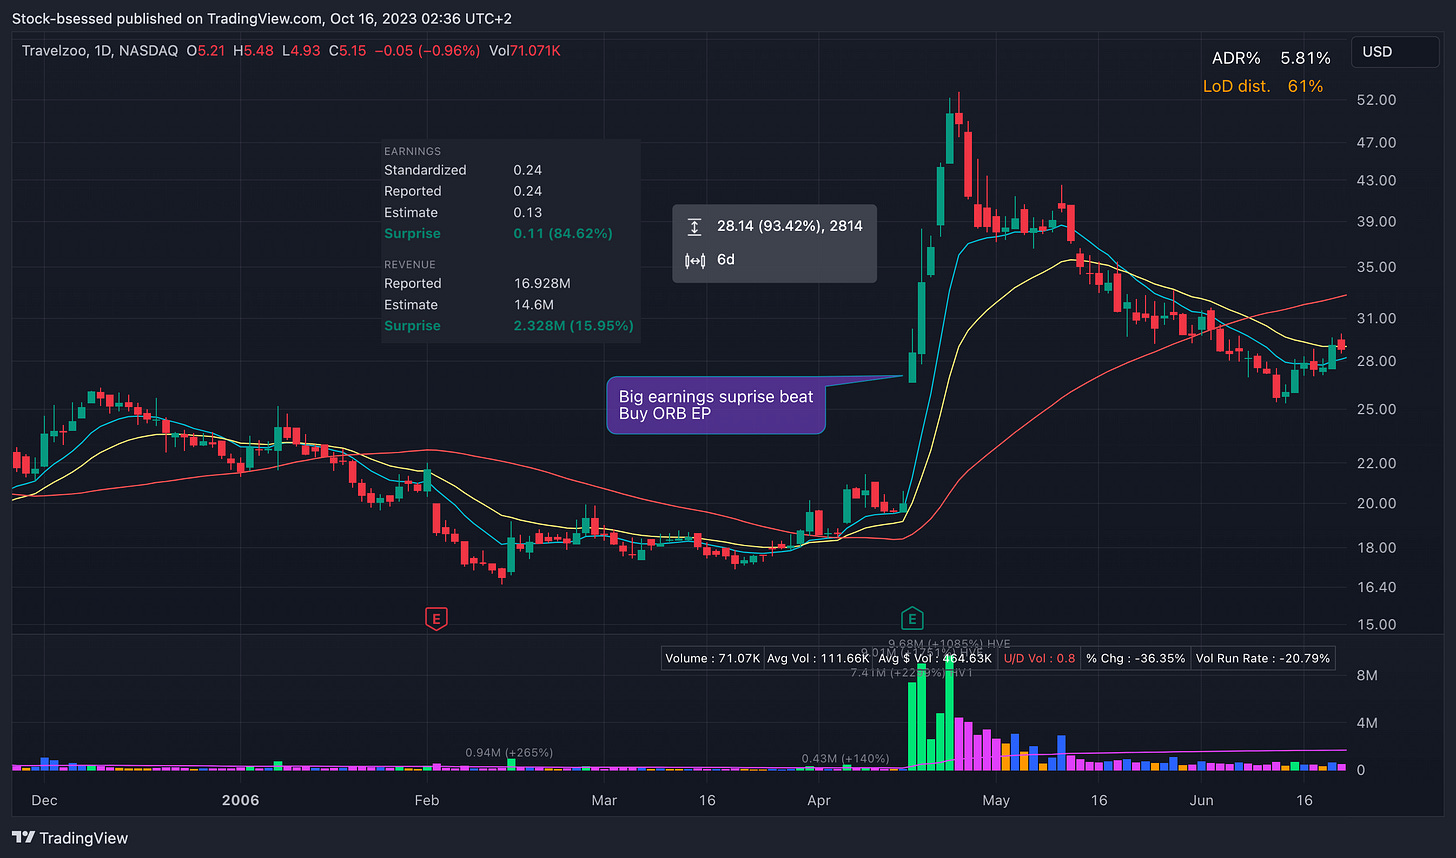
An exercise I go through almost daily is studying charts of previous big winners throughout history - it’s a great exercise to sharpen your edge and truly understand what makes stocks move, and how they do. Several successful traders emphasize the importance of carrying out such an exercise!
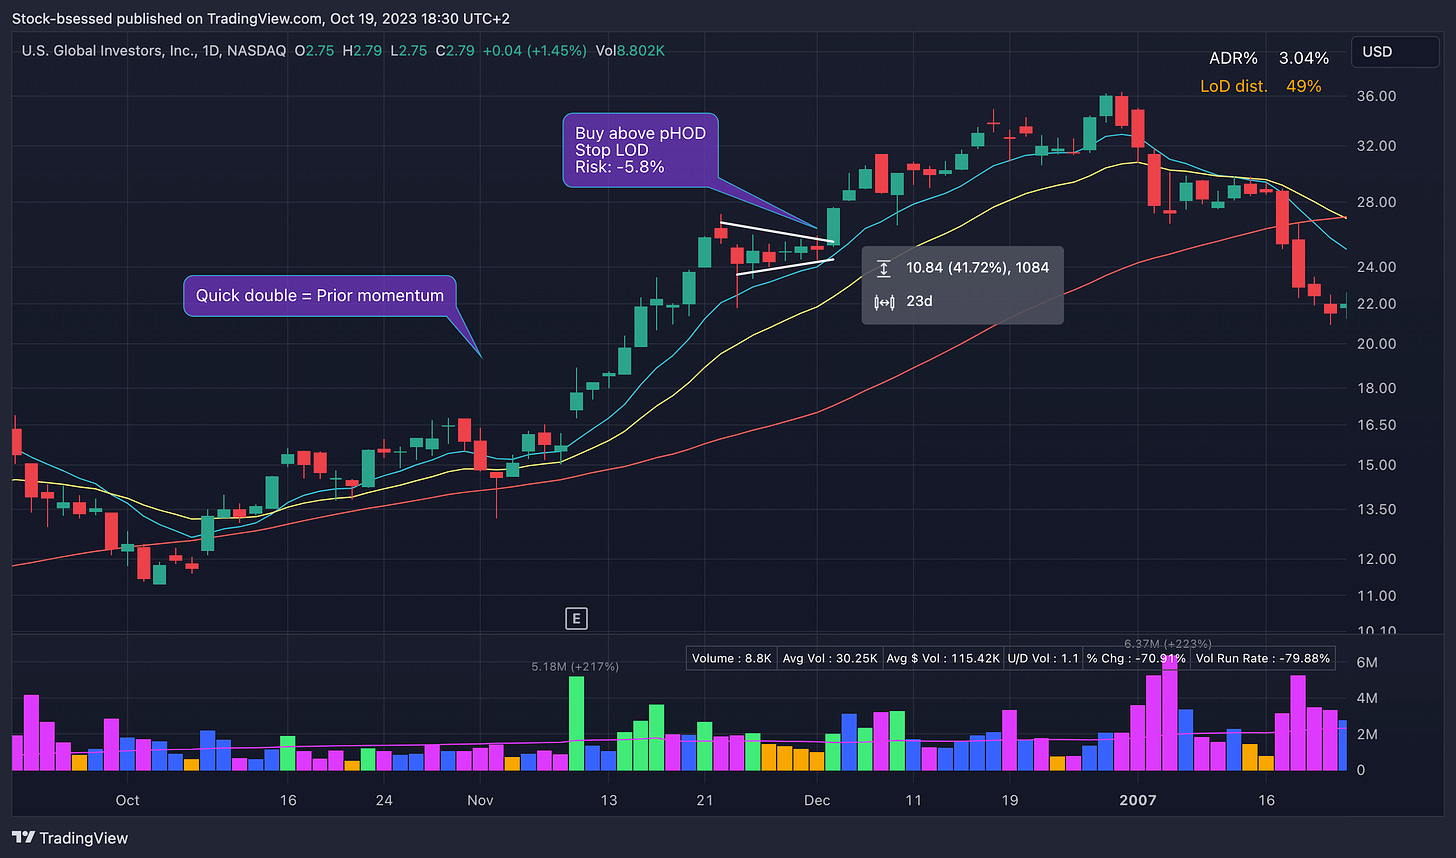
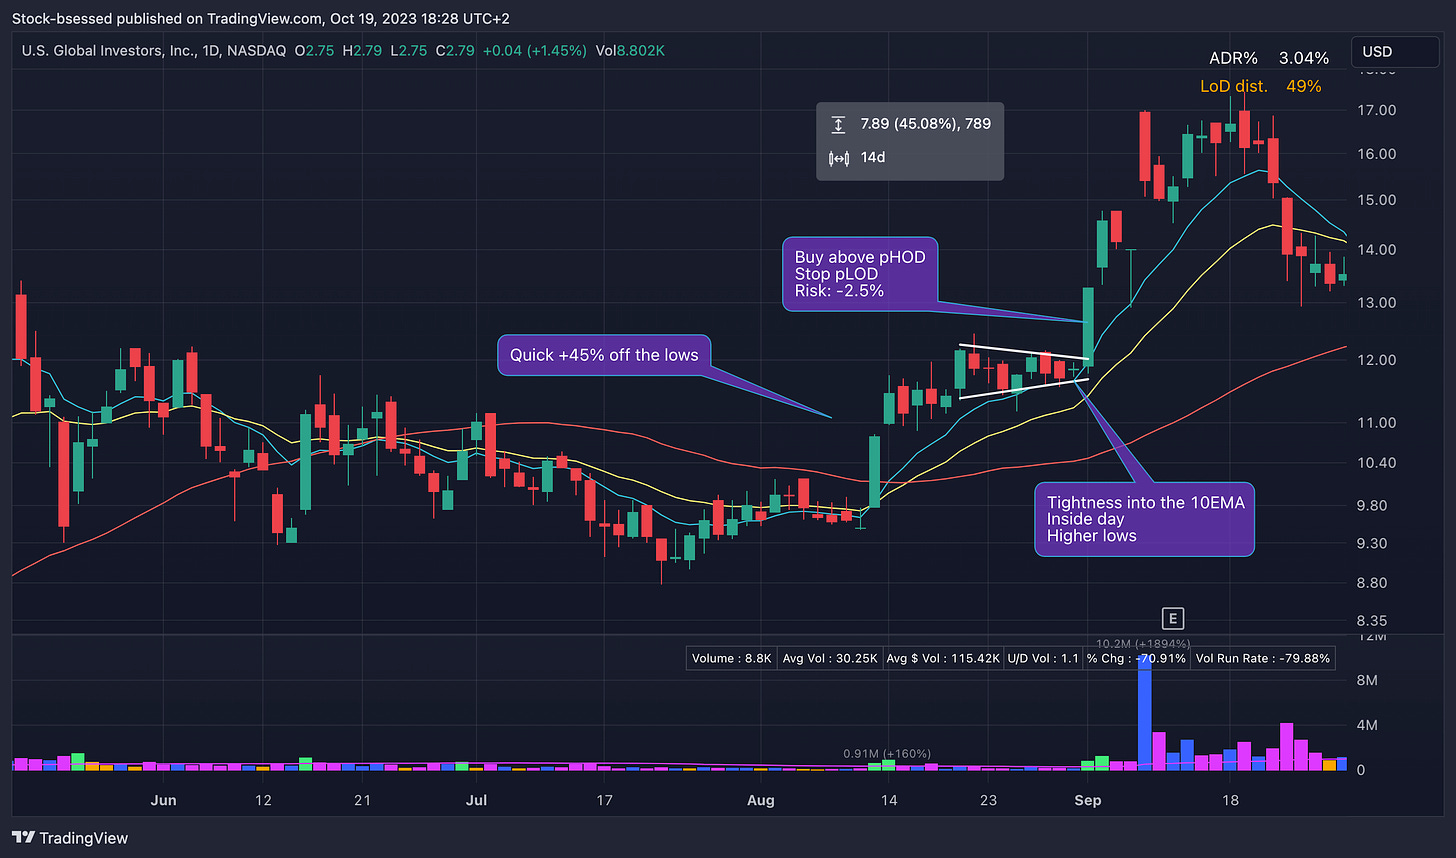
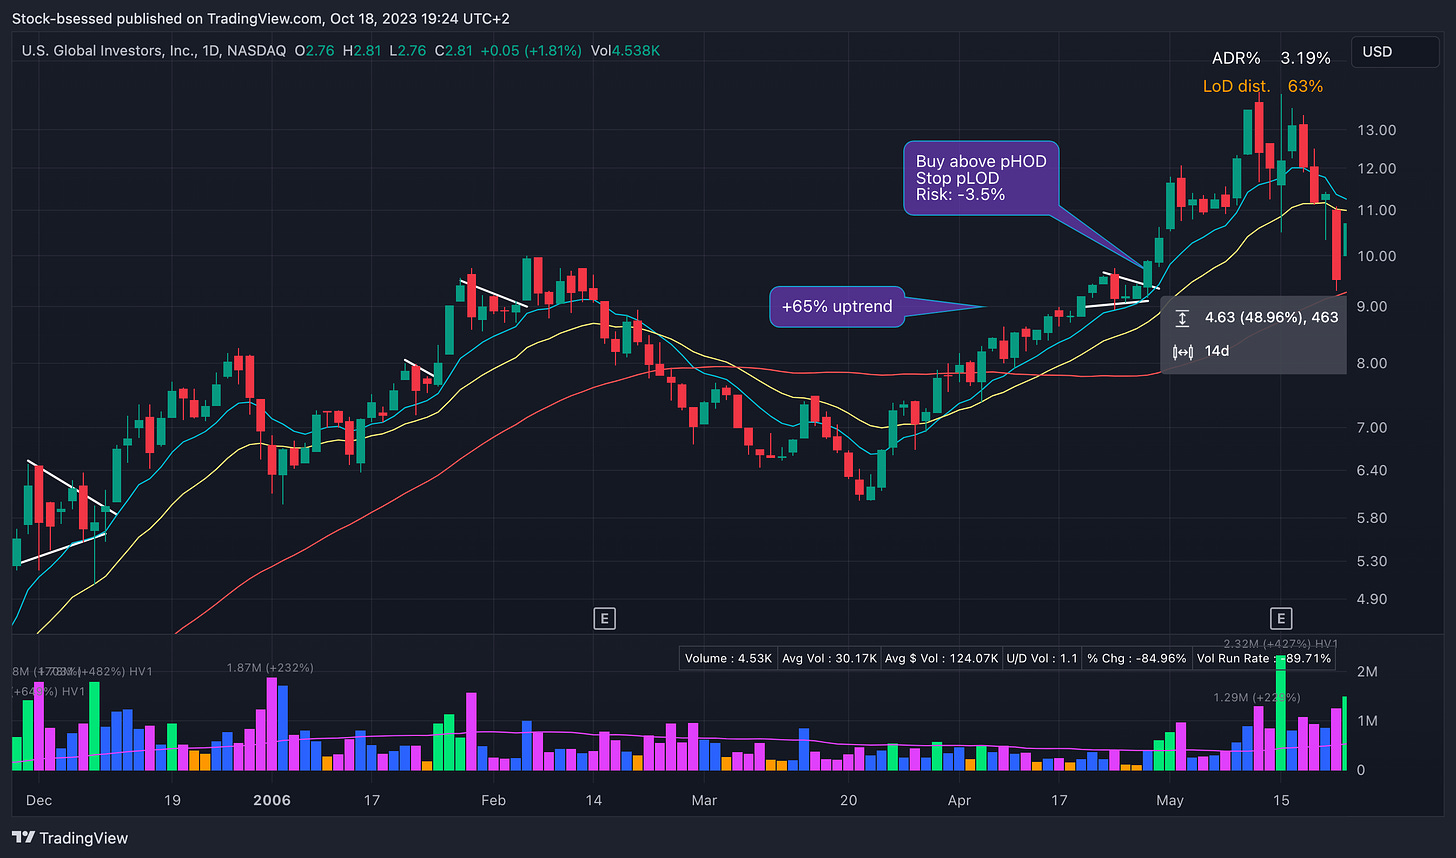
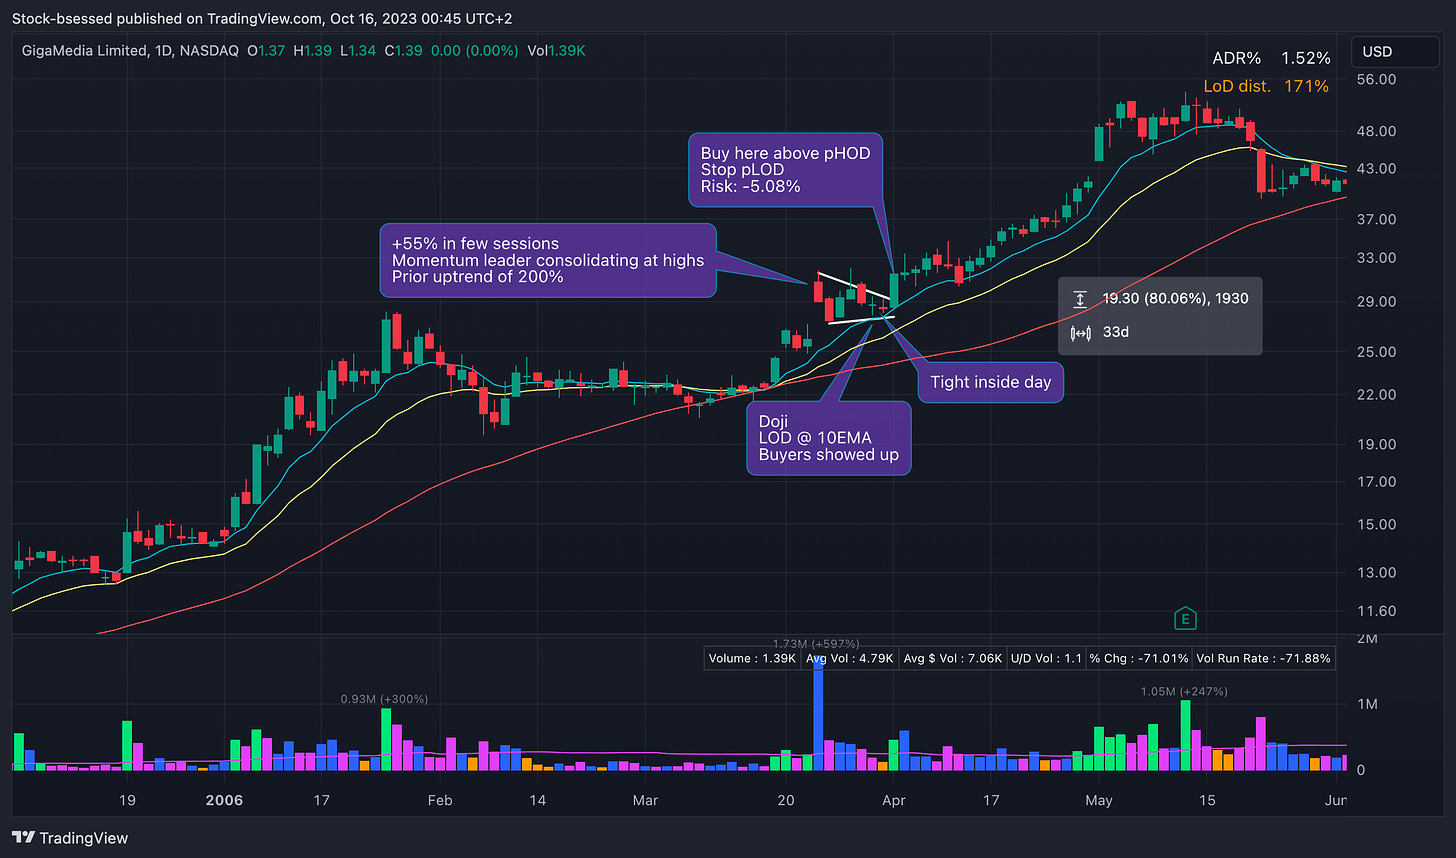
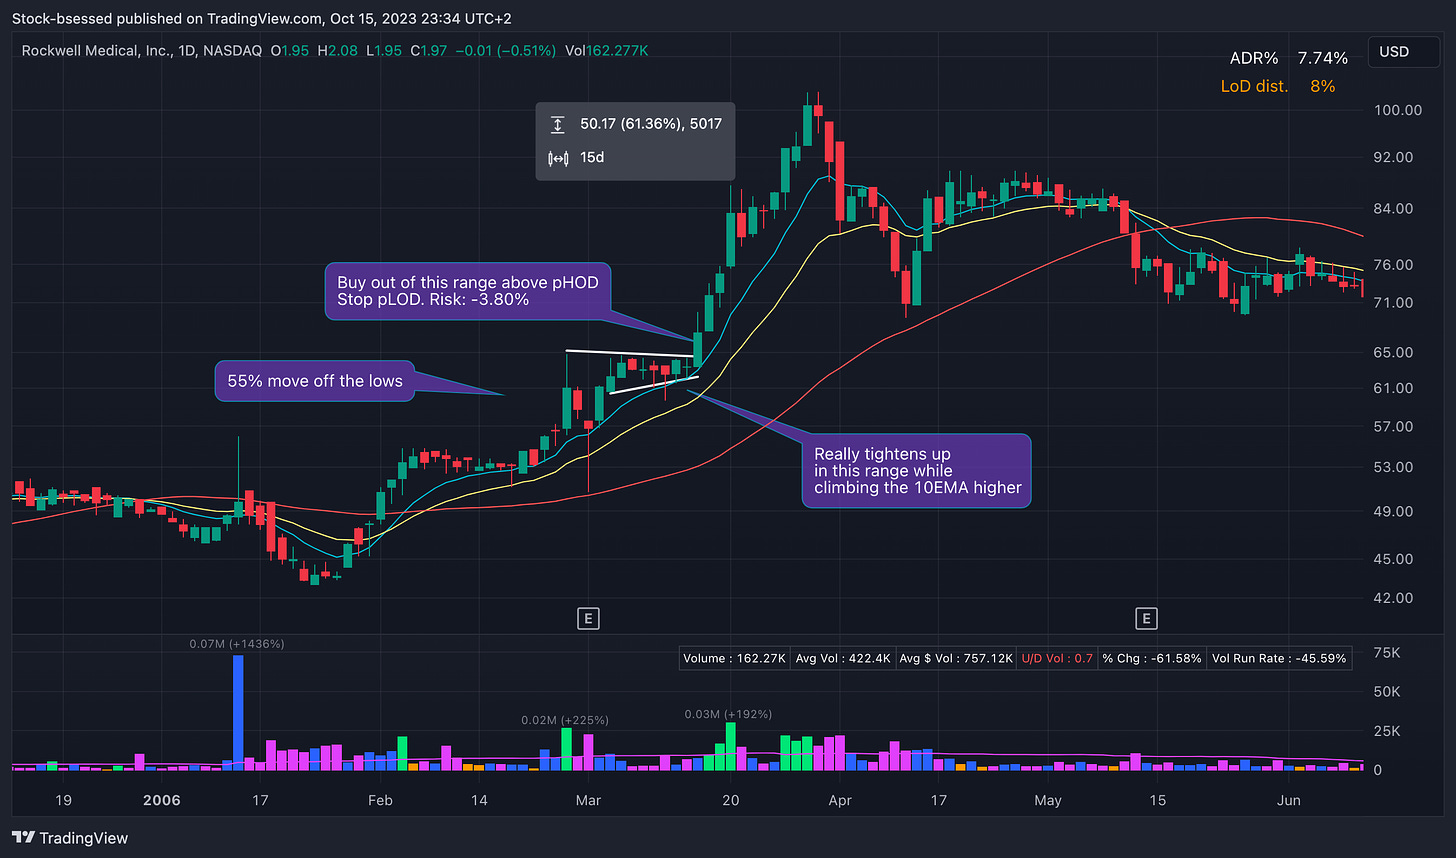
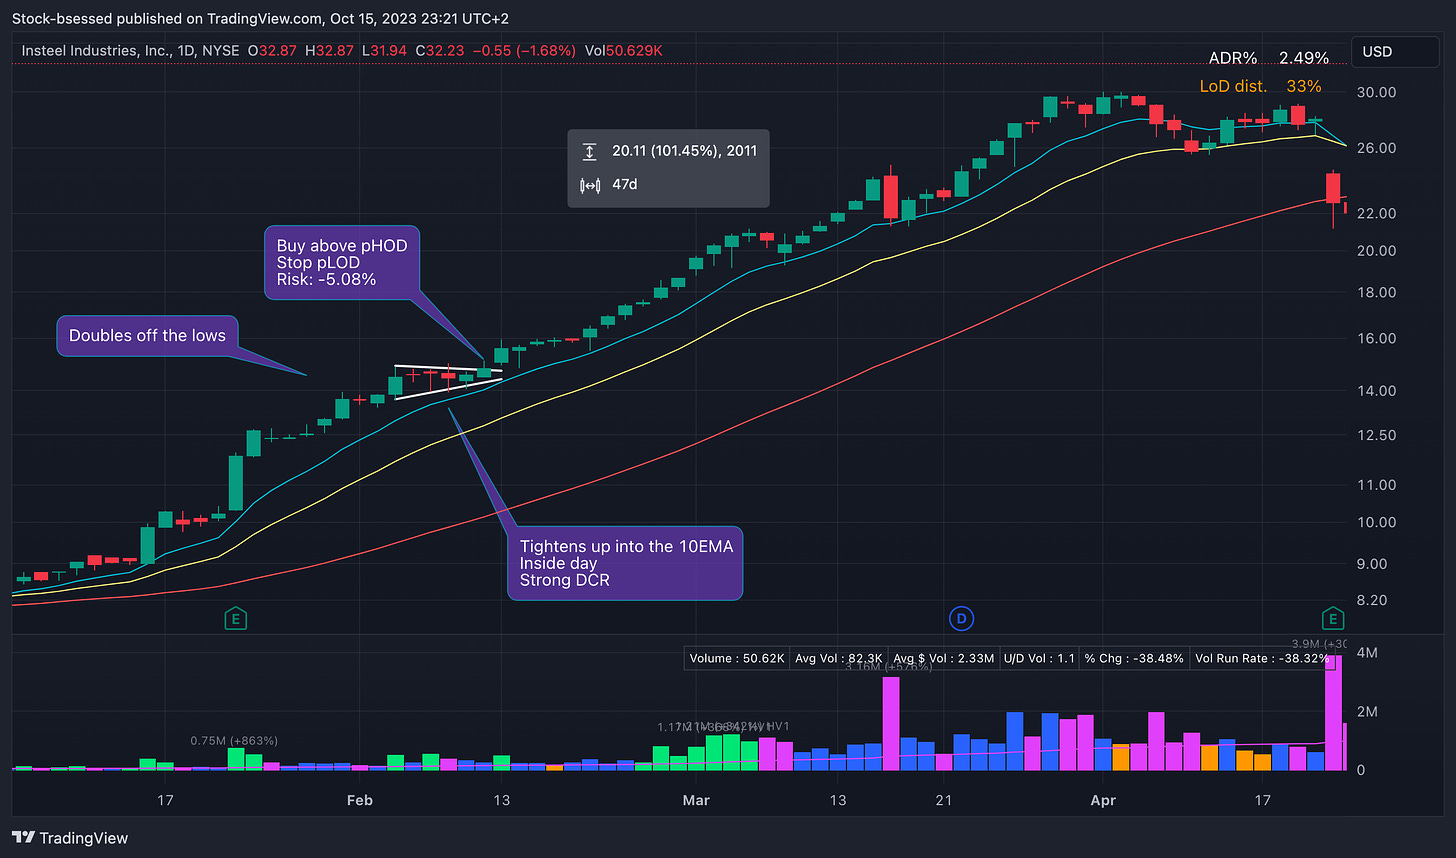
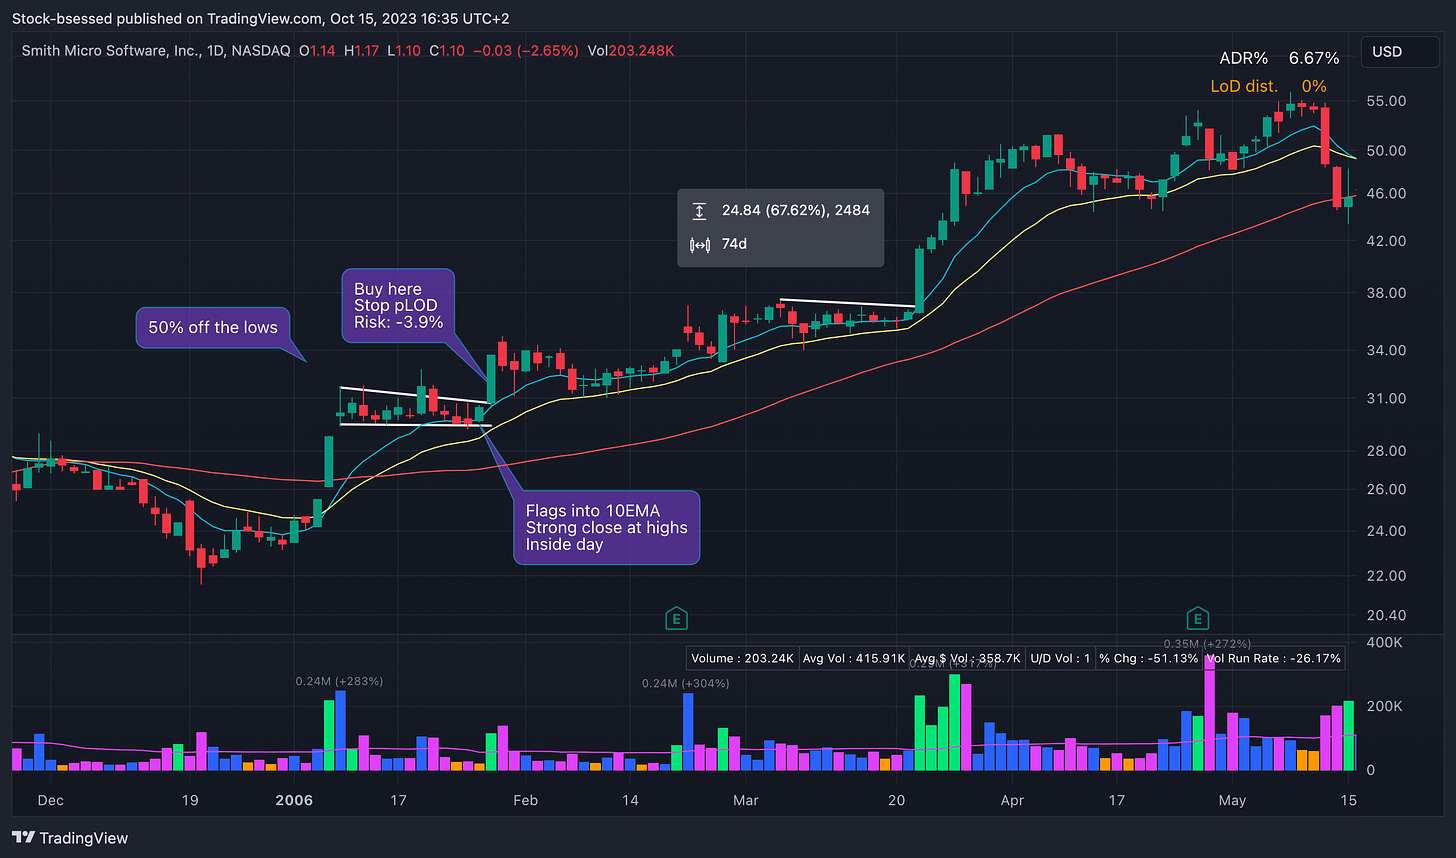
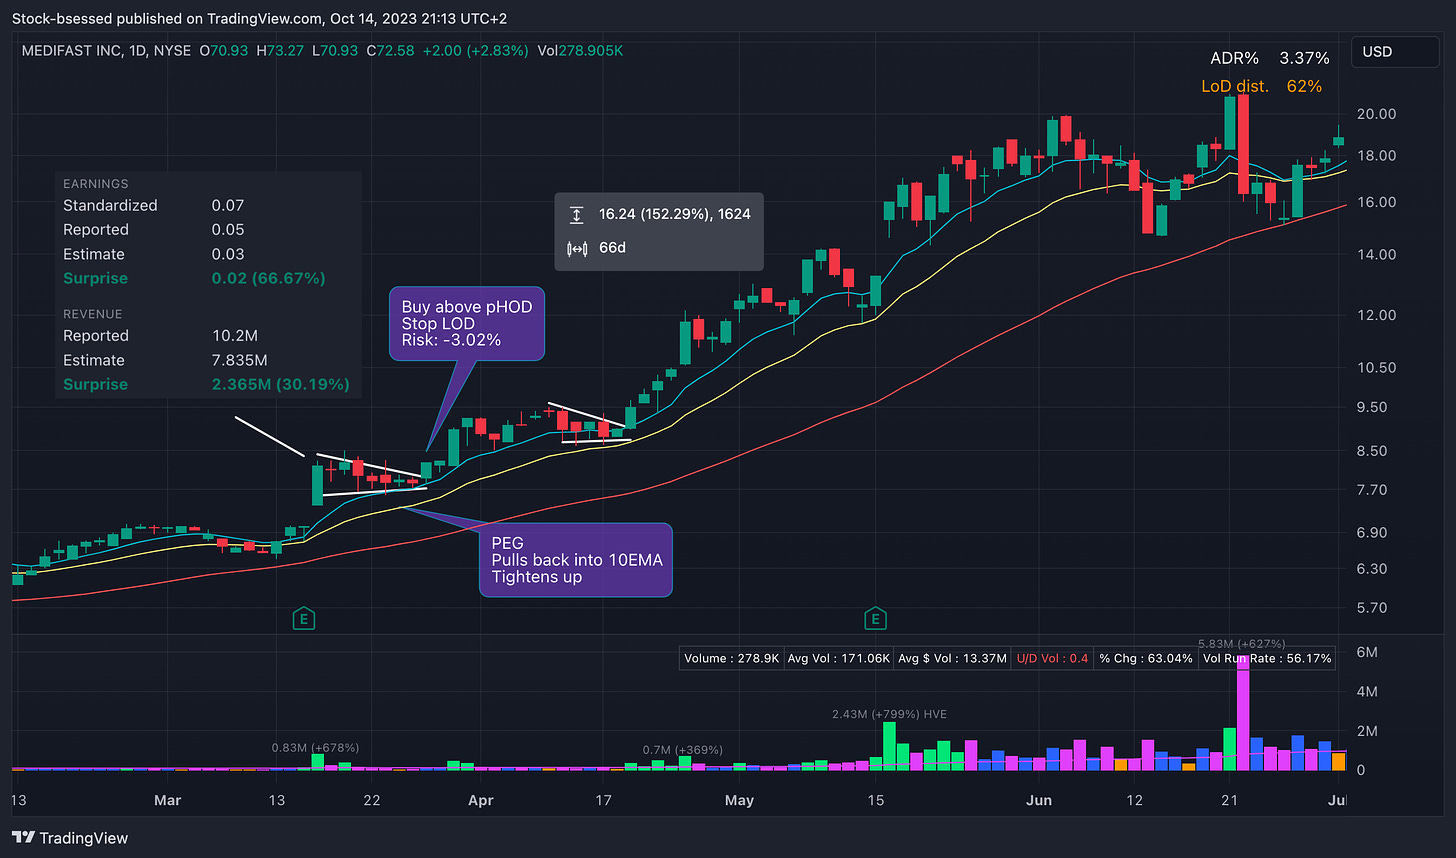
In this article I will be showing a few examples of flag setups from 2006 - here, I look for 3 main characteristics:
Upside momentum
Pullback to key moving averages
Area of tightness to manage risk against
Unfortunately I could not find many news reports from 2006, but future articles going over more recent winners will include these.
I’ve also included the % gain from entry if trailing with the 10/21 EMA - I often sell a portion of the position into strength within a few day of entry, and trail my stop loss on the remainder along a key moving average.
4-Dec-2006
1-Sep-2006
27-Apr-2006
3-Apr-2006
15-Mar-2006
10-Feb-2006
27-Jan-2006
27-Jan-2006
6-Apr-2006
5-Jan-2006
18-Apr-2006
Hope you guys found this helpful!


