

Daily Plan: Market Review & Focus List (5/4)
Daily Plan: Market Review & Focus List (5/4)
Selling Picks Up - Market Overview, Industry & Leading Stock Analysis + 4 Helpful Scans

Hi all! 👋
In this article I will cover:
General Market Overview
Chart of The Day
The action displayed by leading stocks with TML potential
Individual Sector Analysis - Which groups are breaking down vs showing relative strength
4 Helpful Scans to get potential leaders on our radar
Links to TradingView watchlists
Personal Portfolio Update
Stocks currently on my focus list with actionable trade ideas
Stockbsessed is neither an investment or financial advisor. Stockbsessed does not provide financial advice and none of the information being provided is to be seen as such.
General Market Overview

No need to get heavy in either direction just yet both in terms of equity exposure as well as allowing yourself to form any sort of bias. The reality is that we continue to trade in a choppy and difficult market despite seeing some recent improvement.
This stresses the importance of getting strong entries, not over trading, and managing risk tightly at all times as we continue seeing short-lived breakout follow through with strong seeing on pullbacks.
Strength is not see just on the initial move up, but even more so on how the following pullback / weakness is dealt with. Breadth metrics were back to negative on the session after a recent improvement and the indexes closed with sub-par daily closing ranges as ARKK 0.00%↑ is now back below the 50-day moving average along with the IWM 0.00%↑:
SPY 0.00%↑ Has a decent close off the intra-day lows as it continues to hold above the key 405 area as it allows the 10EMA and other key moving averages to catch up to price after a strong run up:

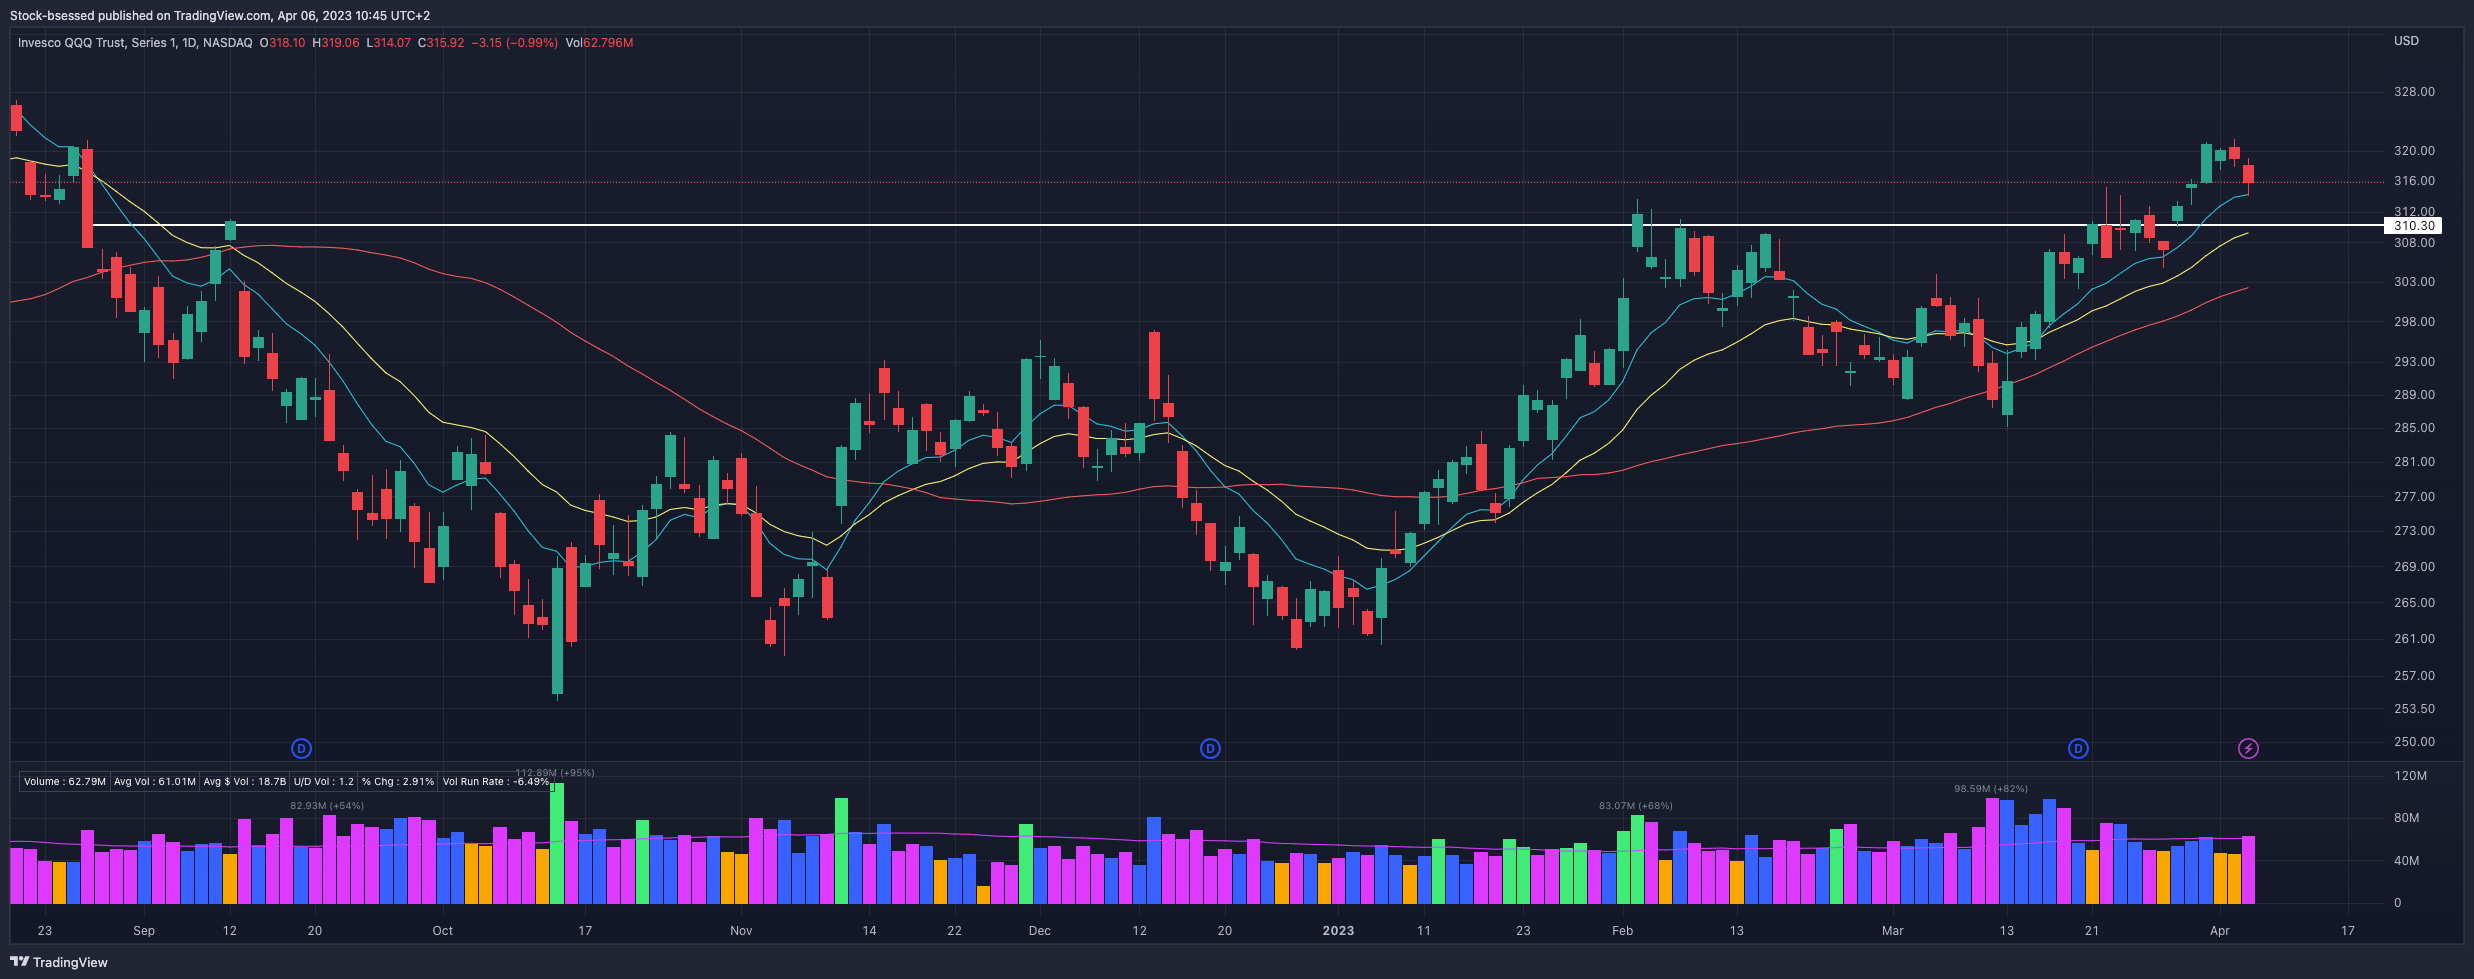
QQQ 0.00%↑ Nothing broken here just yet as buyers step in right at the 10EMA as it flags out well above previous resistance. Had a strong move to the upside in a short period of time so some rest/consolidation here is to be expected:
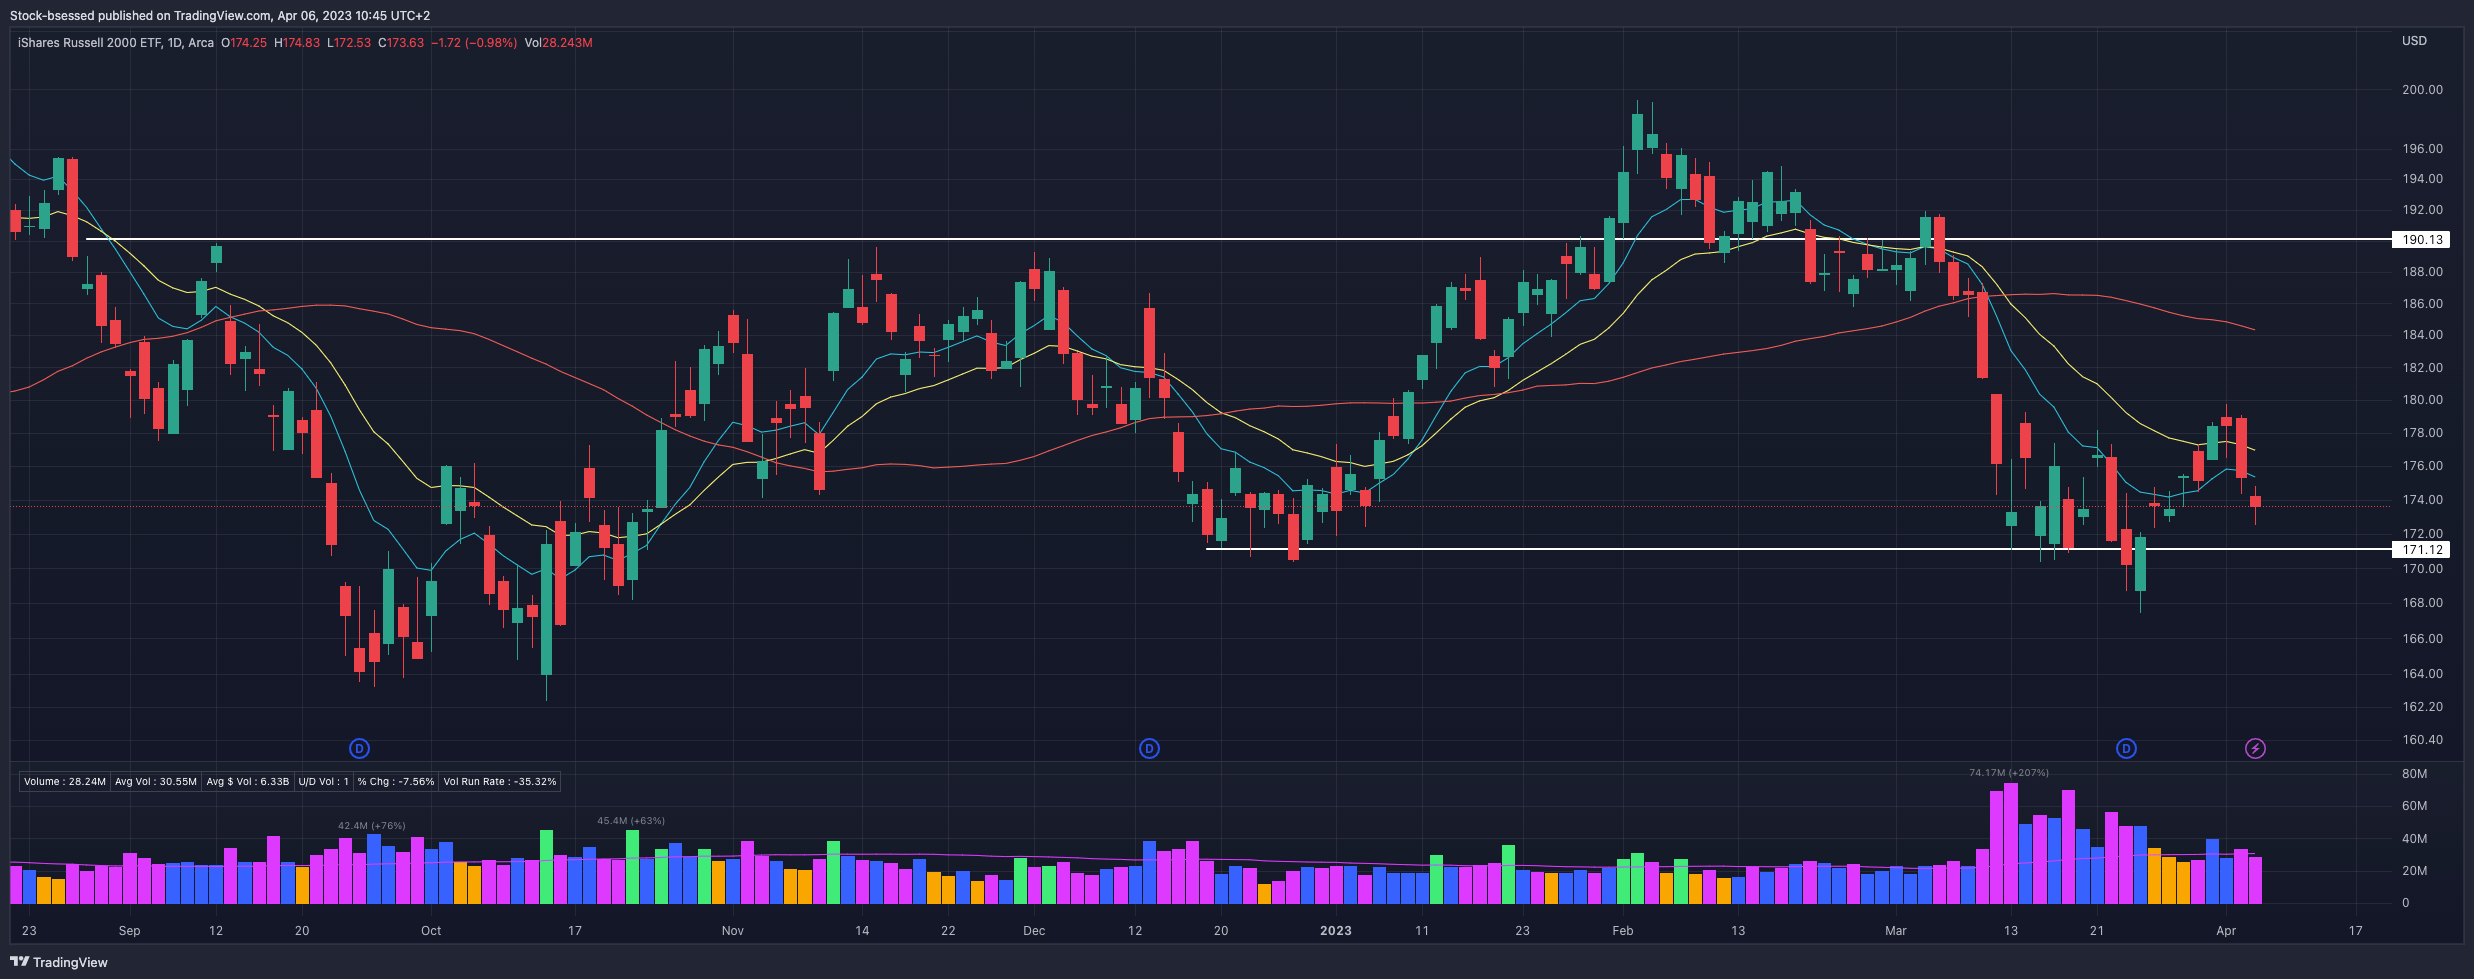
IWM 0.00%↑ Relative weakness continues here in small-caps as we see price now below all key moving averages:
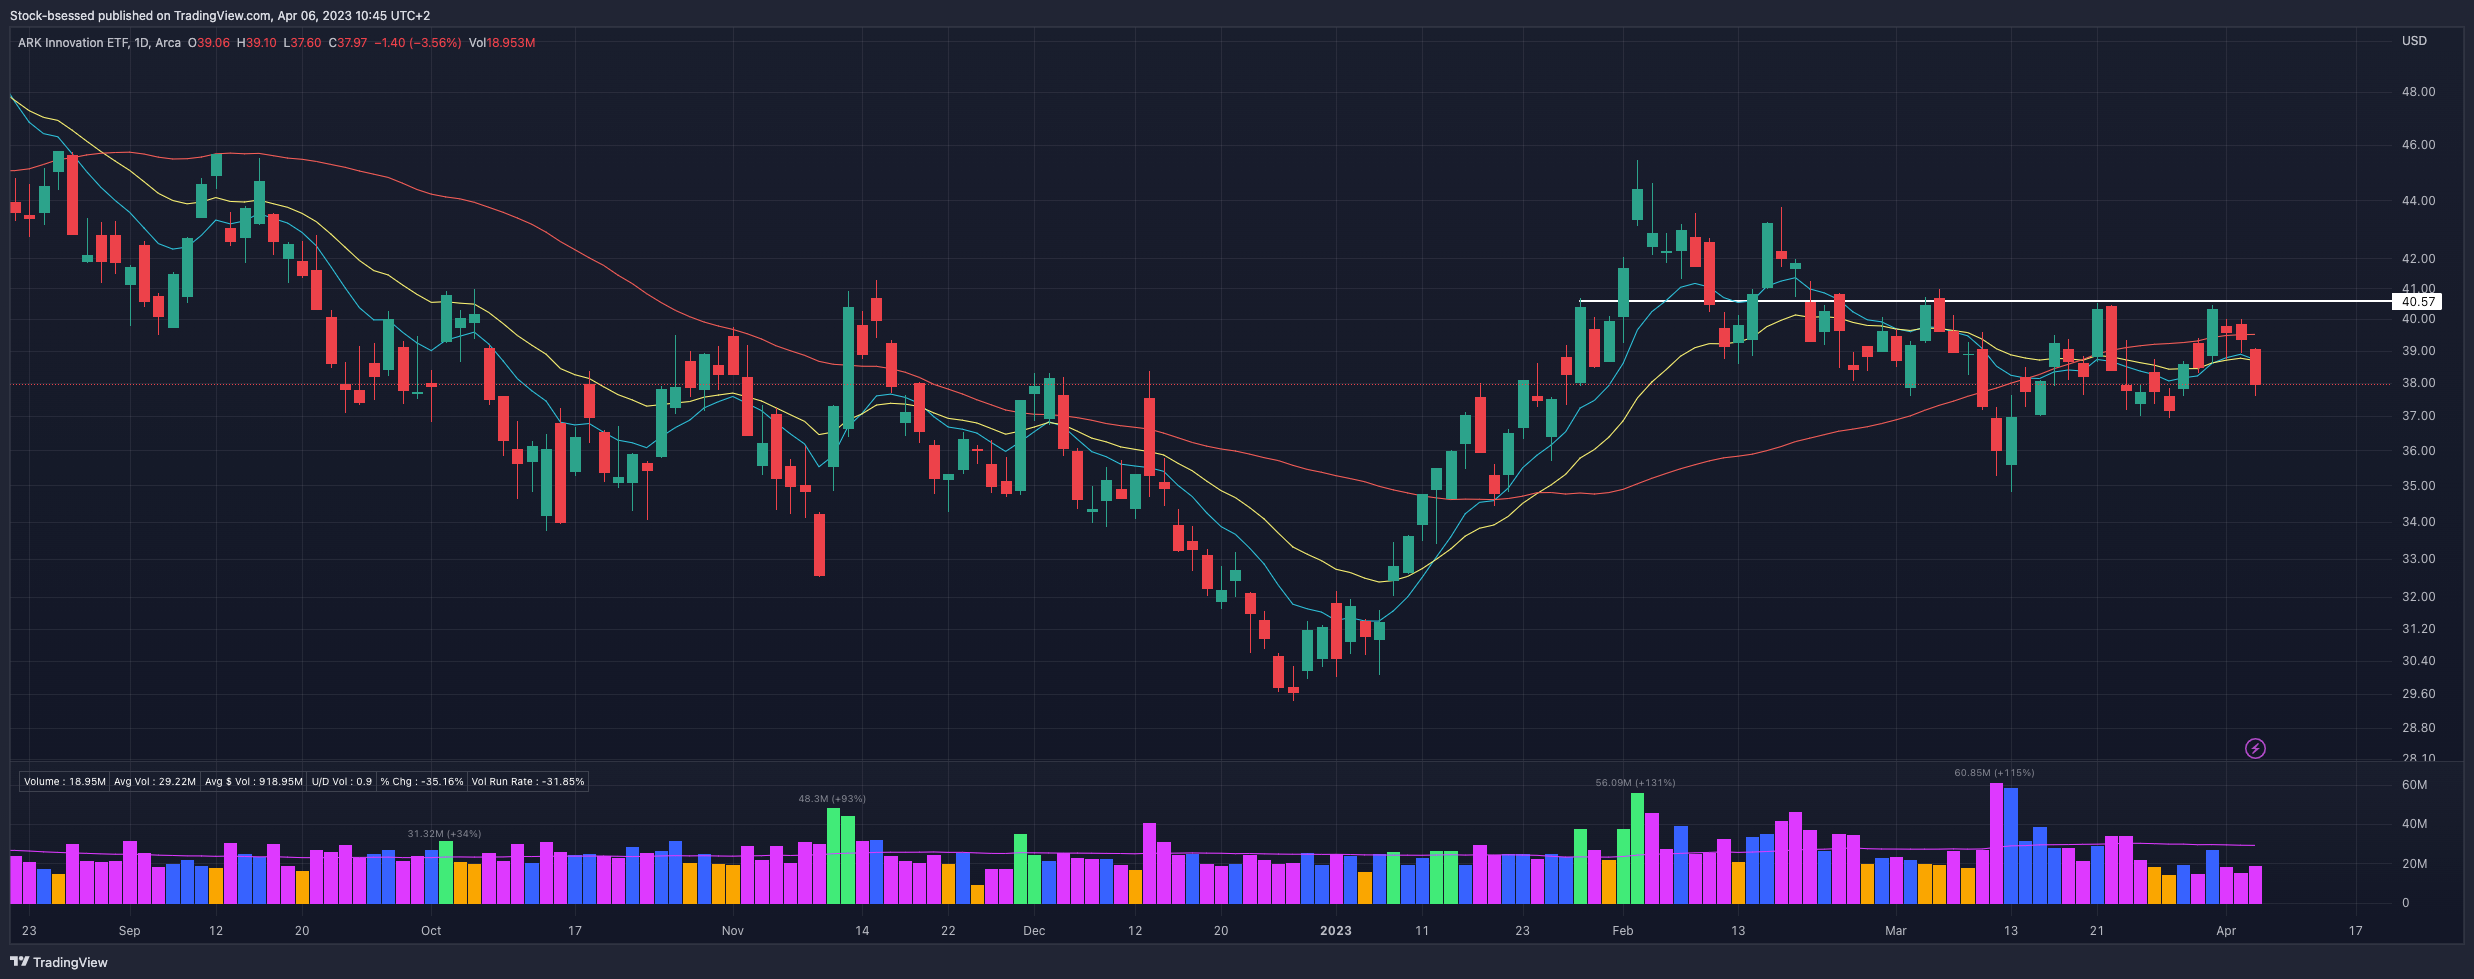
ARKK 0.00%↑ Struggling with that 40.50 area as sellers were able to push this down below all key moving averages - good to note that this is still making higher lows:
$BTC Tightening up very well here:

Chart of The Day
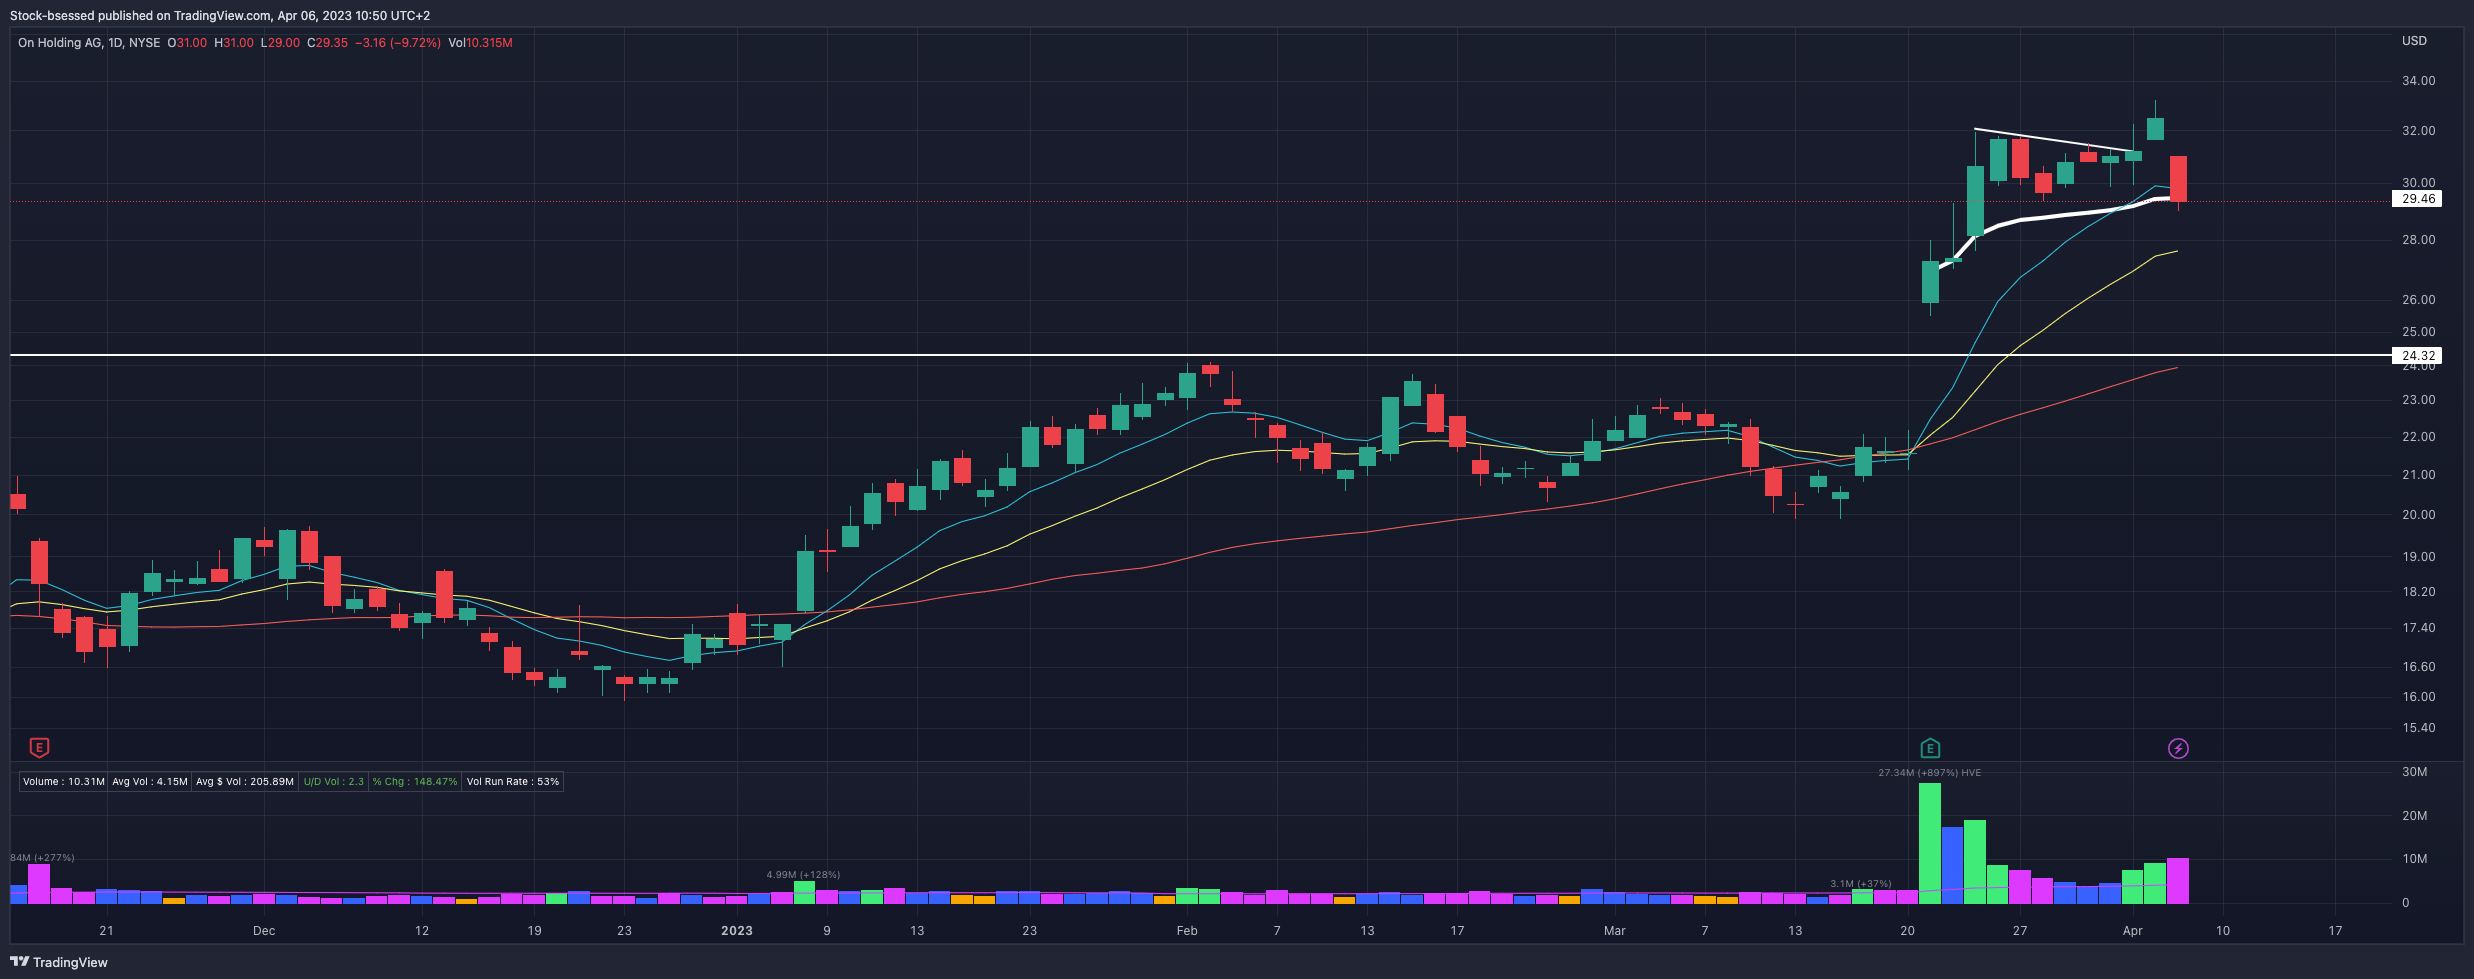
ONON 0.00%↑ Another chart showing us the difficult environment we are still in - hard to make progress with such whipsaw action and further emphasizing why strong entry points is your greatest strength in these markets. ONON gapped-down on a downgrade and sellers pushed it down from the open - loses the 10EMA but right at the AVWAP from earnings gap-up and still above the 20EMA:
Leading Stocks Analysis
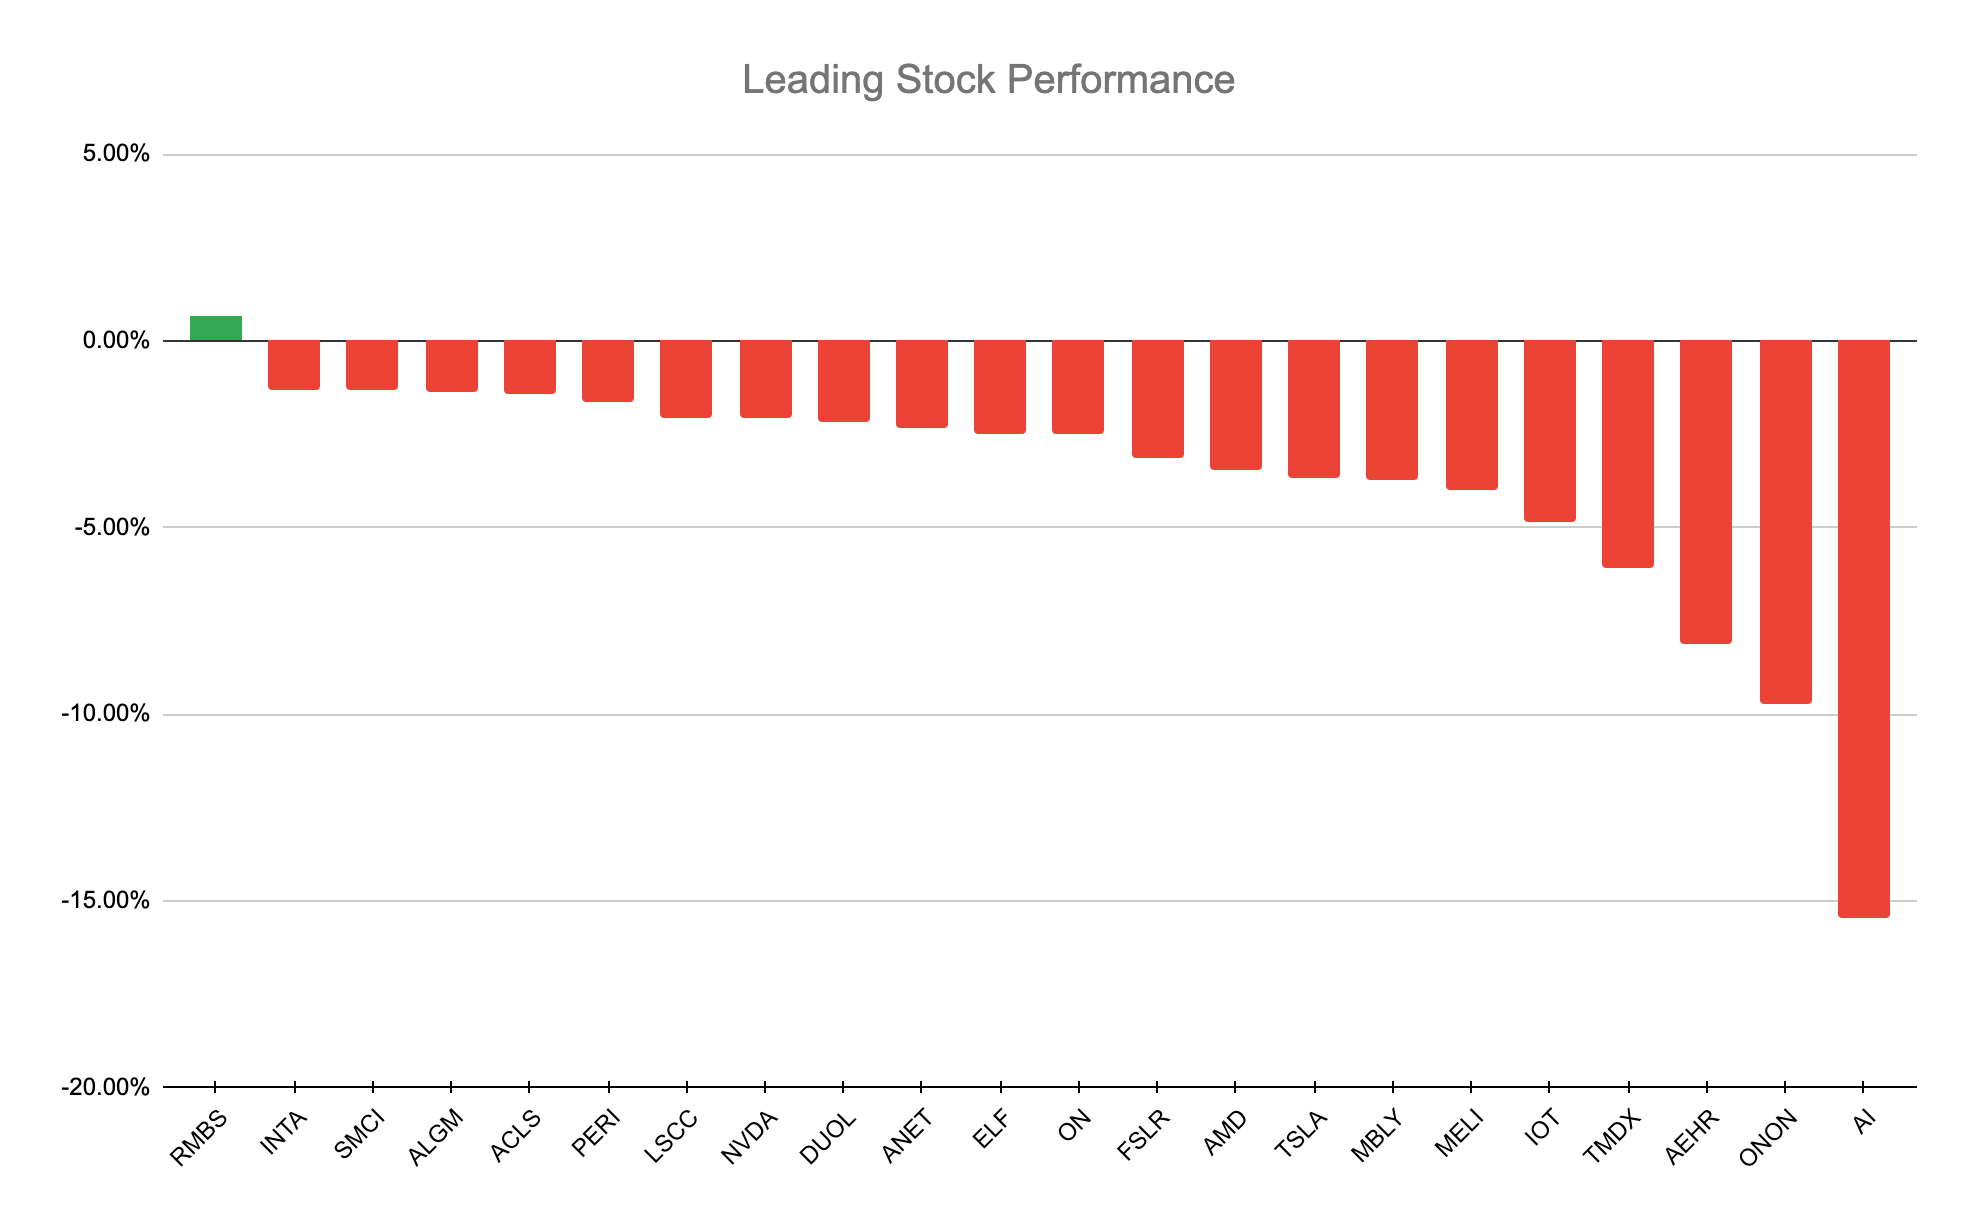
Sellers in clear control today to only have 1 of the below stocks close up on the session - distribution was evident both in the daily closing ranges as well as the percentage change on the session with quite a few getting hit hard.
We have to be logical and realistic in that some of these stocks ran up strongly in relatively short periods of time - consolidations / pullbacks should not be frowned upon but rather welcomed to have an opportunity of identifying how leaders act more clearly:
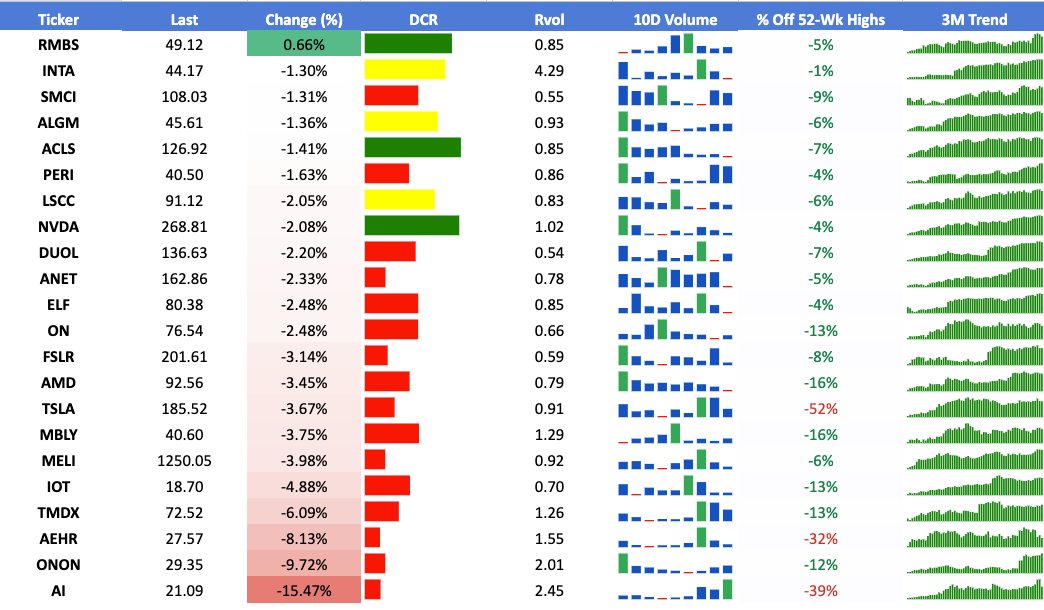
I am linking the leaders watchlist in tradingview for your convenience, here
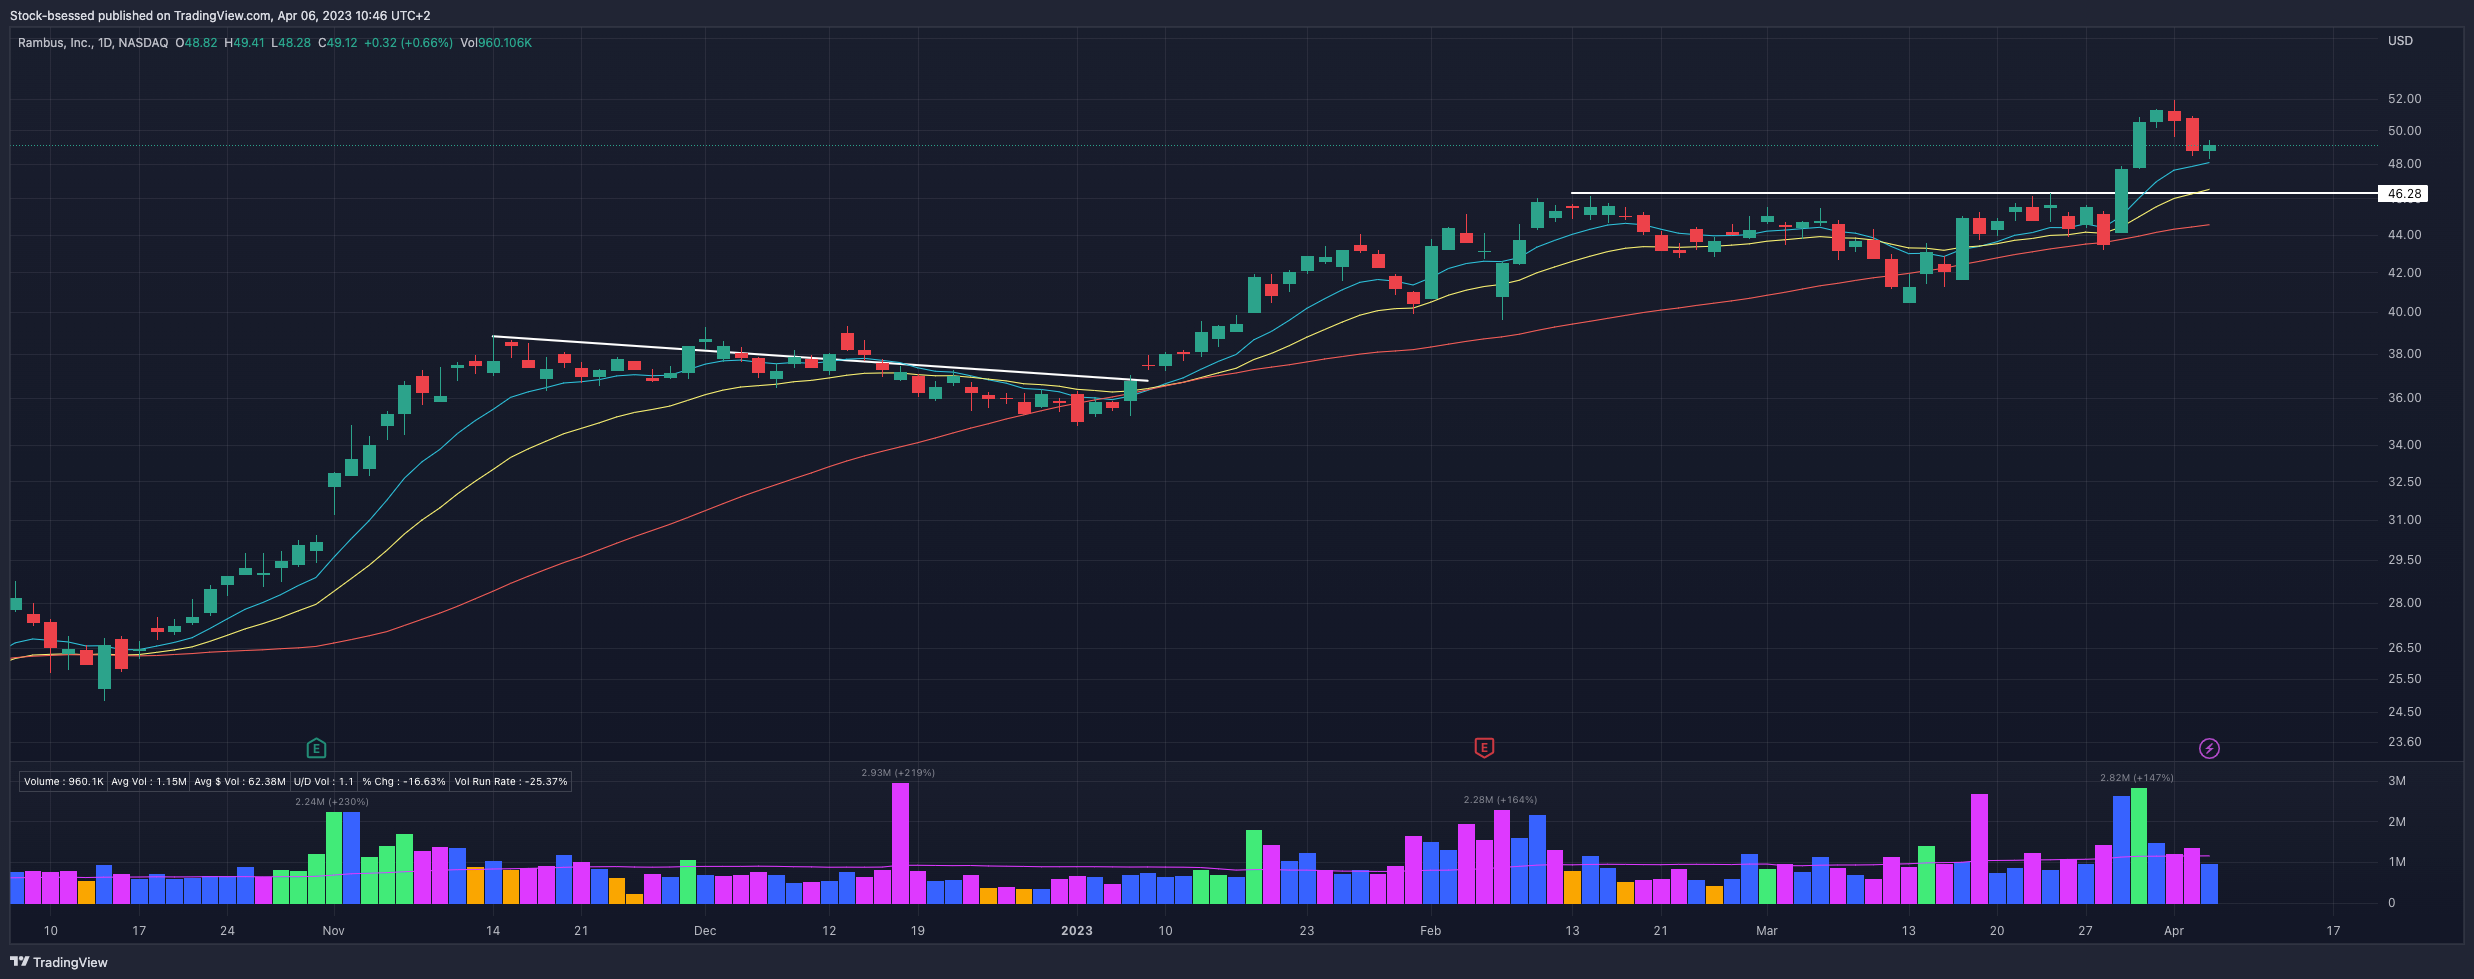
RMBS 0.00%↑ Has been extremely strong and continues to act well - pulls back slightly after its recent run and now finding support at the 10EMA above previous base pivot:
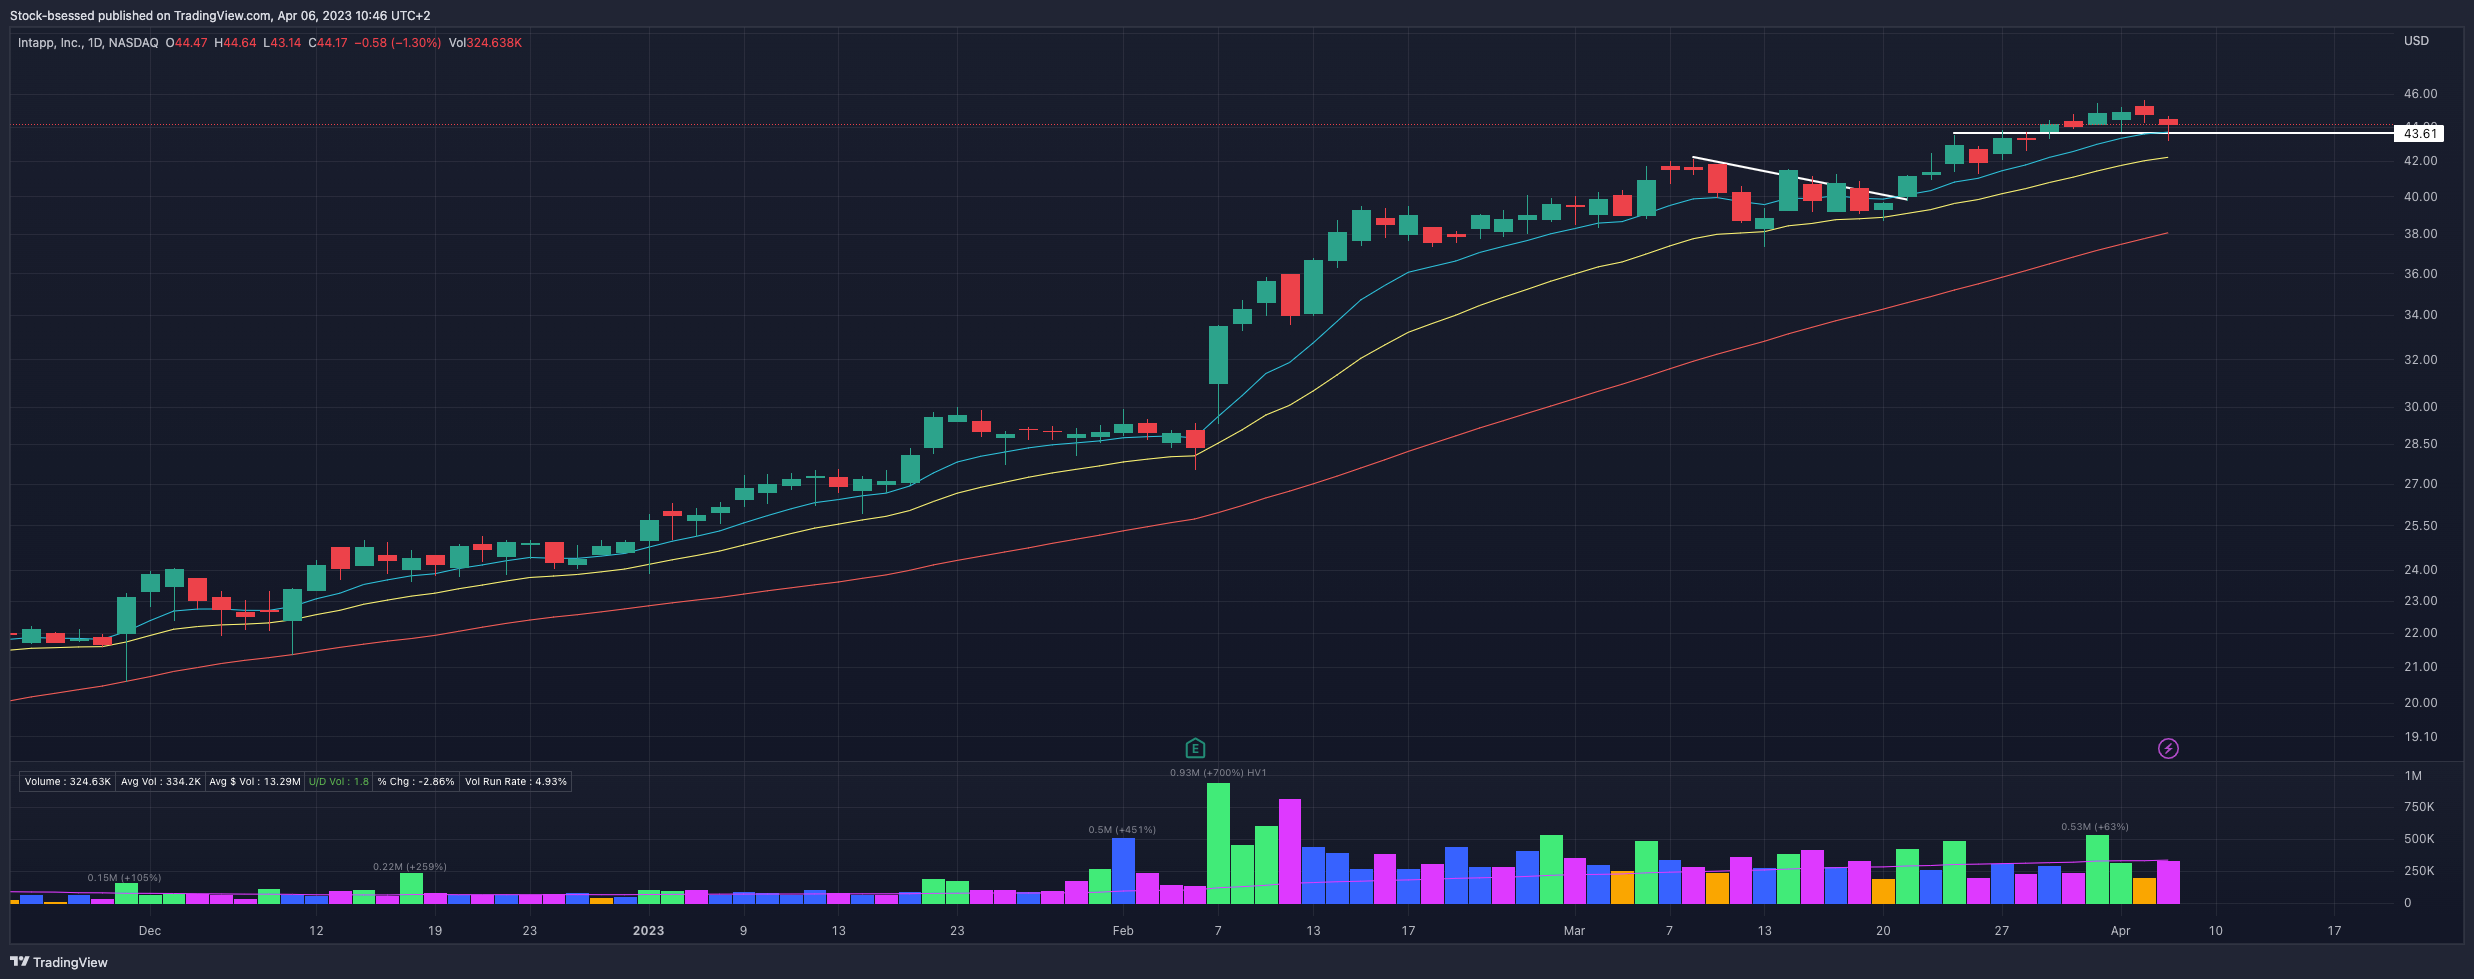
INTA 0.00%↑ Acts well holding recent gains as it flags at recent highs above the 10EMA and previous resistance:
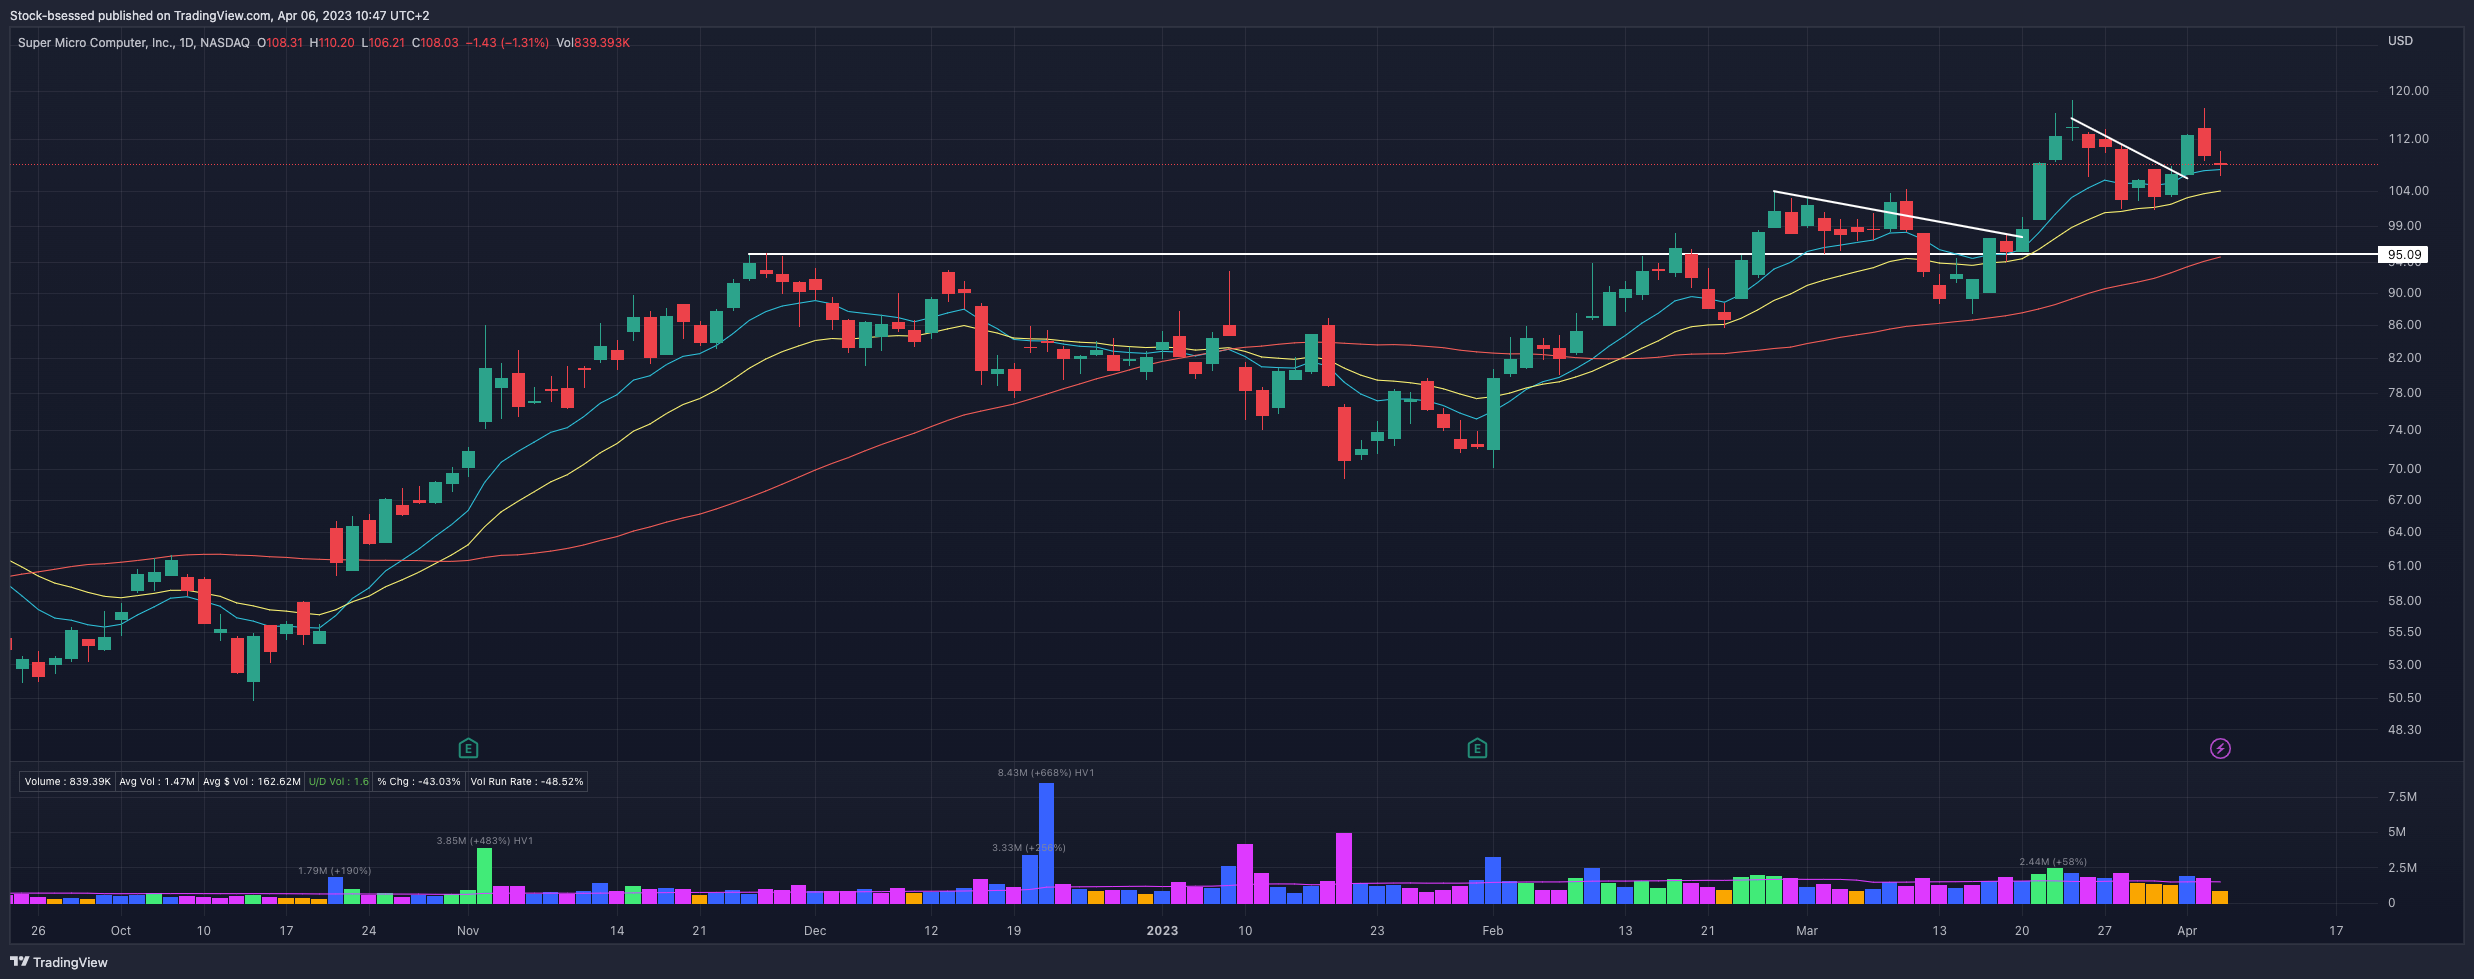
SMCI 0.00%↑ Key moving averages trending upwards nicely with price and buyers step in at logical areas of support once more:
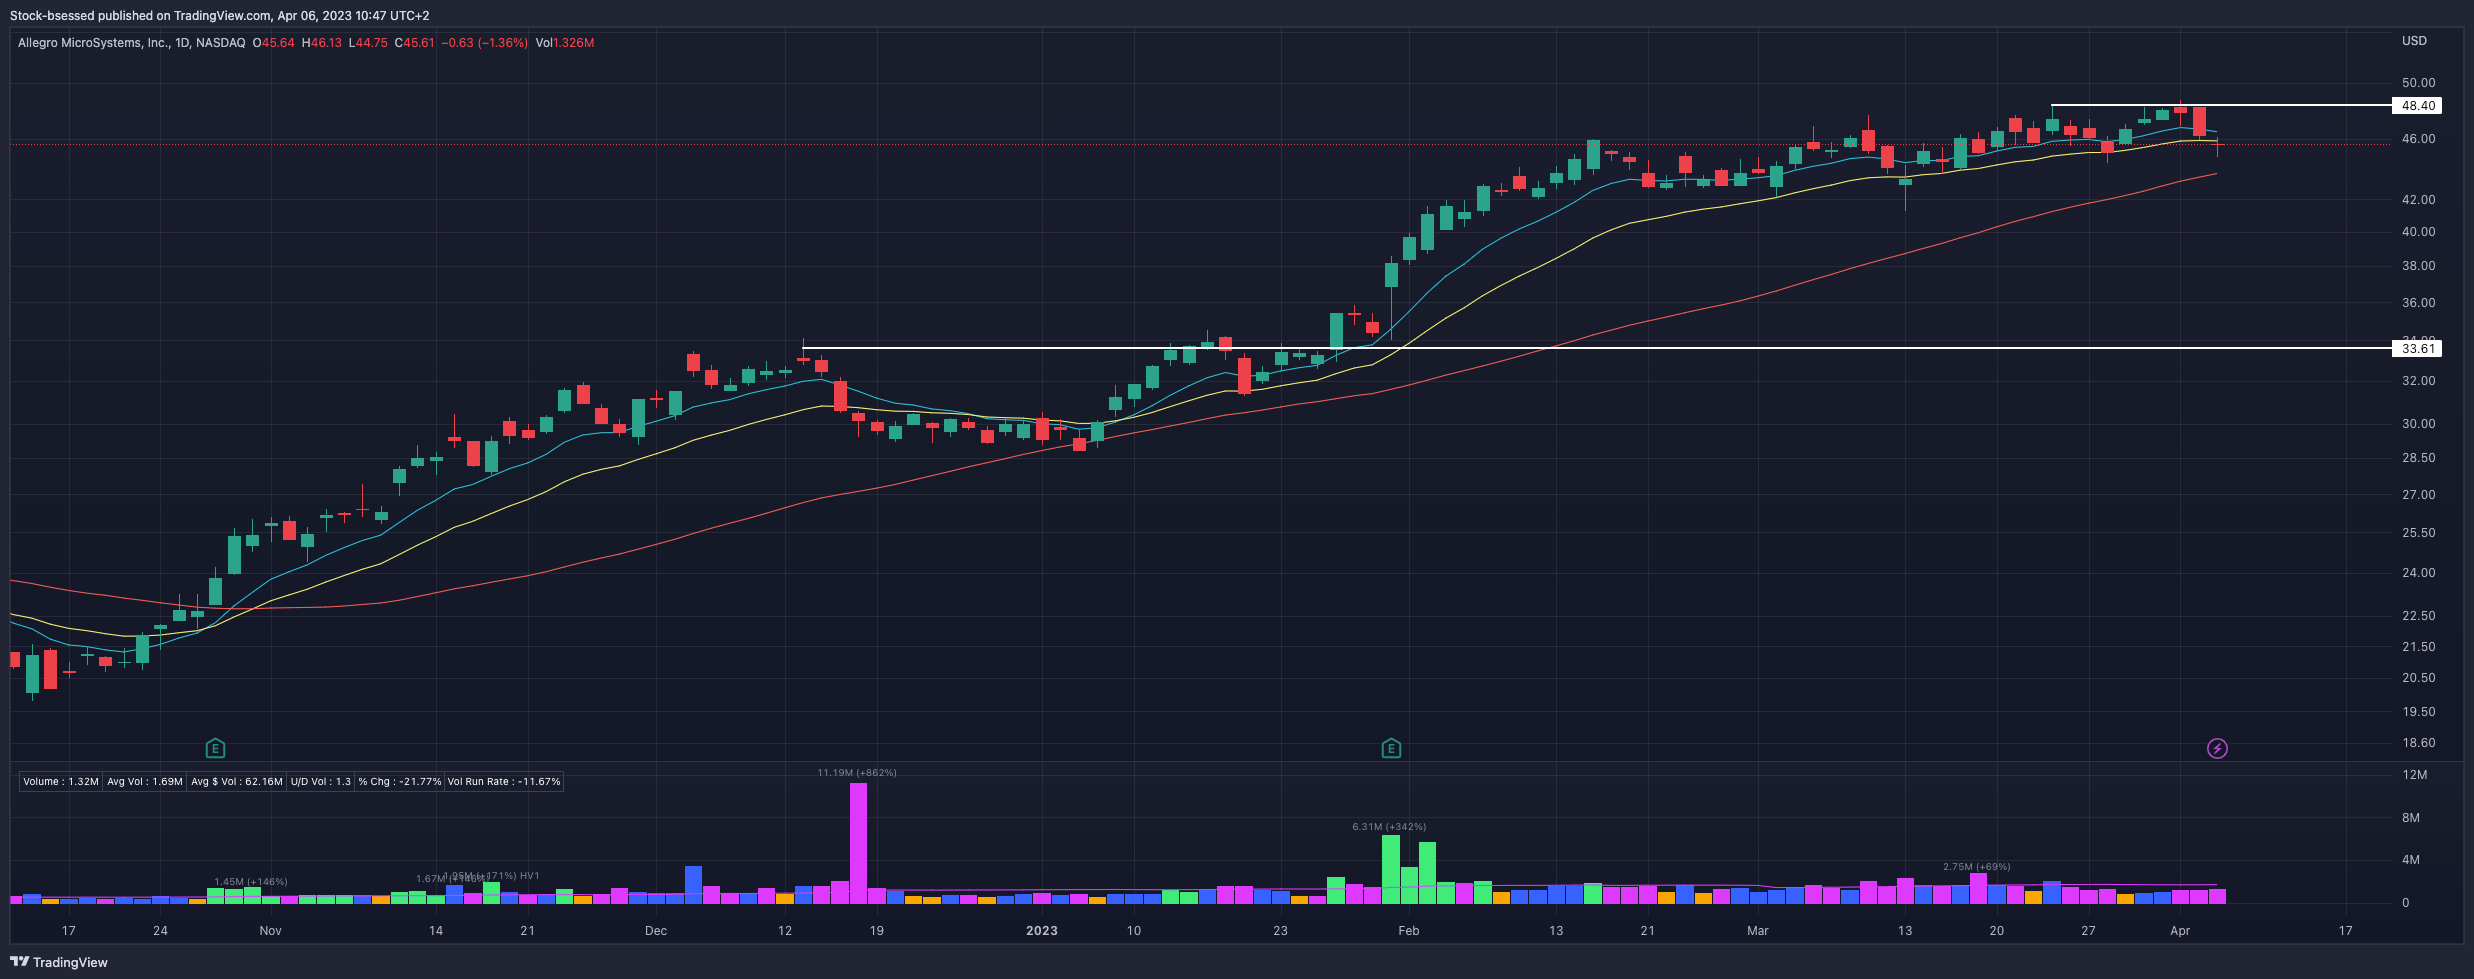
ALGM 0.00%↑ Now closing below the 10/20EMAs and would like to see a positive reaction near the 50-day moving average if we get there:
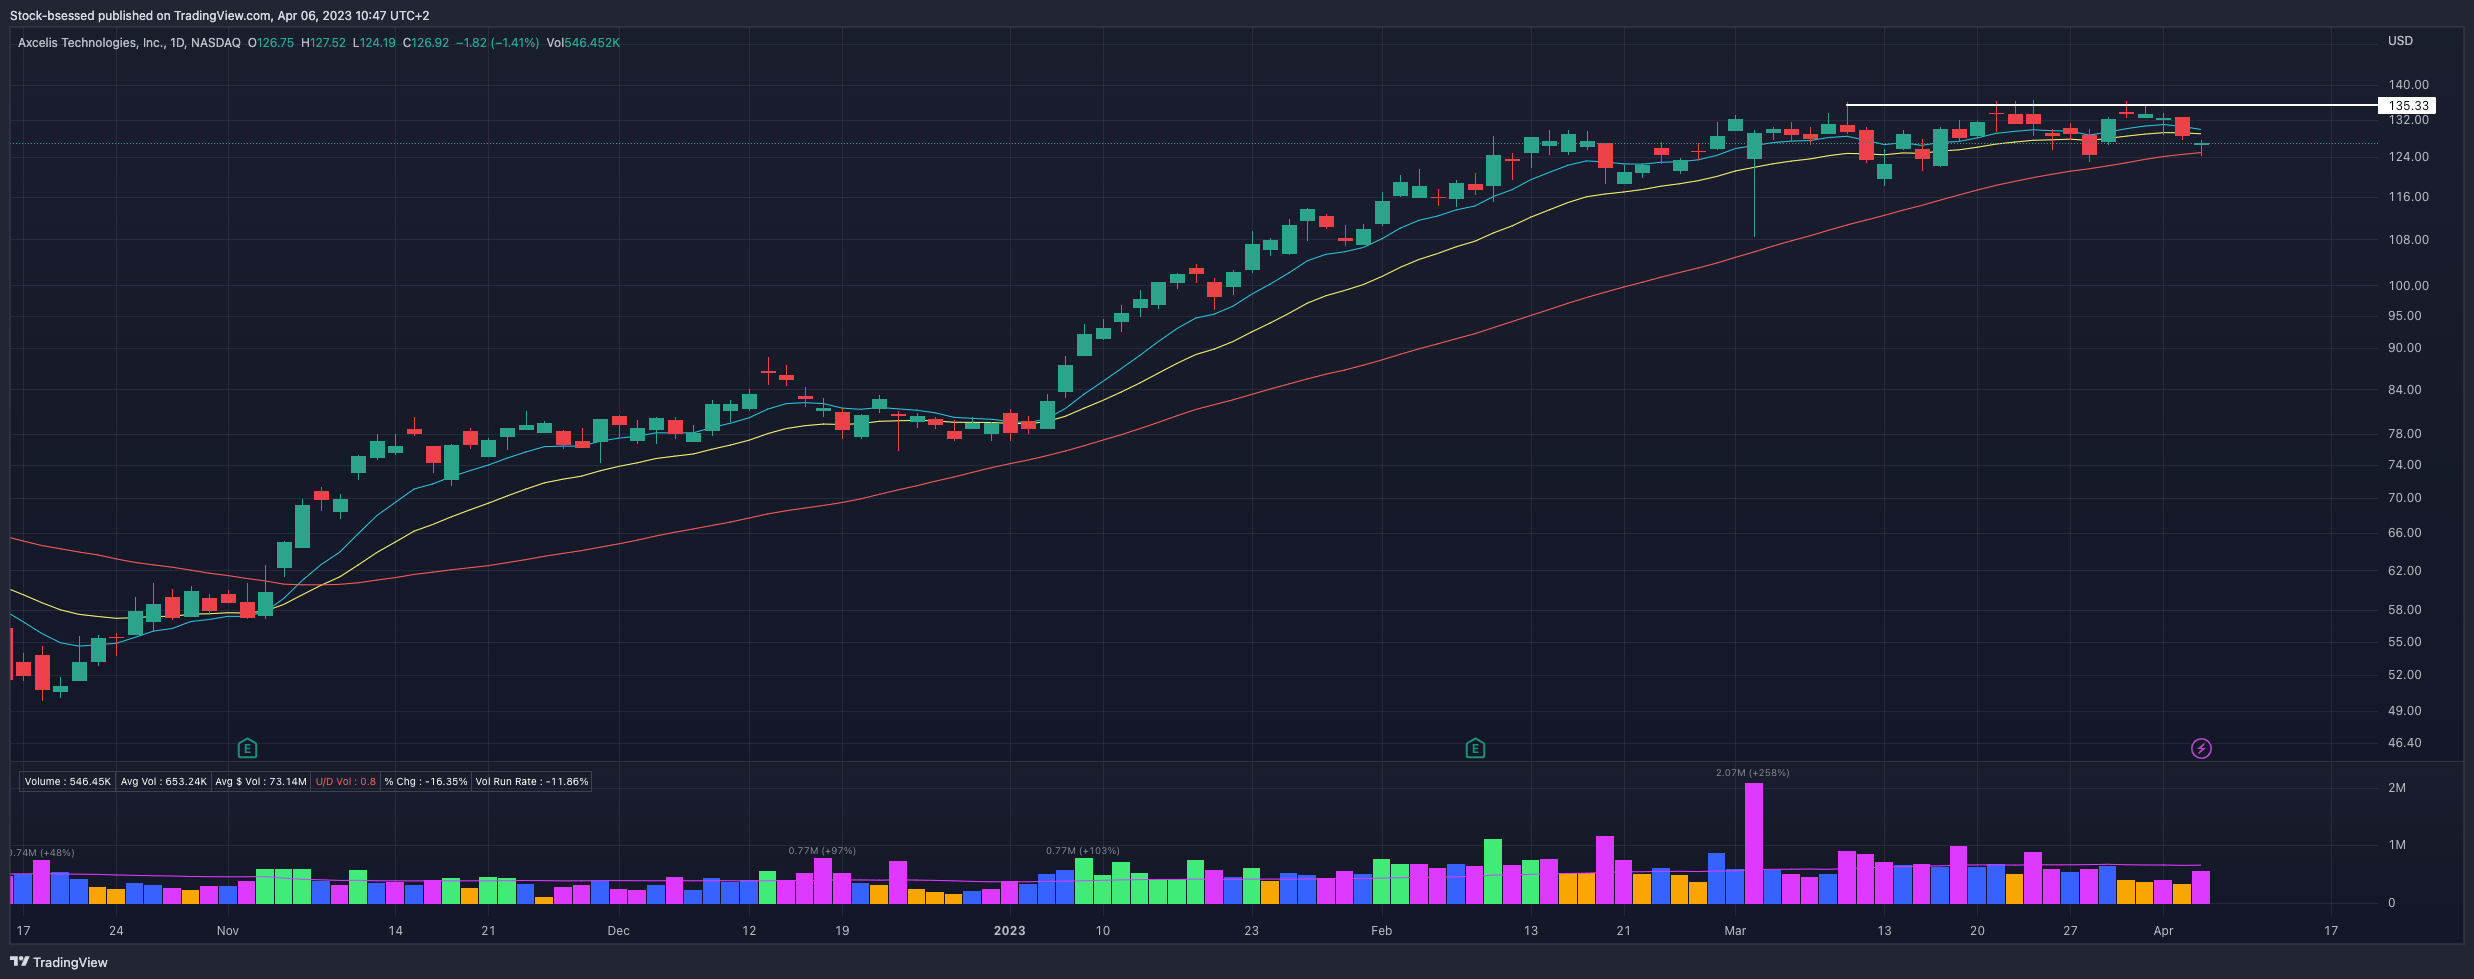
ACLS 0.00%↑ Buyers step in well at the 50-day moving average to close the session quite well off the intra-day lows:
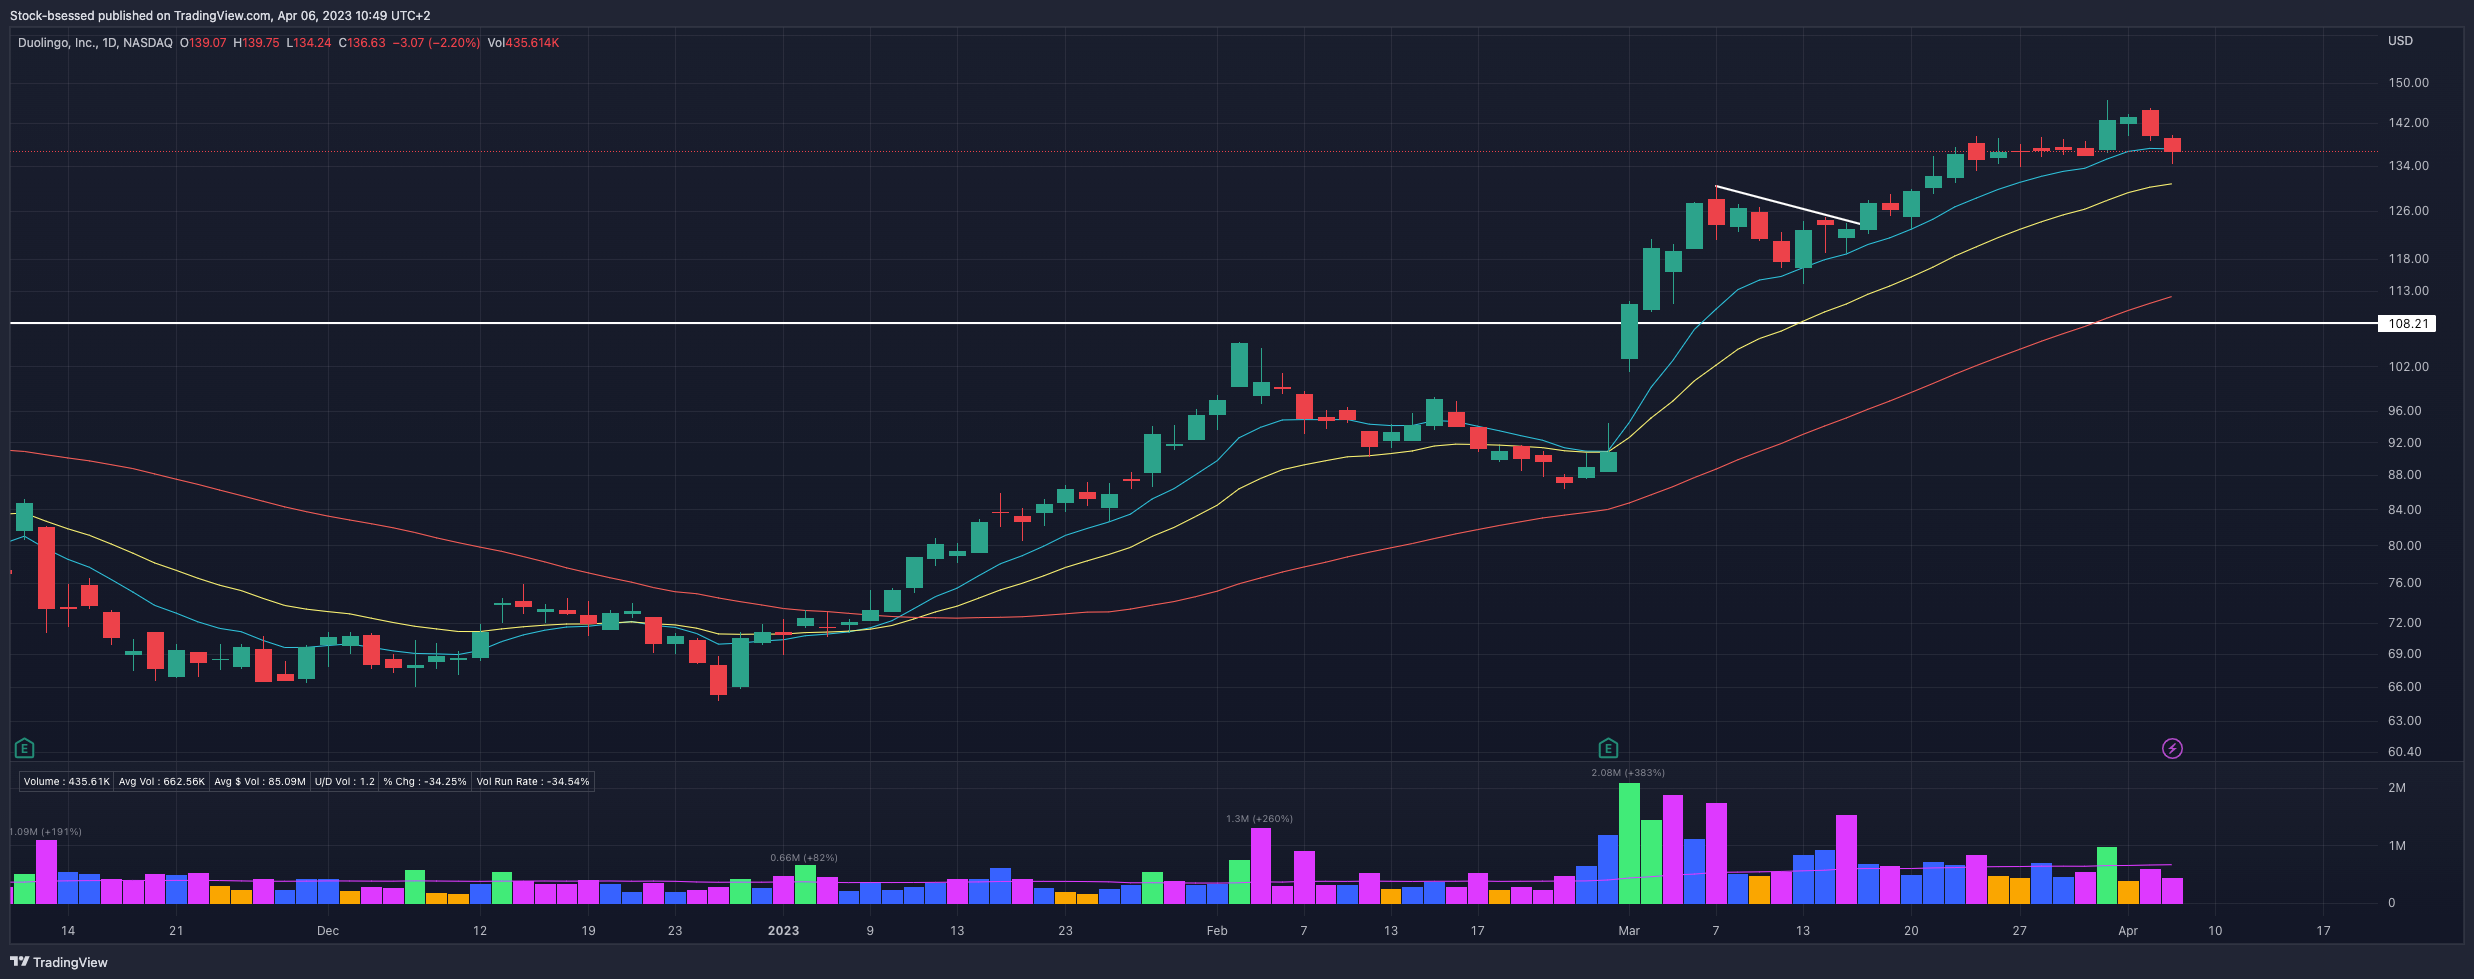
DUOL 0.00%↑ Now hovering right around the 10EMA and may need some more time before it gets going once more:
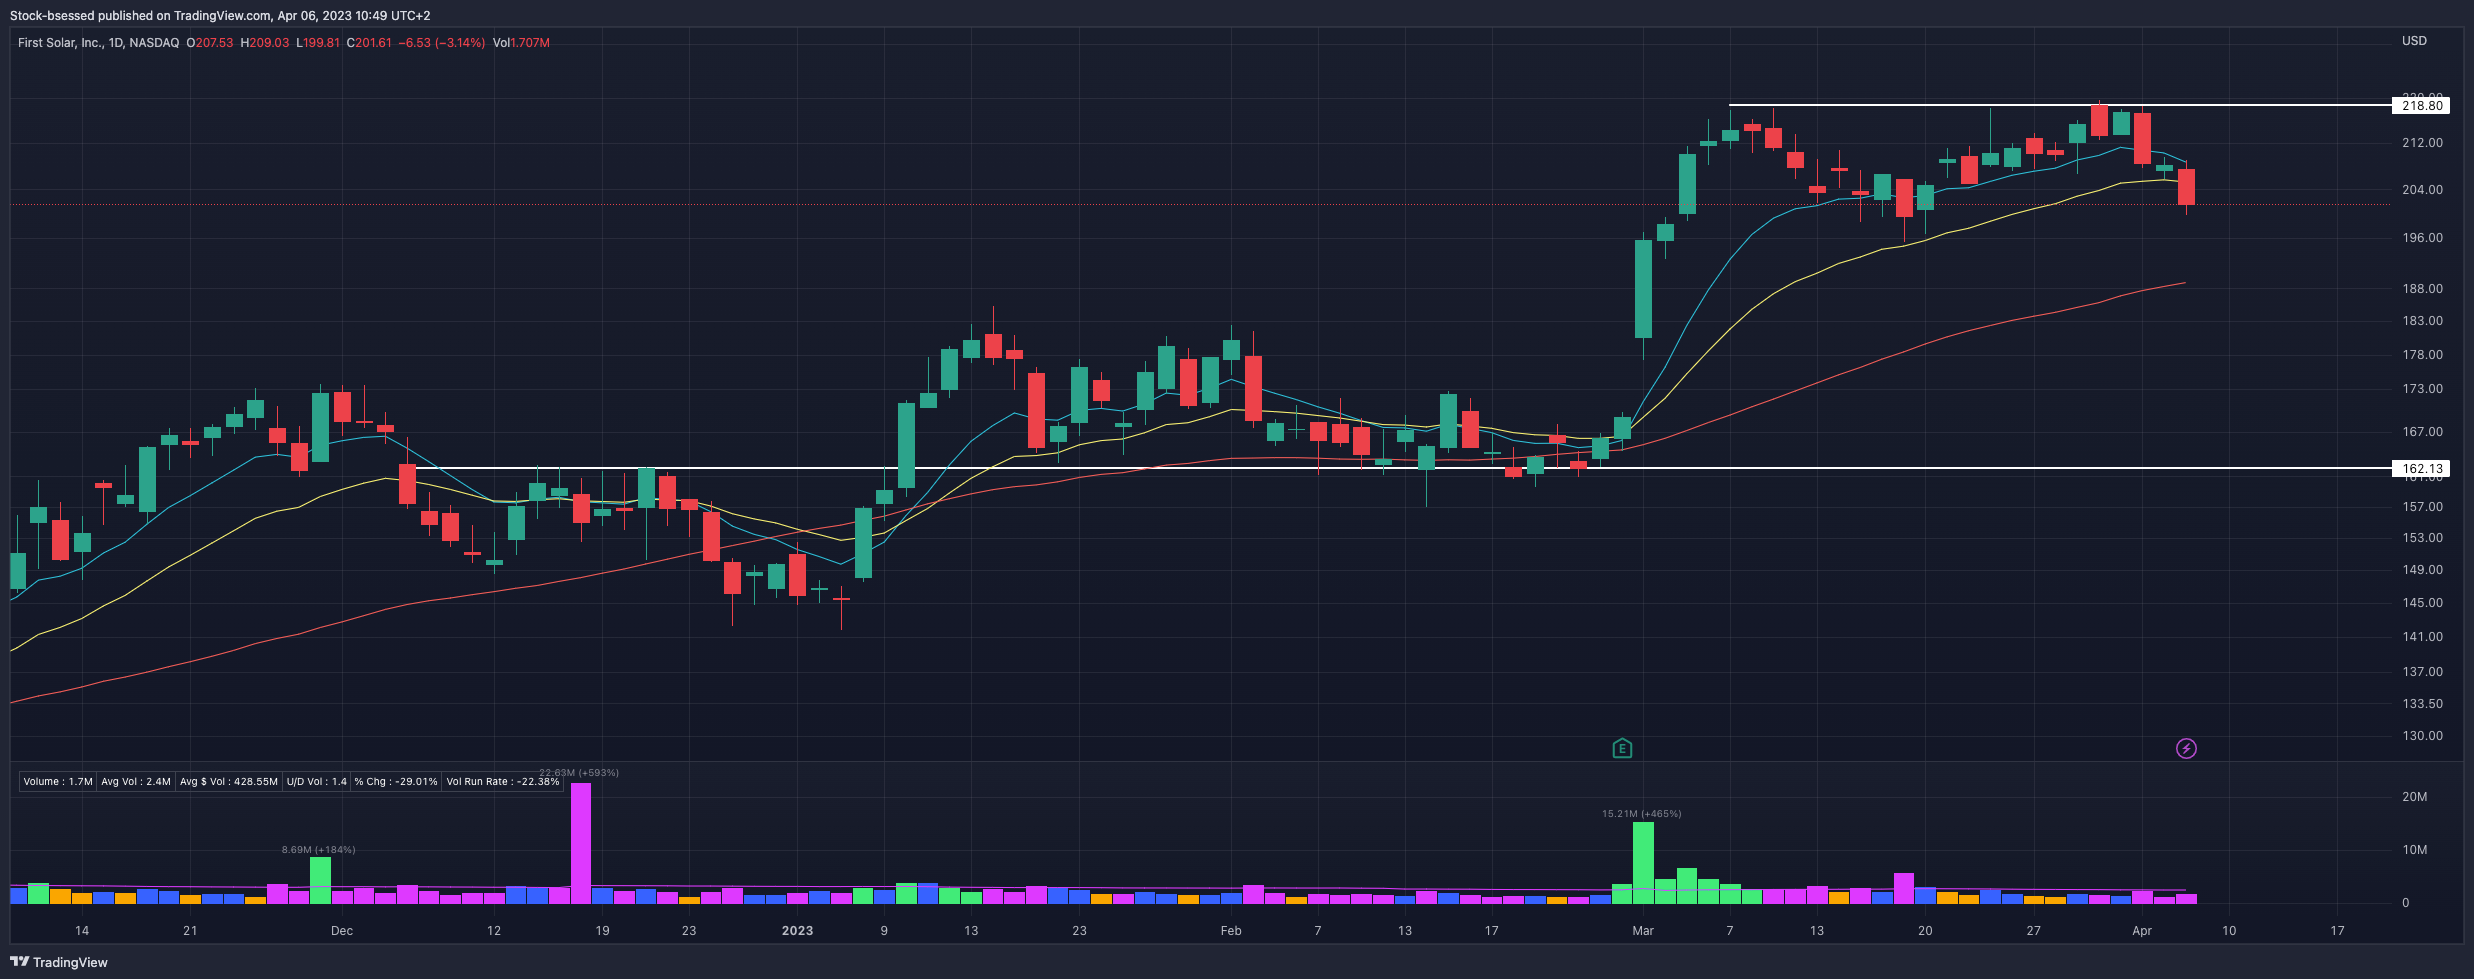
FSLR 0.00%↑ Closes poorly on the session down -3.1% while losing the 20EMA:
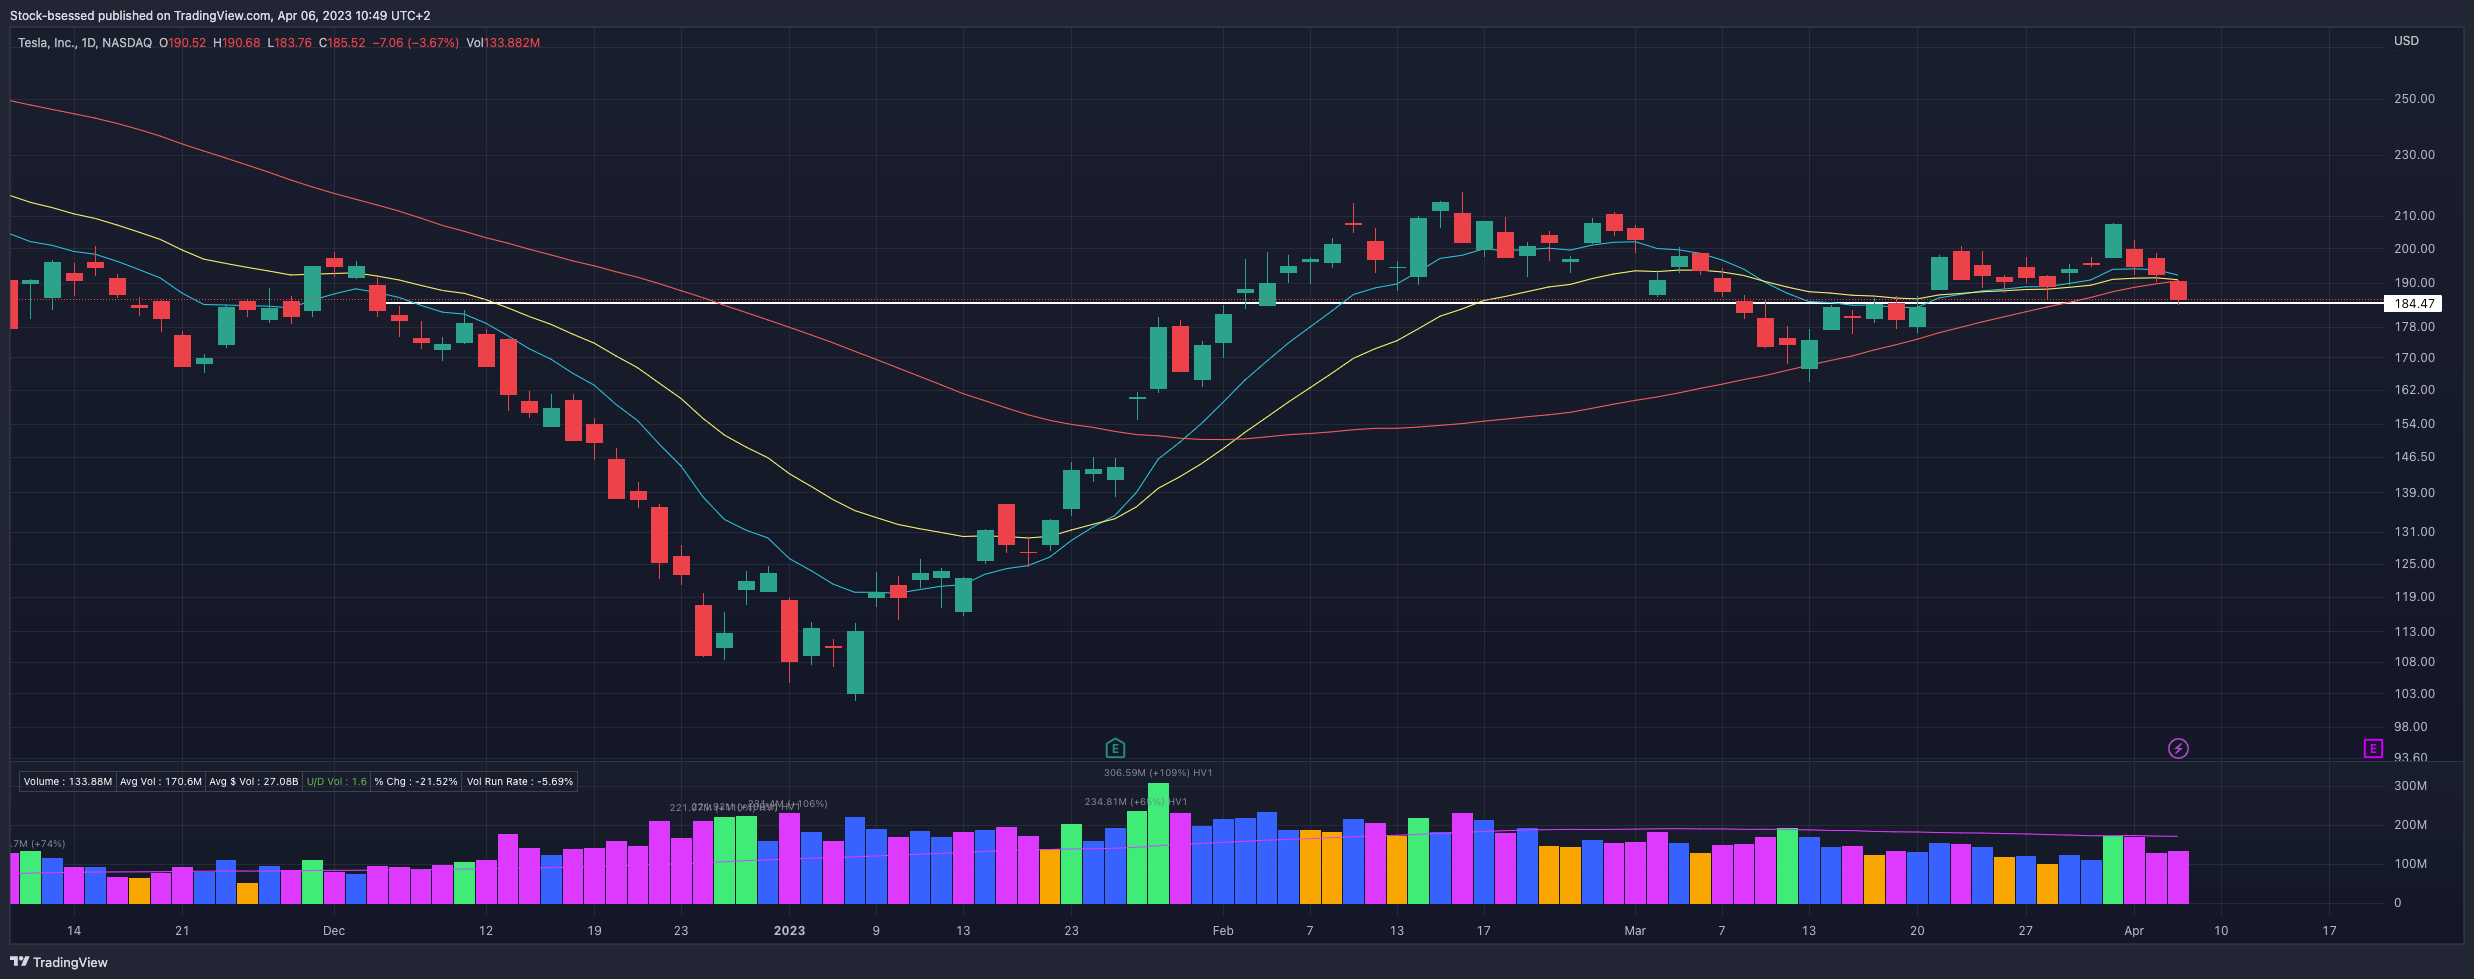
TSLA 0.00%↑ Weakness evident here as the short-term moving averages begin trending downwards as price is now below all KMAs as it retests the recent pivot here:
AI 0.00%↑ With a clear reminder of how quickly things can change - around -40% off the recent highs in just a few sessions as sellers maintain control since the recent short report news. Now below all KMAs after selling on MASSIVE volume:


In the following sections of the daily plan I go over additional research in preparation for the next session:
✅ Individual sector analysis
✅ 4 Scans with results to get stocks with leadership qualities on our radar
✅ Personal Portfolio Update
✅ Stocks currently on my focus list with actionable trade ideas - The best setups from a risk/reward perspective
Keep reading with a 7-day free trial
Subscribe to Stockbsessed to keep reading this post and get 7 days of free access to the full post archives.