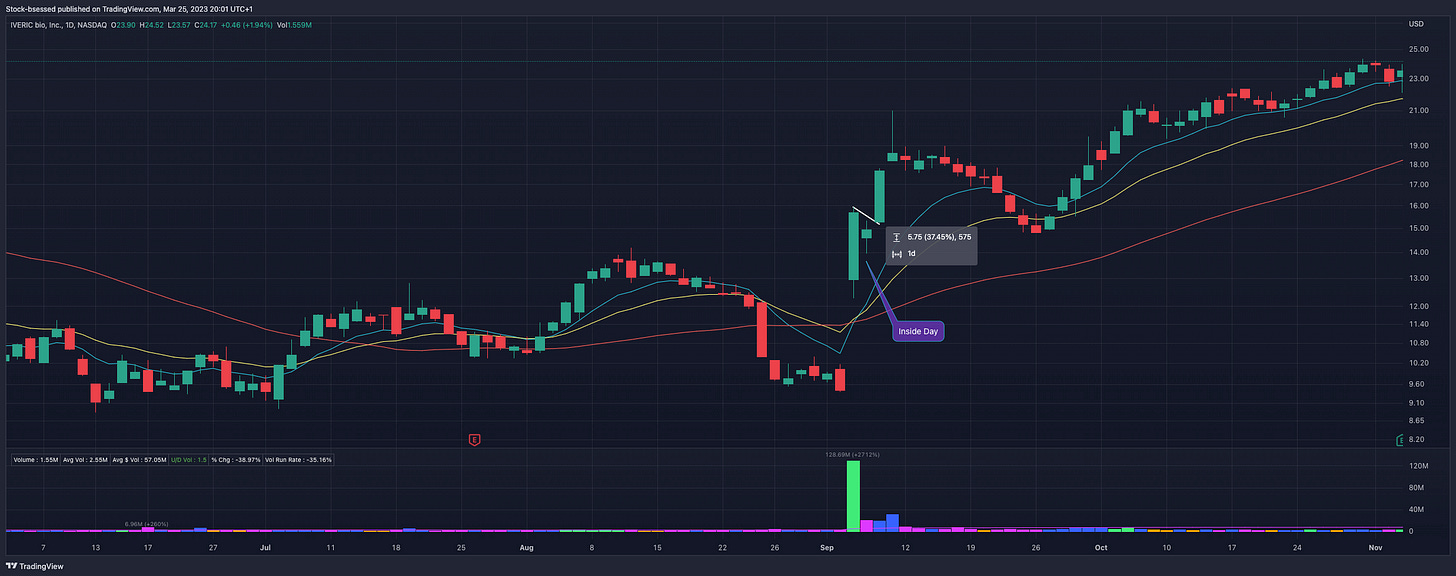
An inside day is a candlestick chart pattern where the trading range of a stocks happens to be within the range of the previous day's high and low, so that the bar is completely inside the previous day’s.
Simply put, if a stock has a high of $105 and a low of $100 in a given session, and the next day the stock trades between $101-$103, then the second day is an inside day because its range is completely within the trading range of the prior session.
Now I do not simply go out and buy every single inside day randomly - far from it. It is important to realize that an inside day on its own is in no way a signal to buy or sell, it is the overall context of an inside day within its trend that may provide a trading opportunity.
The way I incorporate them into my overall trading system is by using points of the trading range as areas of reference - the high, low and close of the inside day act as pivots for me that allow me to manage risk in a stress-free way.
I find that a lot of my stress and worry early on in my trading came from a lack of accepting the potential outcome of a trade prior to entering - it is not only unreasonable, but also impossible to expect that every trade you make will be a winner.
If you enter a trade with clearly-defined risk and reward metrics that fit your system - you are internally accepting that regardless if the trade goes on to be a winner or loser, you followed your plan and in the long run (if you truly have an edge in the market), you will be profitable by continuing to do so. This stresses the importance of trading with a plan at all times. Trading without a plan is similar to driving blind.
Using inside days allows you to have clearly defined areas both for entering a trade as well as managing risk against - this is why I think it is one of the simplest tools to incorporate into a trading system and one that can be very helpful to beginning traders.
What I look for in any trade:
Momentum in a given direction
Respect to key moving averages
Tightness to get involved at a low-risk spot
ACB 0.00%↑ December 2017
Showed clear momentum running +200% in around a month until pulling back nicely to the key moving averages and tightening up right under this descending trend line. Before breaking out once more, it gave a nice low-risk opportunity to get involved by printing this tight inside day shown below:
What is key here is how I use the highs and lows of that inside day bar as pivots - when other criteria such as previous momentum is present, I consider:
Buying the stock on a break above the high of the day
Setting my stop right below the low of the day
The opposite could be said if shorting.
This works excellently when all this comes together in the context of an overall larger pattern, in this case it is a descending trend line setup but it could be anything - a cup and handle, double bottom etc. The key is identifying these areas that allow tight risk management.
This went on to run an impressive +114% in just 12 days after breaking above the inside day high / descending trend line, just by risking -1.46%, an impressive 78R!
ADXS 0.00%↑ December 2019
Once again, what is important here is how the inside day plays a part of the bigger overall pattern - it is merely a candle in this descending trend line setup which has shown previous momentum with respect for key moving averages and allows a well-defined entry and risk-management:
The inside day values are as follow:
High of day: 48
Low of day: 45.08
Risk: -6.27%
Went on to run +141% in just 2 week for an impressive R22.5!
AEO 0.00%↑ December 1998
The inside day values are as follow:
High of day: 5.821
Low of day: 5.61
Risk: -3.67%
Continued to trend upwards nicely after breaking out.
An example of a double inside day here as we see how inside days are crucials in the overall tightening of a given setup:
The inside day values are as follow:
High of day: 1.19
Low of day: 1.07
Risk: -7.08%
Went on to gain +86% from entry in just 2 sessions; a 12R trade.
AG 0.00%↑ April 2016
High of day: 6.44
Low of day: 6.24
Risk: -3.10%
After:
Gap-Ups
I also occasionally incorporate this into how I handle earnings gap-ups - I find it is a great way to get involved in stocks with leadership potential that may be at the beginning of a new run with relatively low risk.
When I find the range of the inside bar to be too wide to place my stop loss at the low of the day - I may opt to manage risk against an intraday consolidation or quite often against the close of the inside day, so if it were to go negative on the session after breaking above the previous high of day I would be stopped out.
I had taken this trade last September managing risk against the close of the inside day - risking around -2.5% for a setup that went on to gain +37% in just 2 sessions:
Thanks for reading and hope you found this helpful! Consider subscribing and let me know if there are any other topics you’d like me to write on :)


