

Price-Pulse

Hey guys!
Let’s get right into it with another detailed report analysing the market’s moves this week as well as what to keep our eyes on moving forward..
Stockbsessed is neither an investment or financial advisor. Stockbsessed does not provide financial advice and none of the information being provided is to be seen as such.
General Market Overview
In contrast to a few weeks ago, my weekend routine and overall process of going through thousands of chart has shown me that we are lacking the proliferation of setups that we are exposed to when the market is working very well.
In no way is this saying things are not working or anything of the sort, it just may be the case that patience may be needed here in order to give the market enough time to setup with an abundant amount of sound setups once more.
This is a quote which really resonates with me and helps keep things in check for me, clarifying the importance of not forcing sub-par opportunities but truly waiting for your pitch and edge to show clearly:
I just wait until there is money lying in the corner, and all I have to do is go over there and pick it up. I do nothing in the meantime. - Jim Rogers
Session

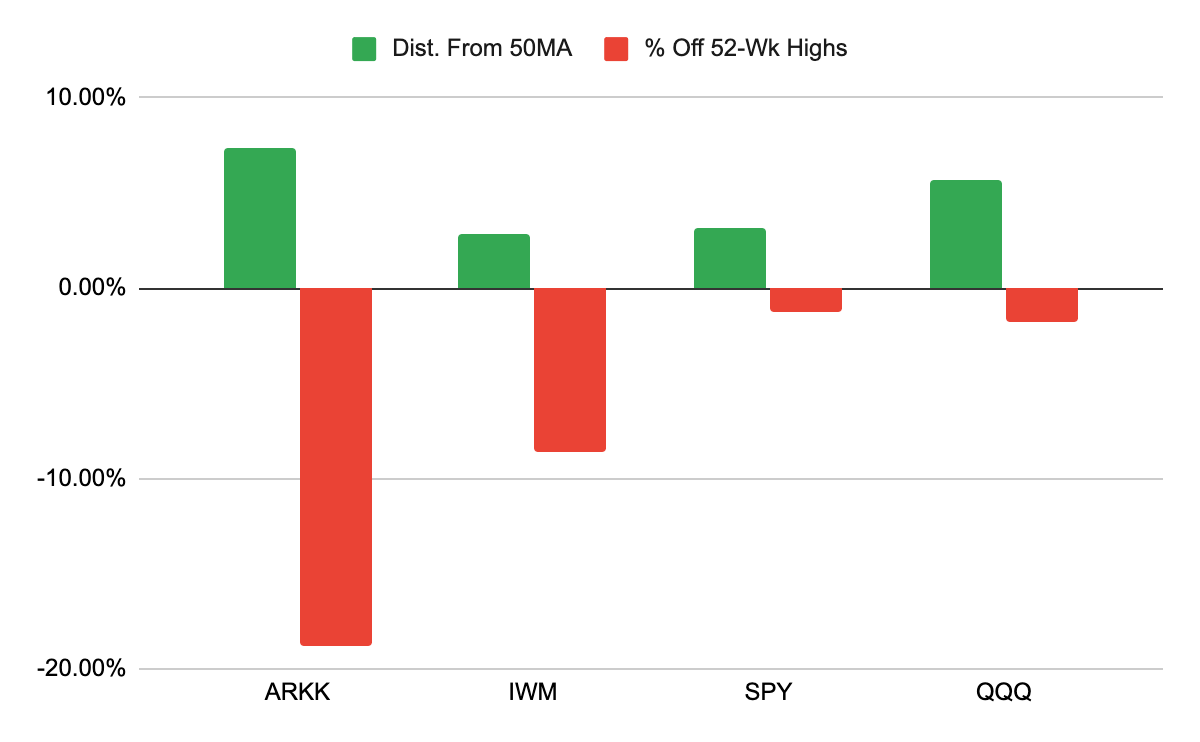
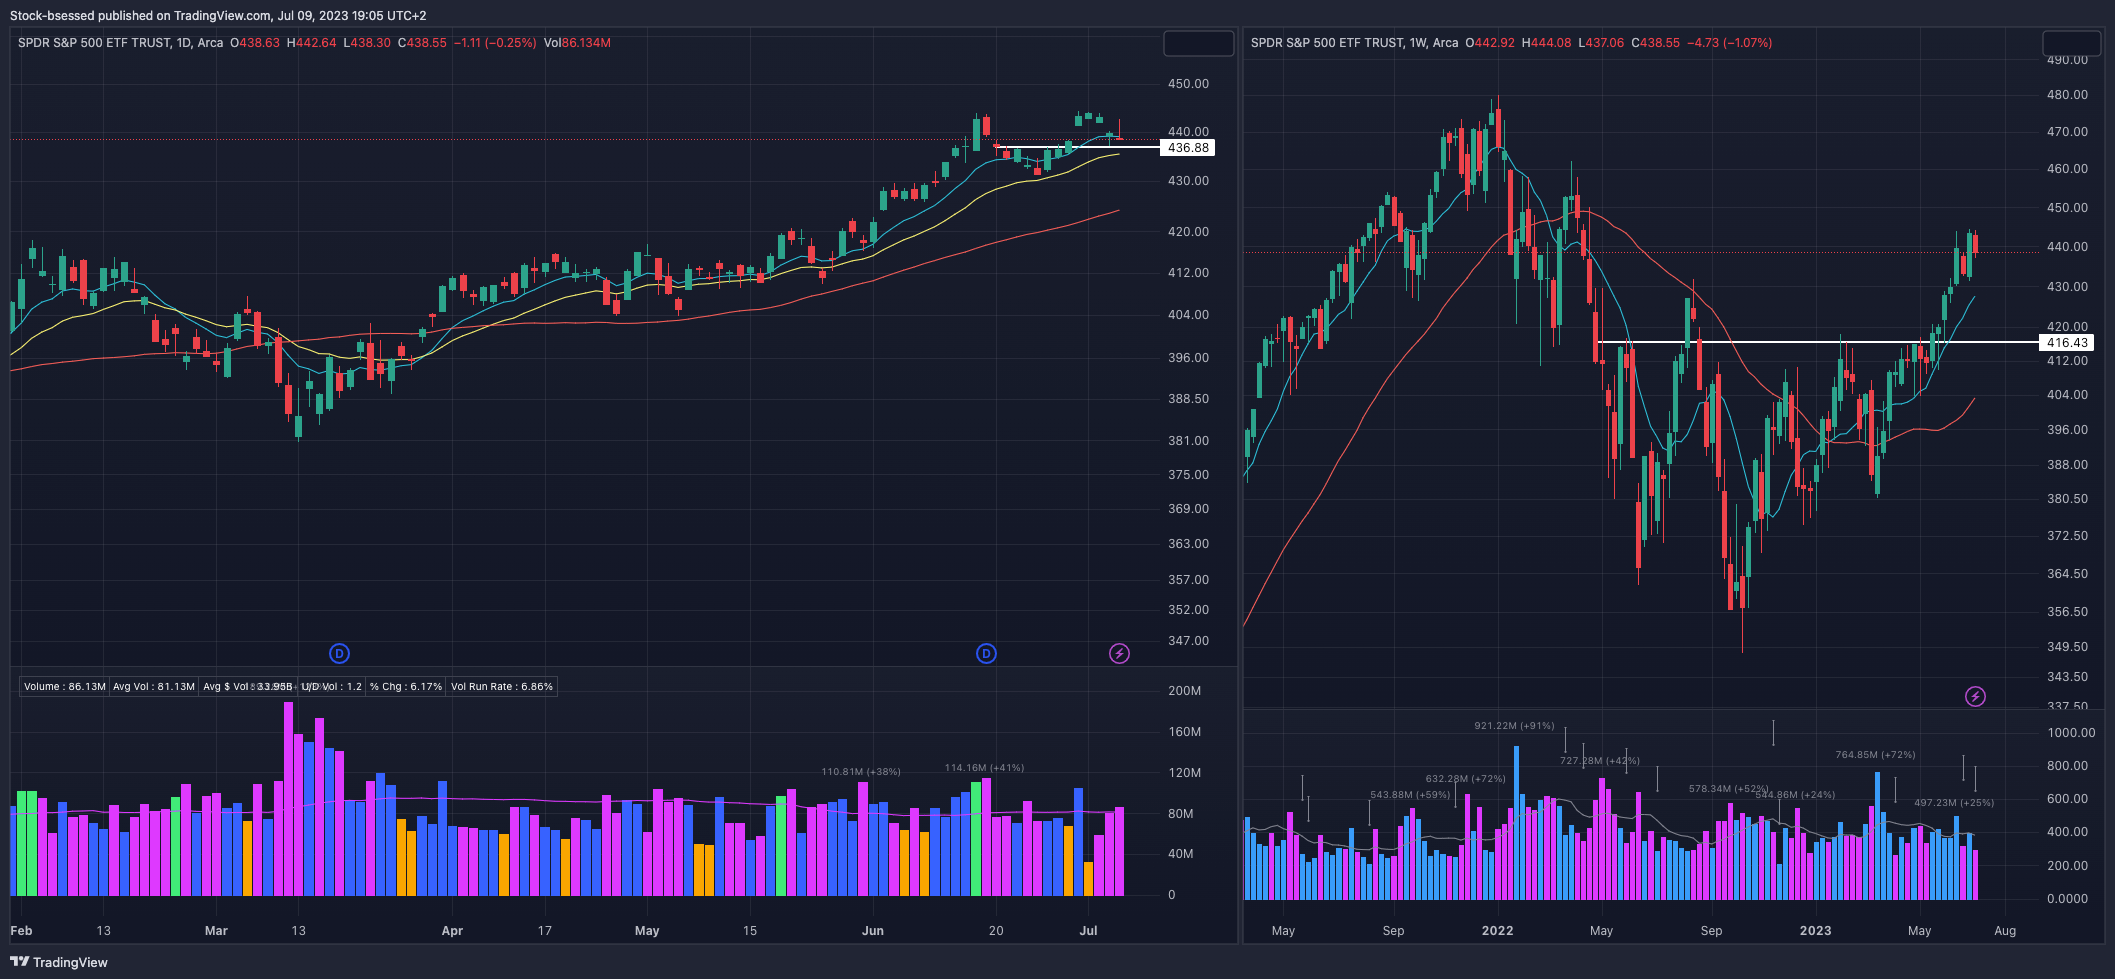
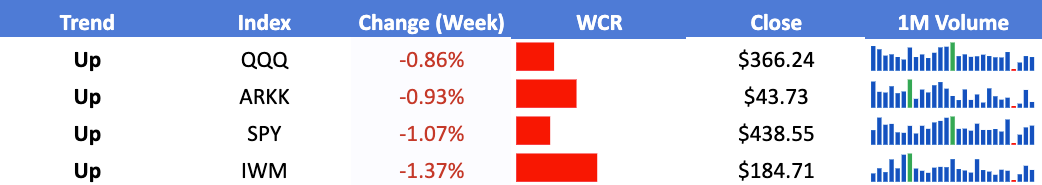
SPY 0.00%↑ Registers a -1.07% loss on the week after a poor close on Friday. Nothing broken just yet and so far seems to be regular back-and-filling with a re-tests of recent resistance now turned support around the 436 area. Continues trending nicely to the upside after the most recent base breakout around 415 as seen on the weekly chart on the right:
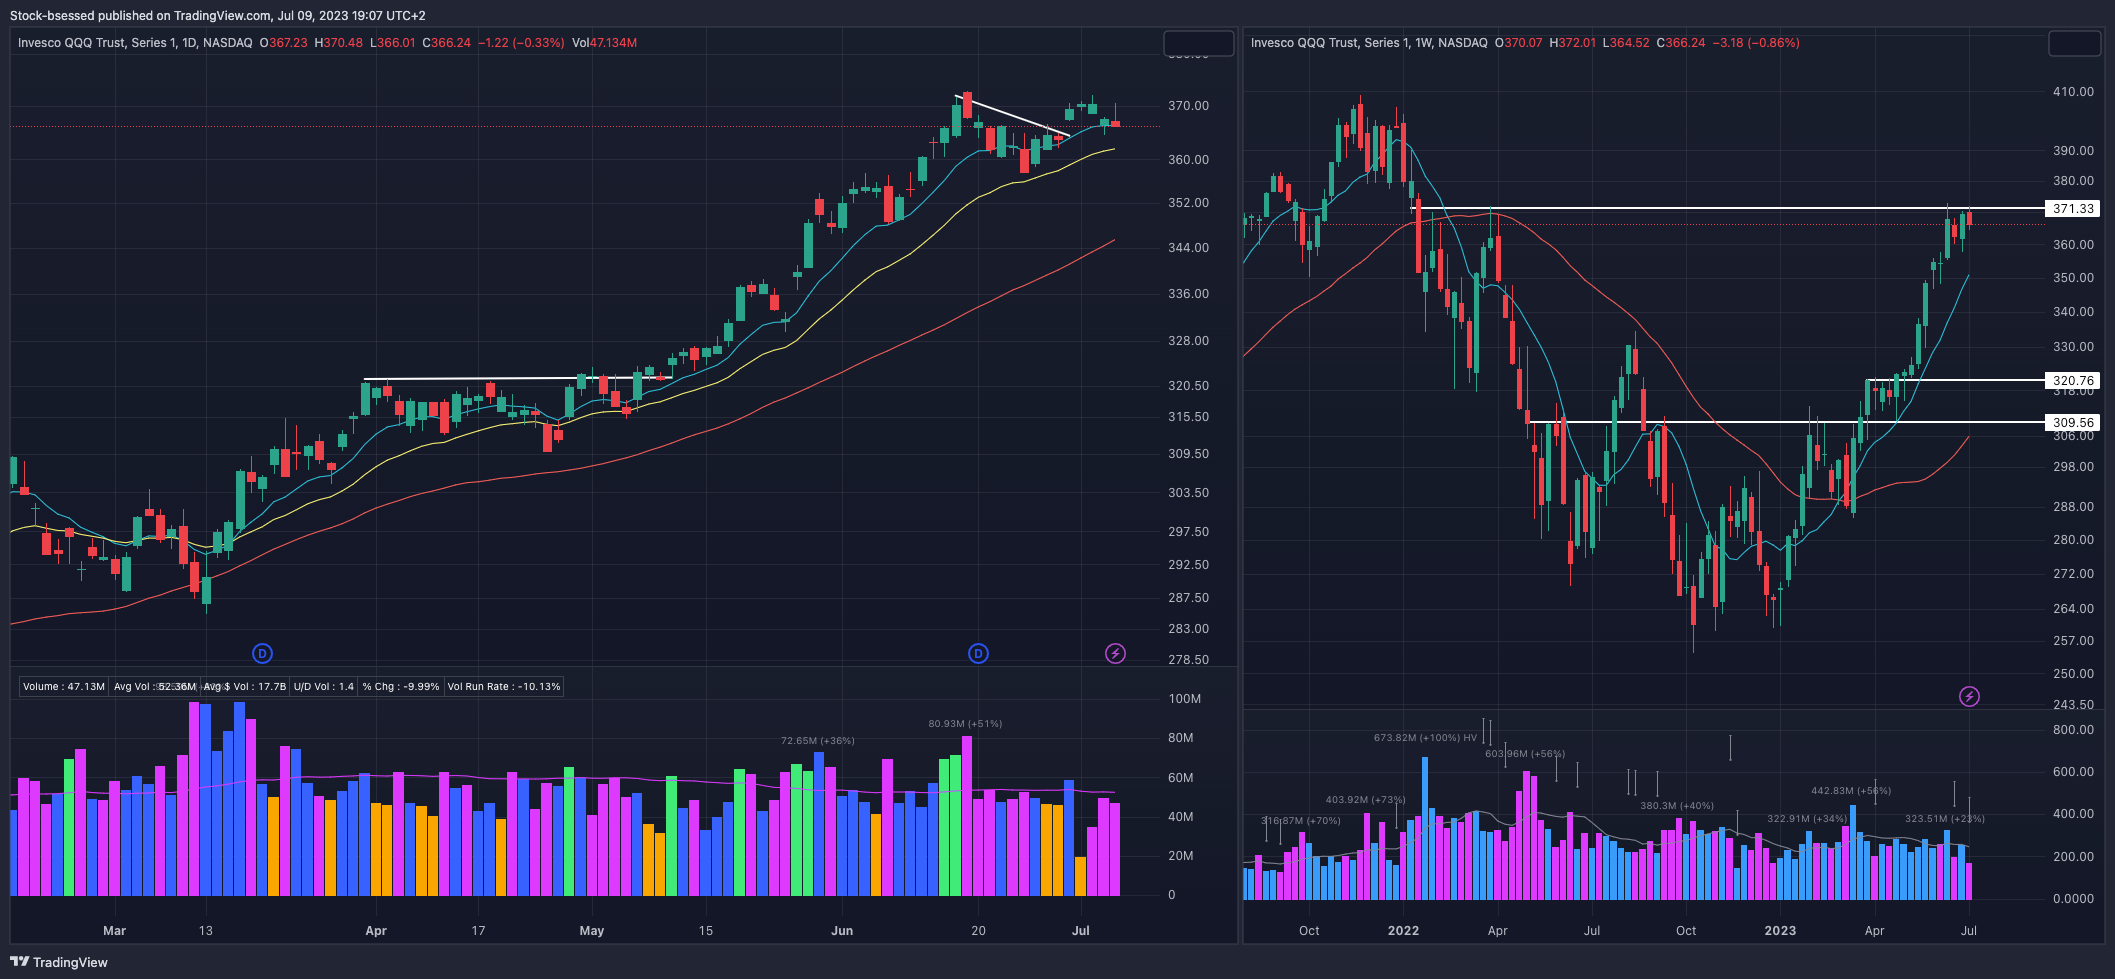
QQQ 0.00%↑ Weekly chart shows positive action as it continues to clear key levels. Some rest up here is to be expected now as we approach a key area of resistance around 371.
Daily chart shows little give-back this week after recently gapping above its descending trend line, was able to fill that gap and reverse to close well on Thursday:
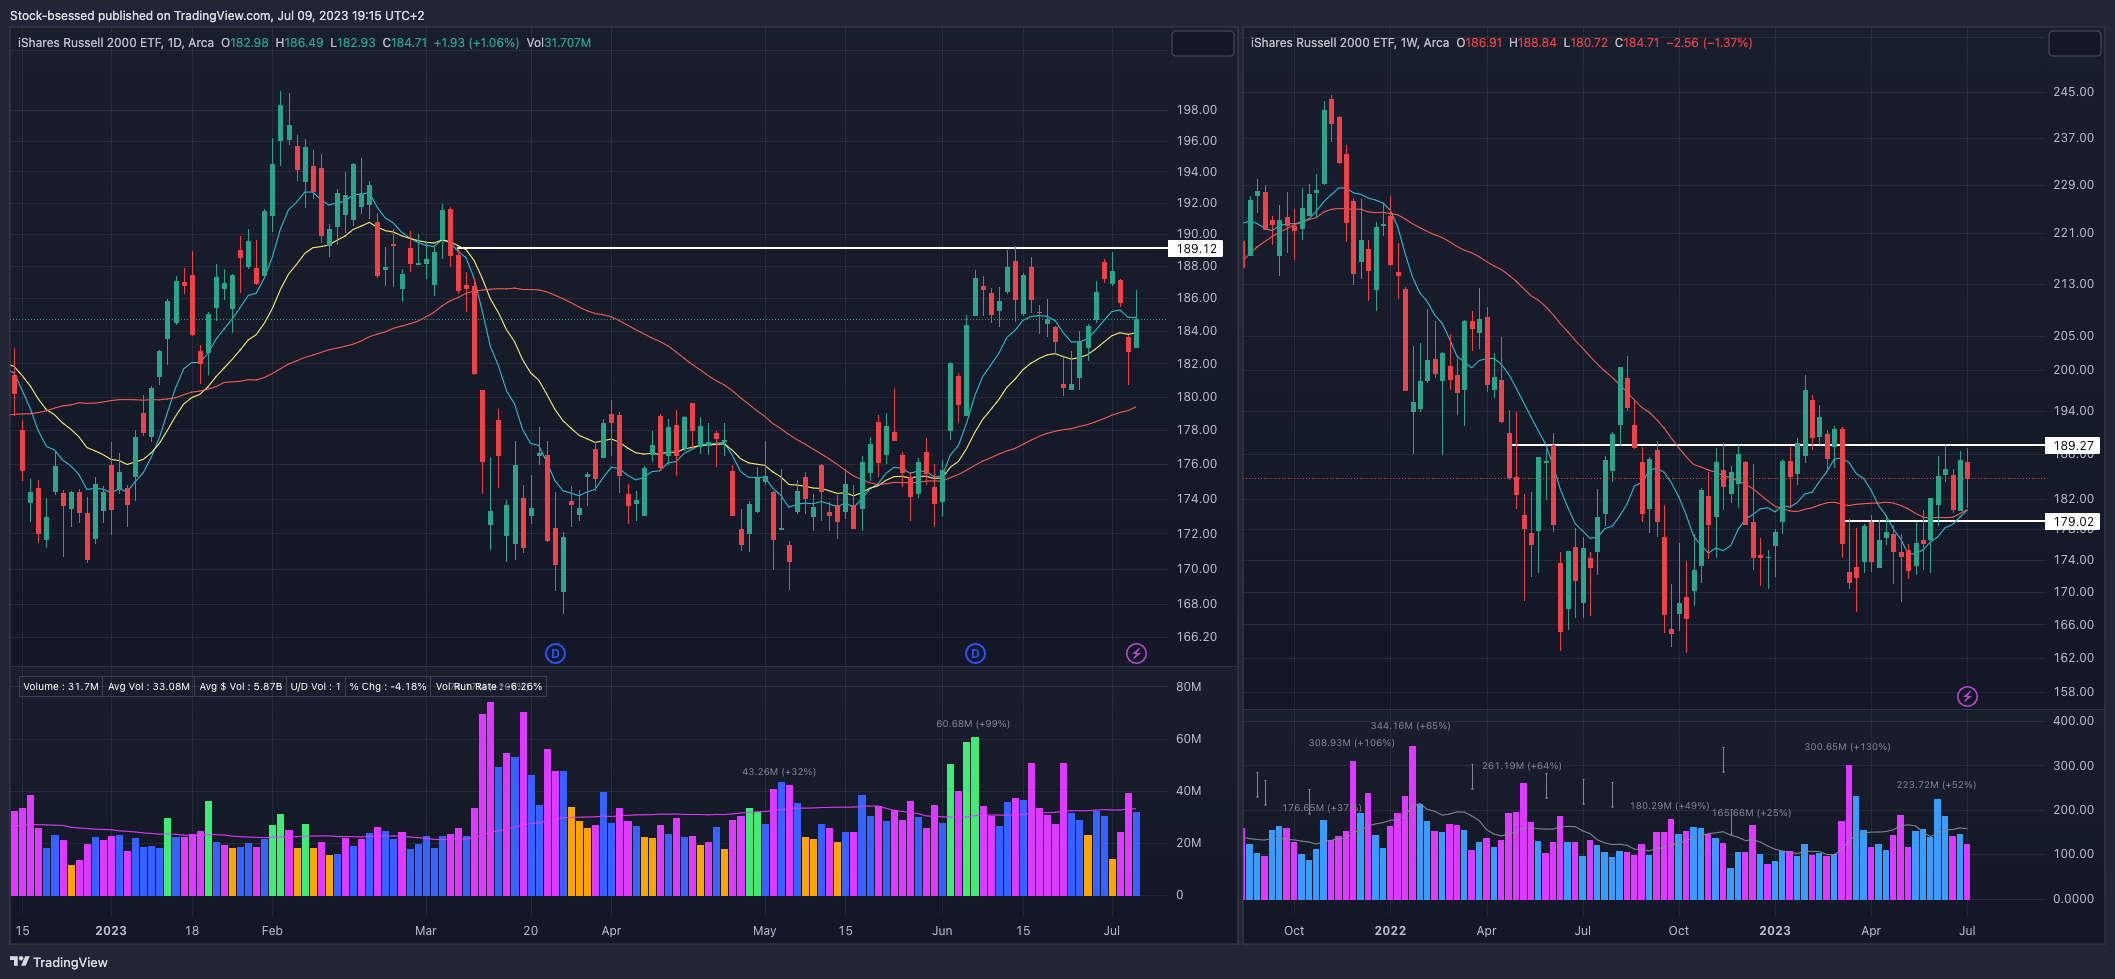
IWM 0.00%↑ Remains relatively weak in comparison, still in the process of building its base here right below the 190 area but not much more going on then chop for the time being:
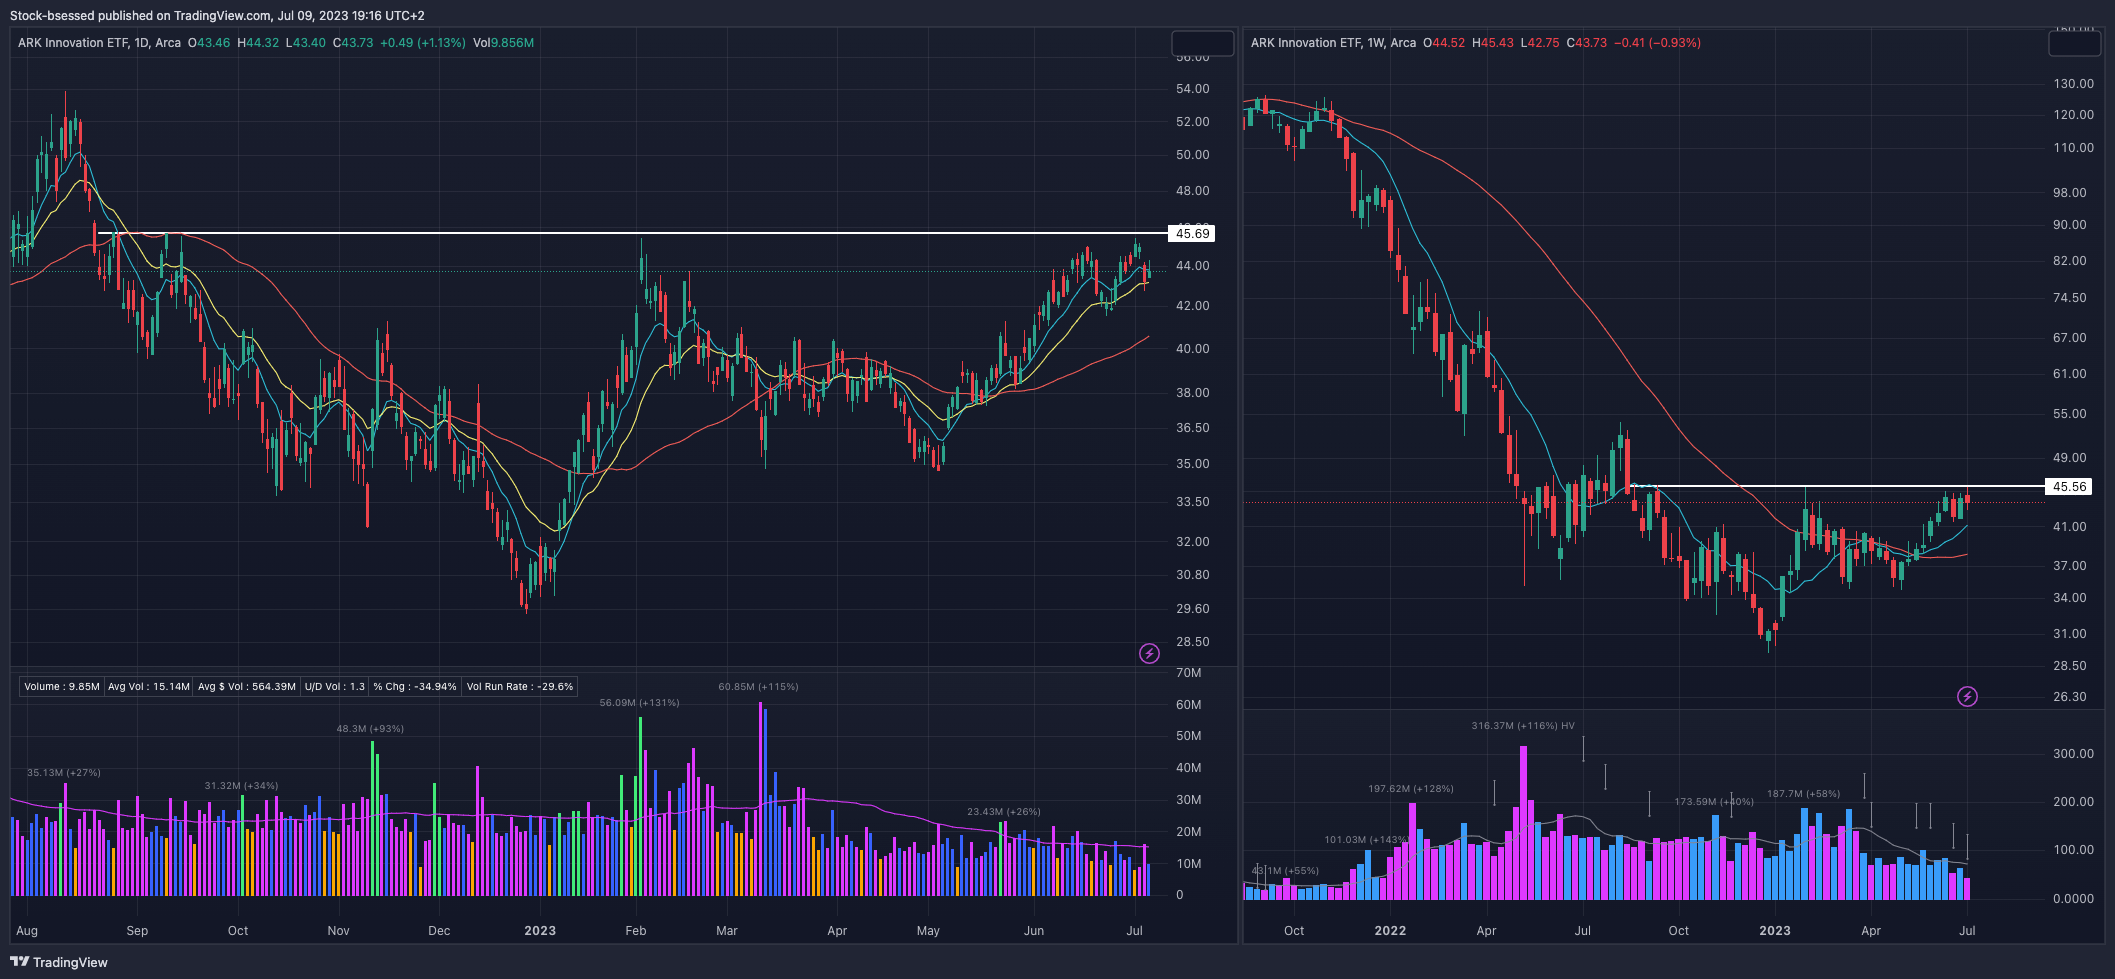
ARKK 0.00%↑ Has been trending upwards nicely as of late and remains within this large base right below the 46 area. May need some more time to tighten up here before attempting to break out:
Week
Breadth analysis:
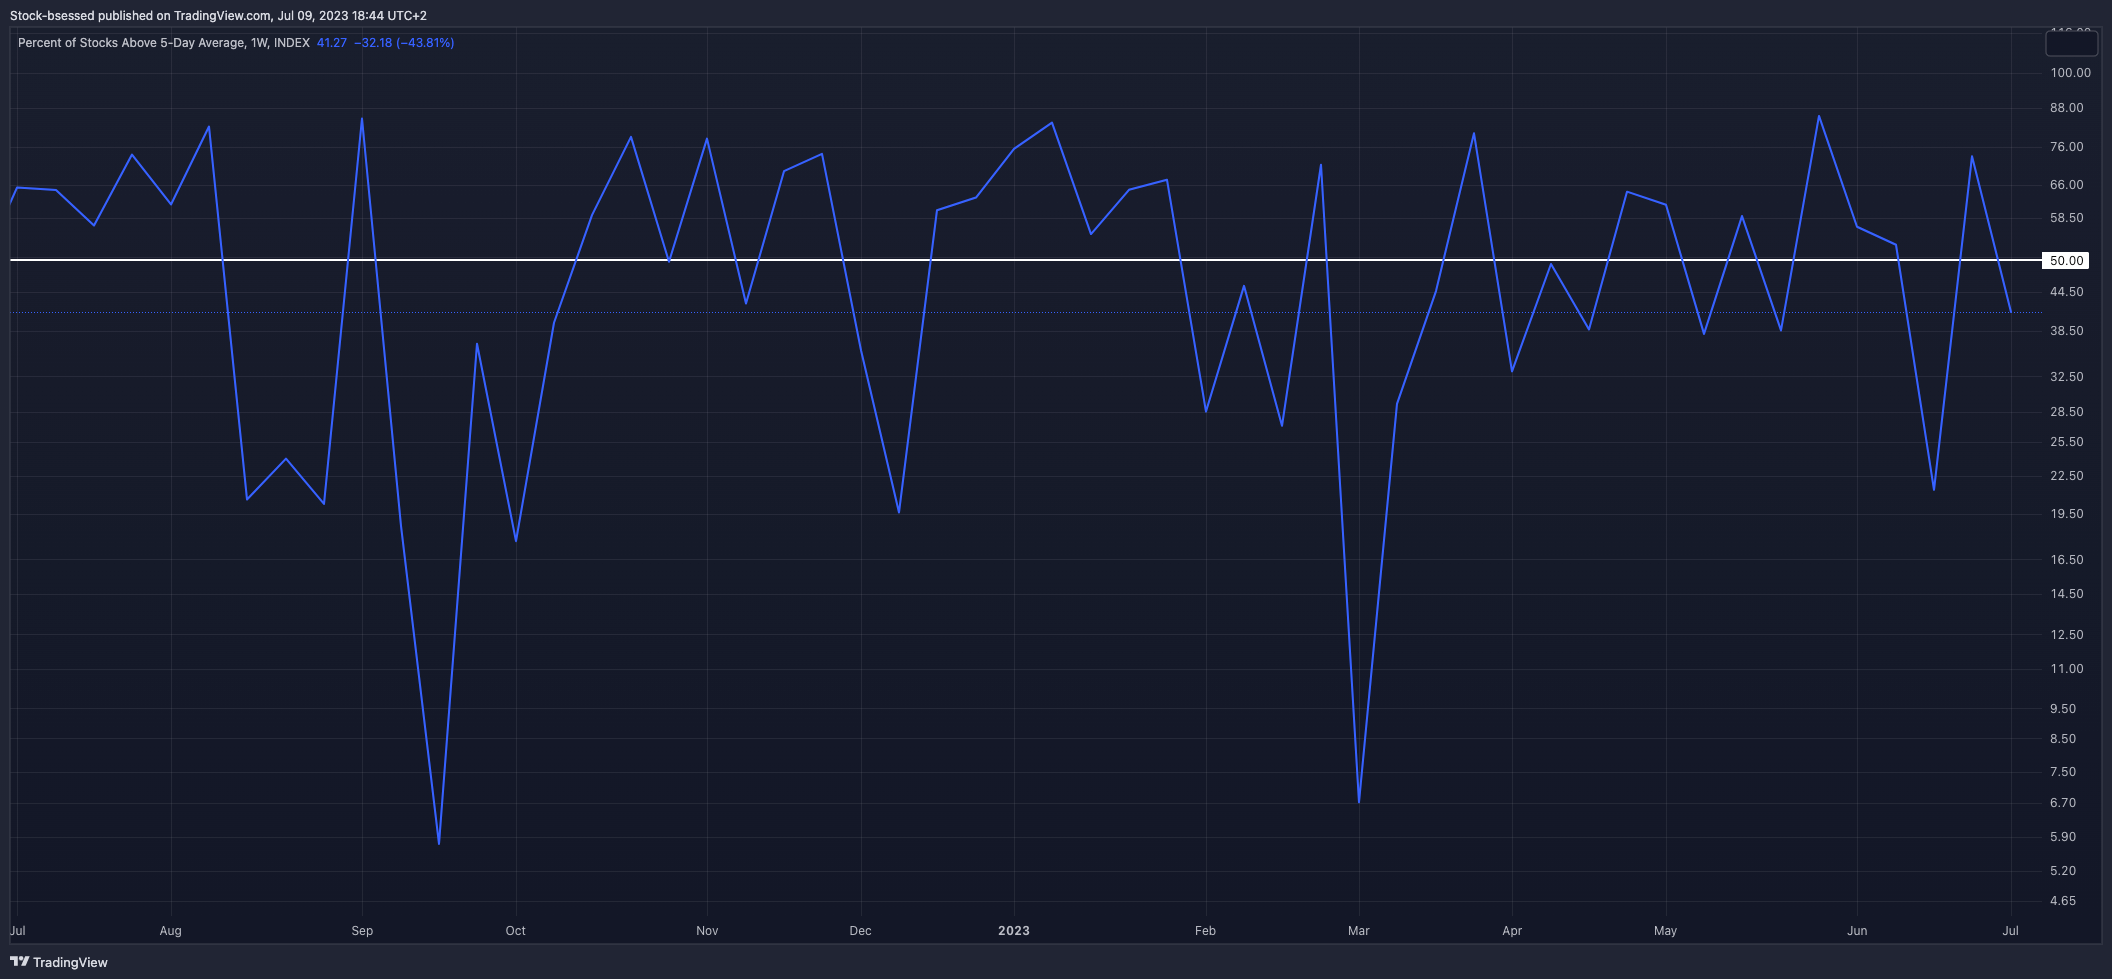
MMFD - Percent of Stocks Above 5-Day Average
Back below 50% after taking a hit this week:
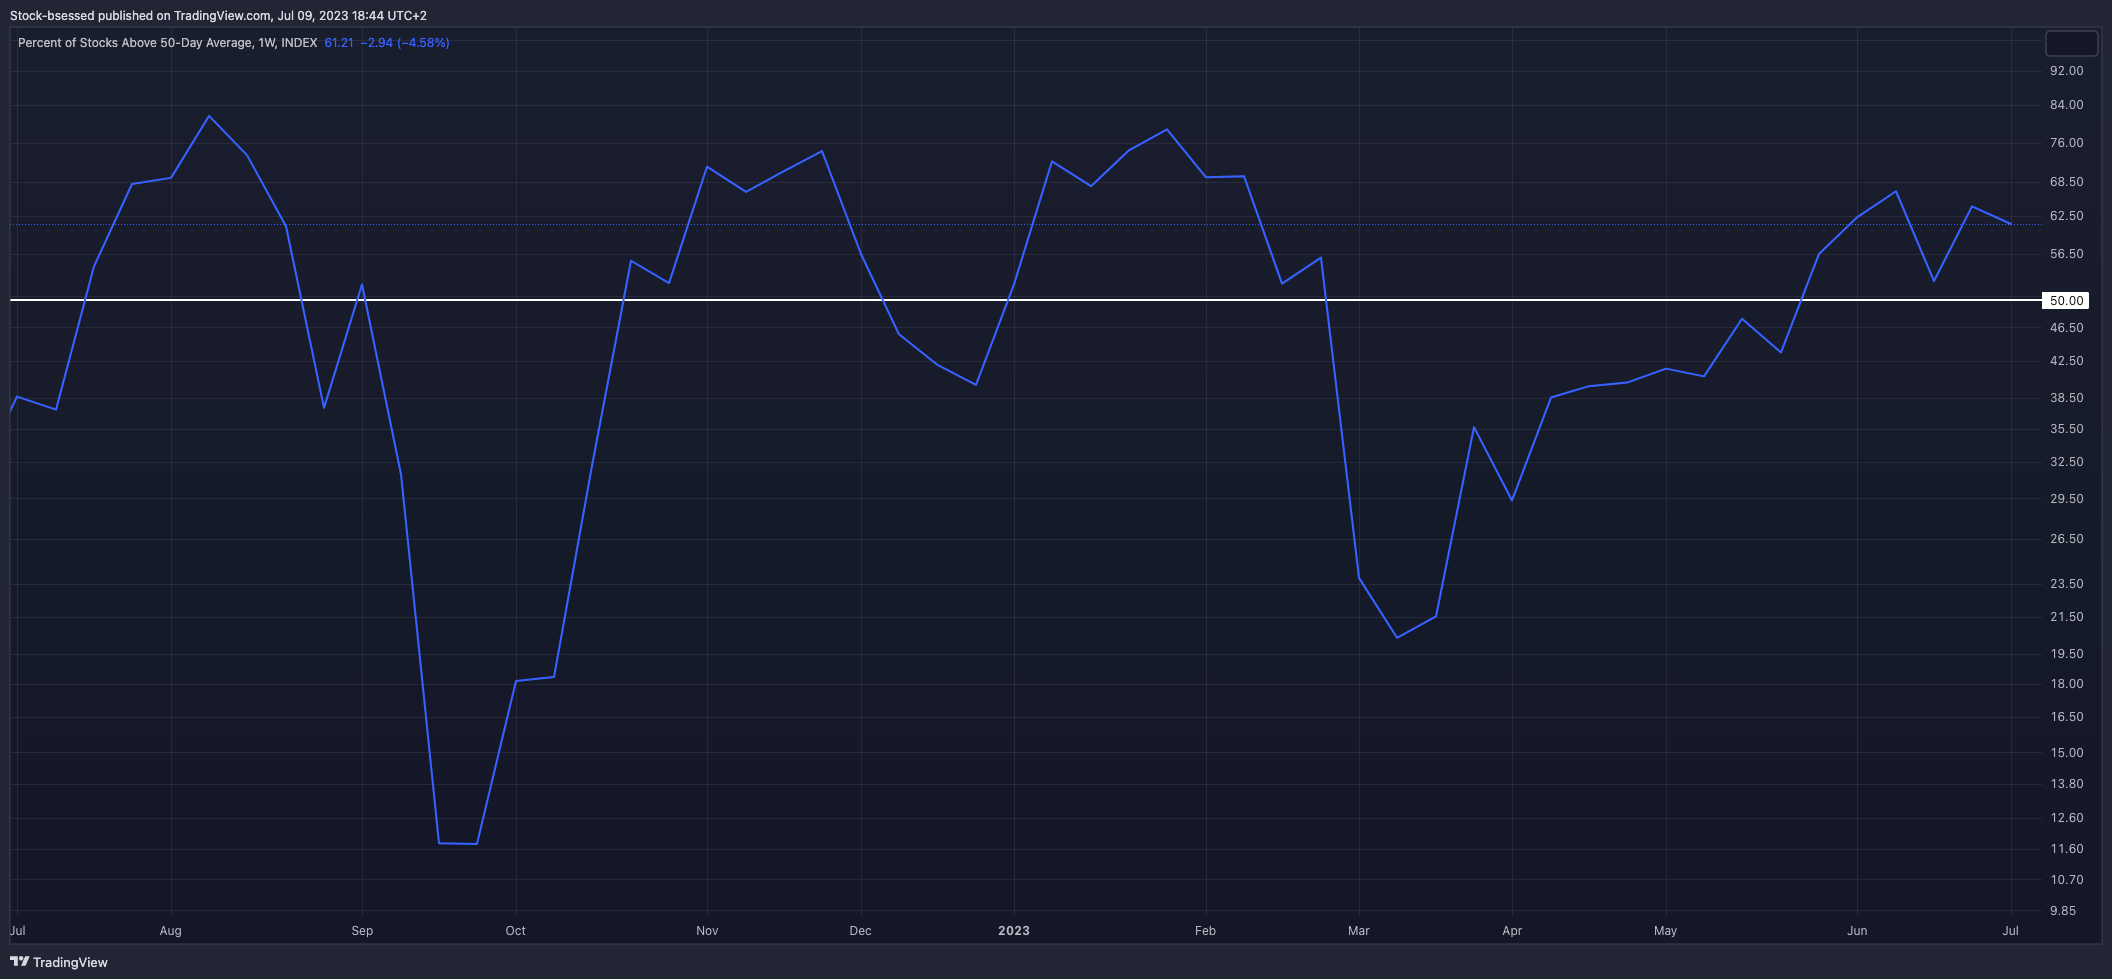
MMFI - Percent of Stocks Above 50-Day Average
Remains in a strong uptrend showing increasing participation within the market on an intermediate timeframe:
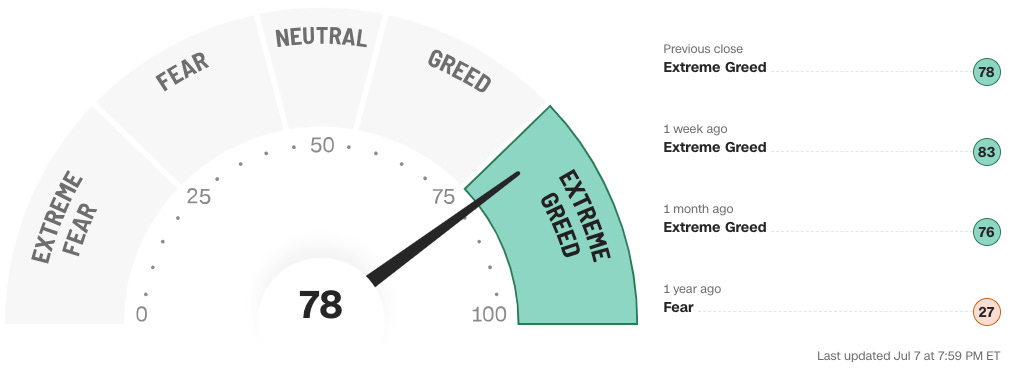
Fear & Greed Index
Sentiment getting a bit heated now with this recent move which may be providing further evidence that somewhat of a cool-down may be needed here:

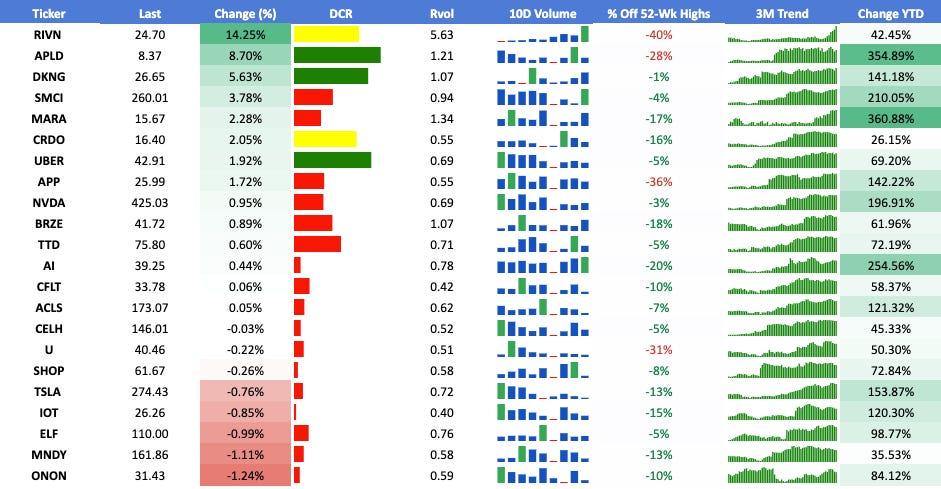
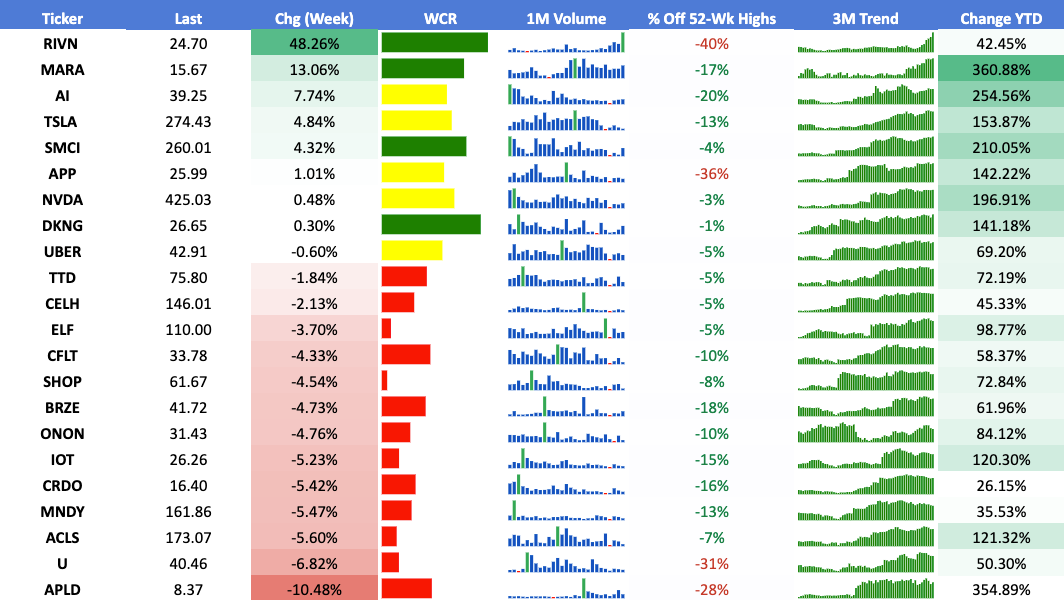
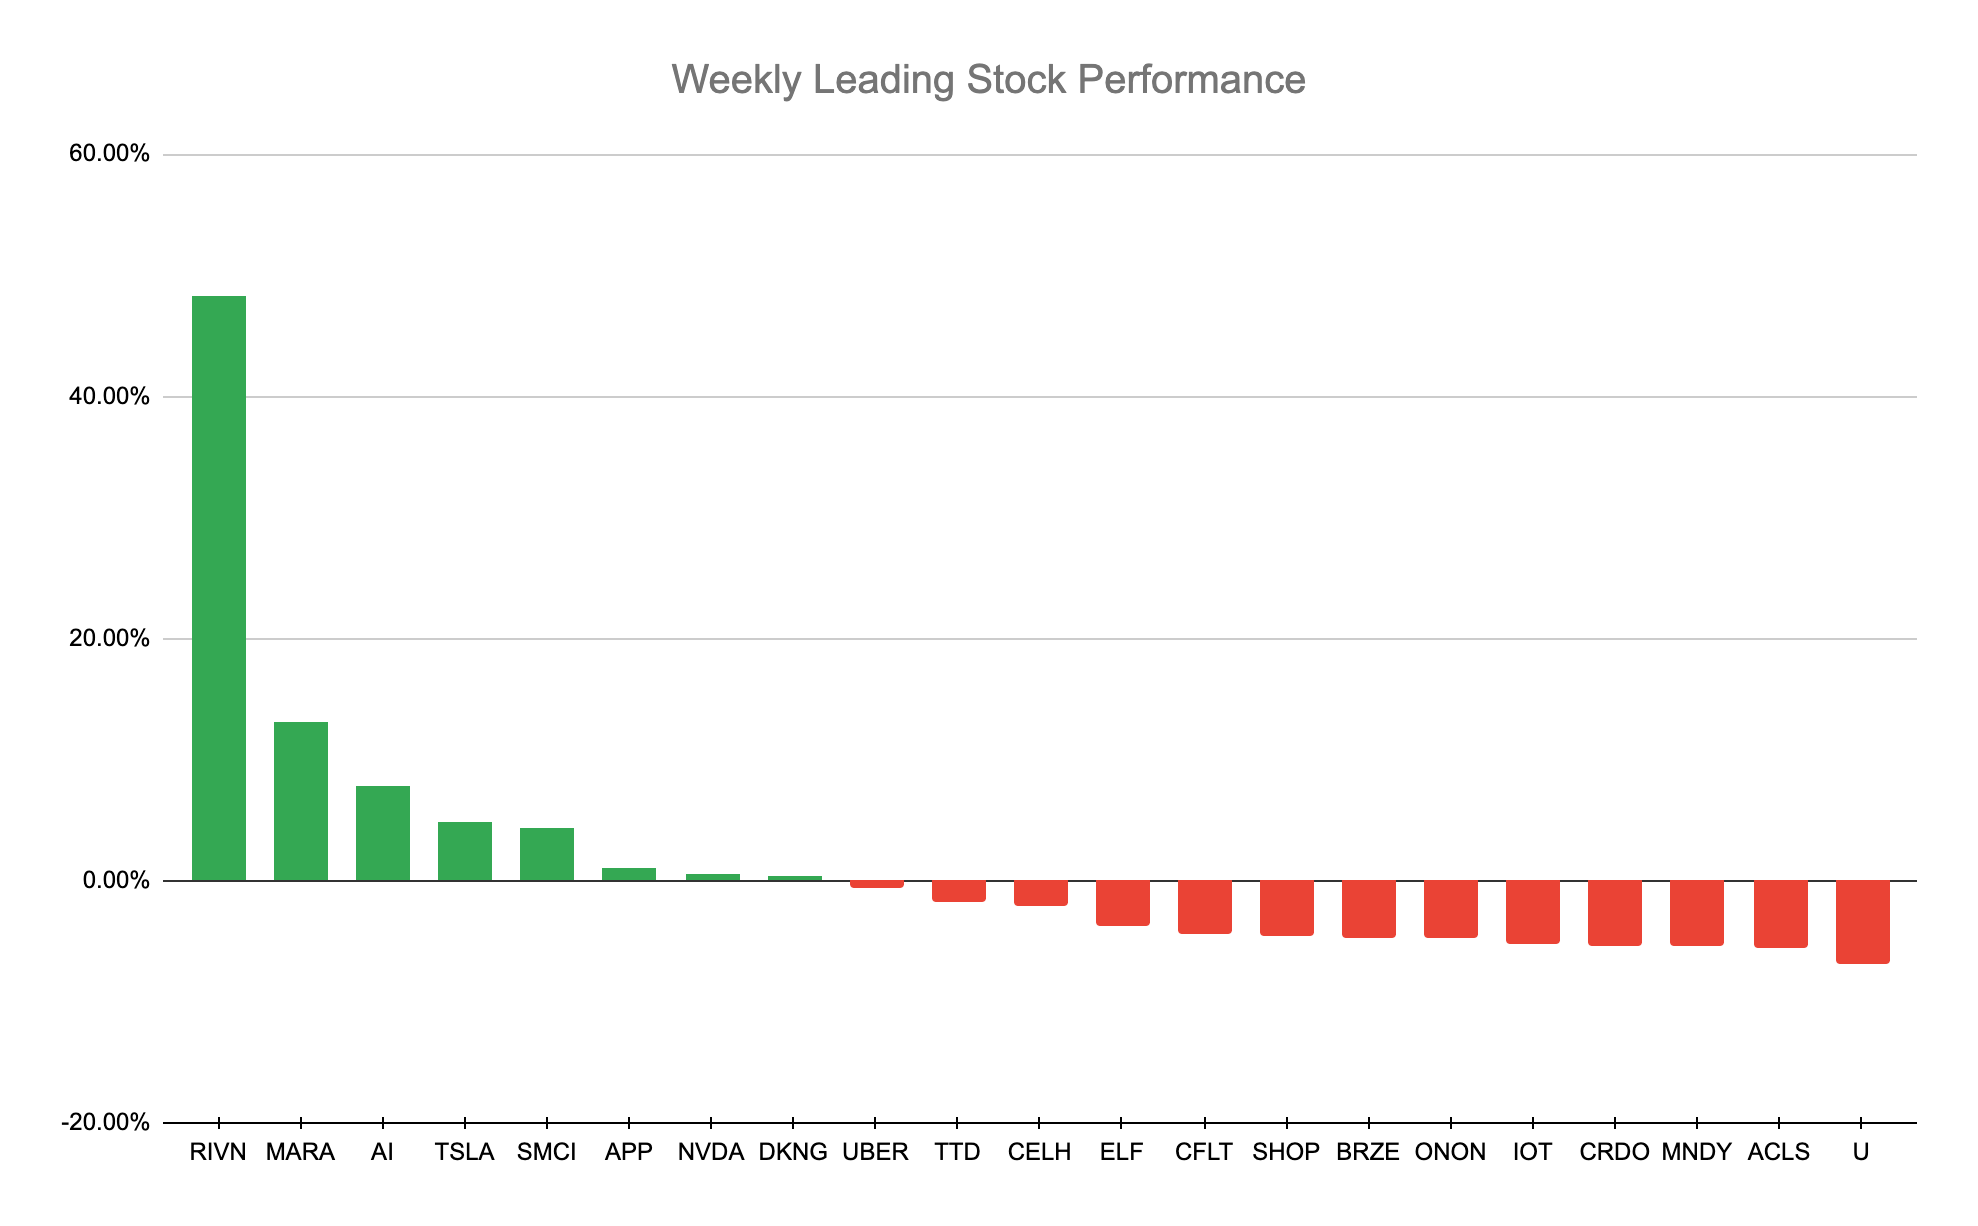
Leading Stocks Analysis
Replaced NNOX 0.00%↑ MELI 0.00%↑ and INTA 0.00%↑ which were all now below key moving averages and showing that sellers are in control with TSLA 0.00%↑ RIVN 0.00%↑ APLD 0.00%↑ as the EV theme starts to heat up once again:
Daily

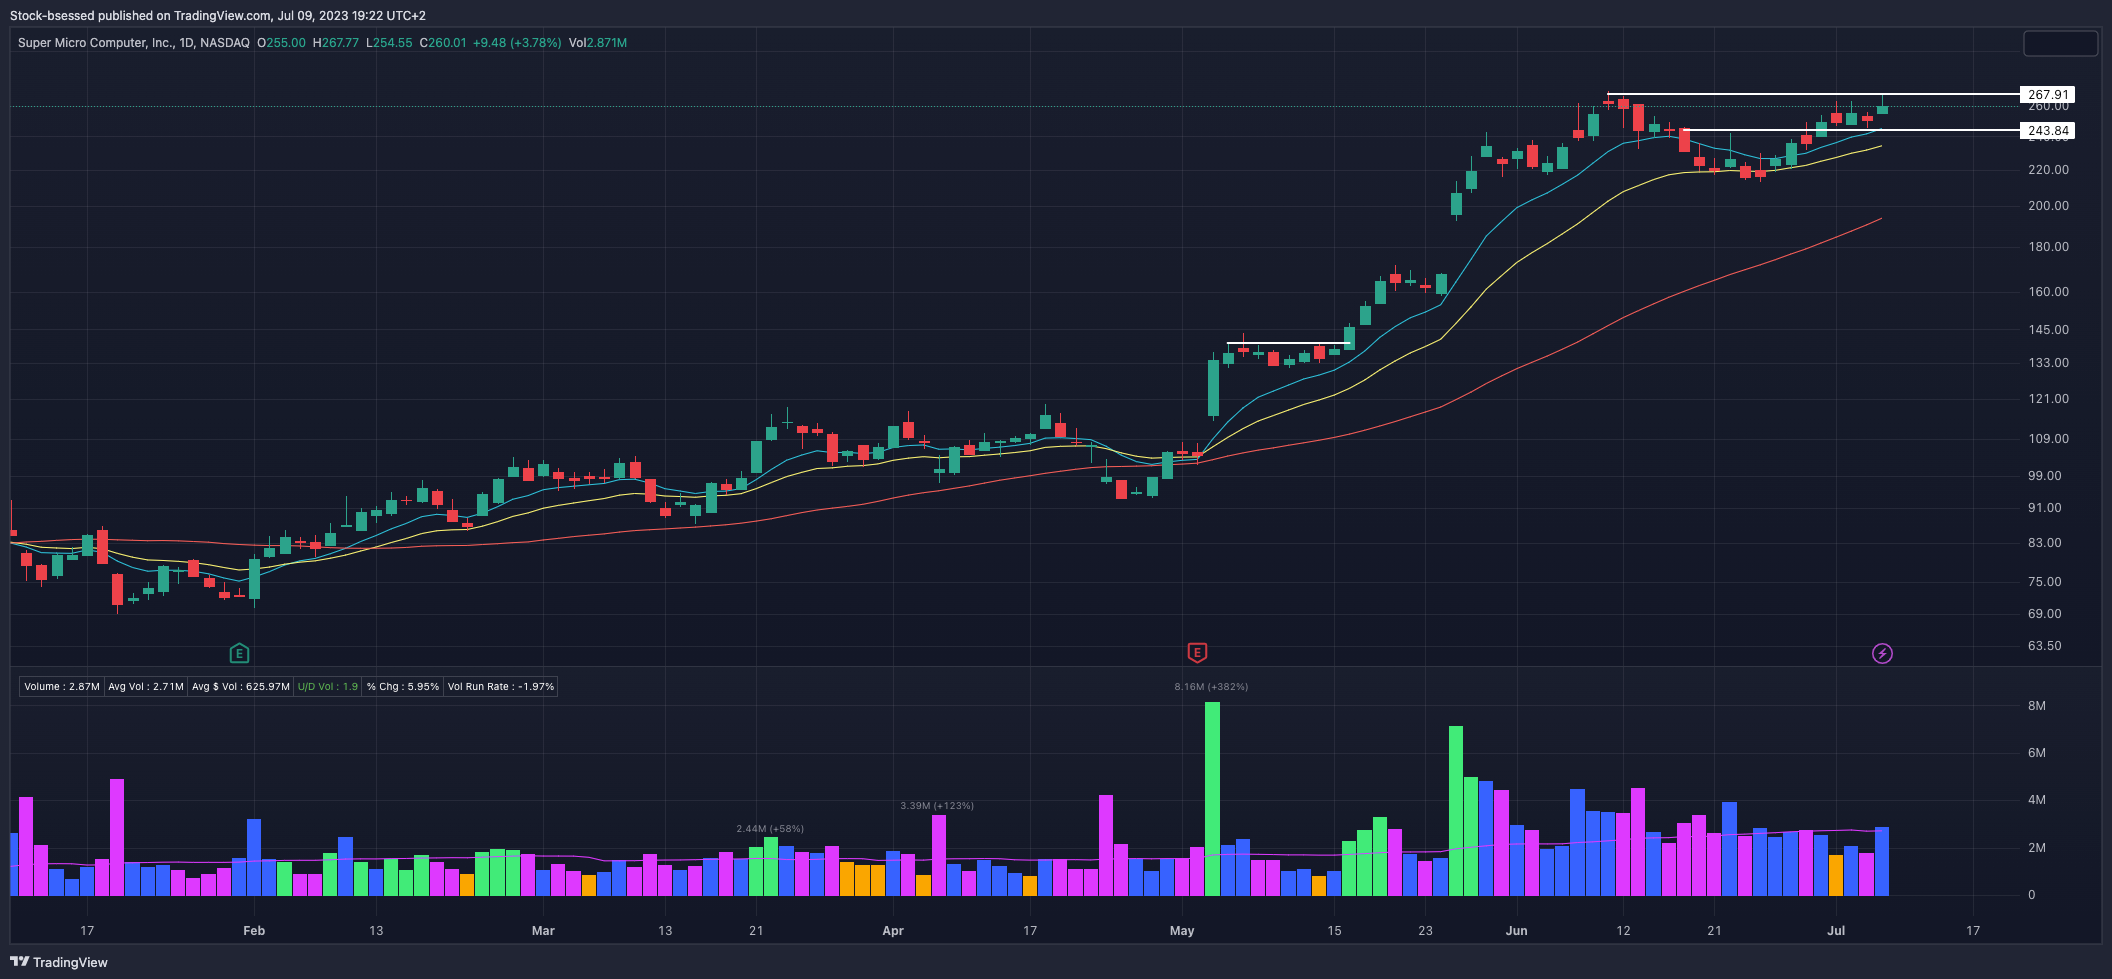
SMCI 0.00%↑ No denying the strength this has been showing lately with a +188% run-up since late April and is now attempting to tighten up within this 243-267 range. Ideally gets nice and tight here with an inside day that could offer an opportunity to get involved on a break of this resistance. Continues respecting key moving averages with buyers showing up at the 20EMA:
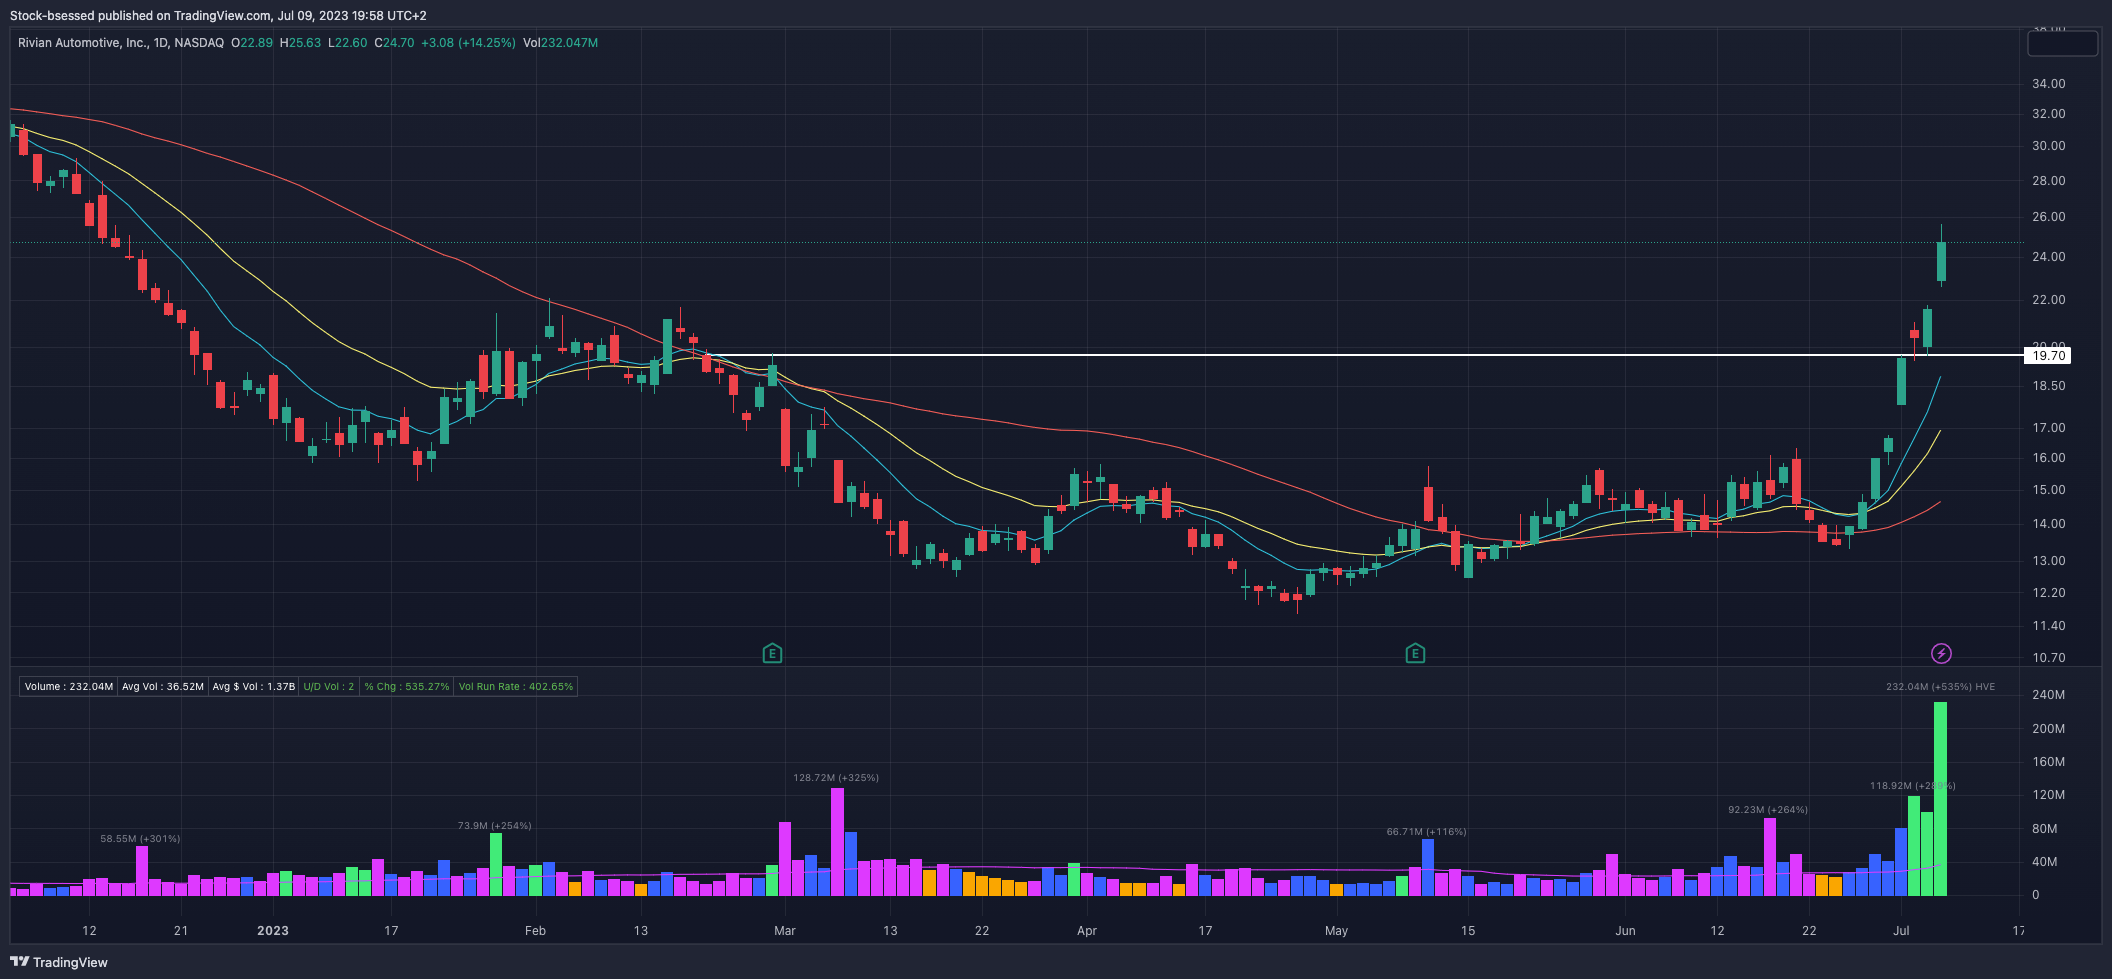
RIVN 0.00%↑ Massive buying very evident here with a monster pickup in volume this passed week to go with a +48% price change. Broke above a key area of resistance just under the 20 spot which it retested on Wednesday and Thursday to then push out once more to close the session +14% on its highest volume ever last session. Now watching for tightness and additional opportunities in this name:
UBER 0.00%↑Like how this acted last week as it pulled back in to the 20EMA where it quickly found buyers and closed strong on the session. Will be watching this closely throughout the week for a breakout above its descending trend line:

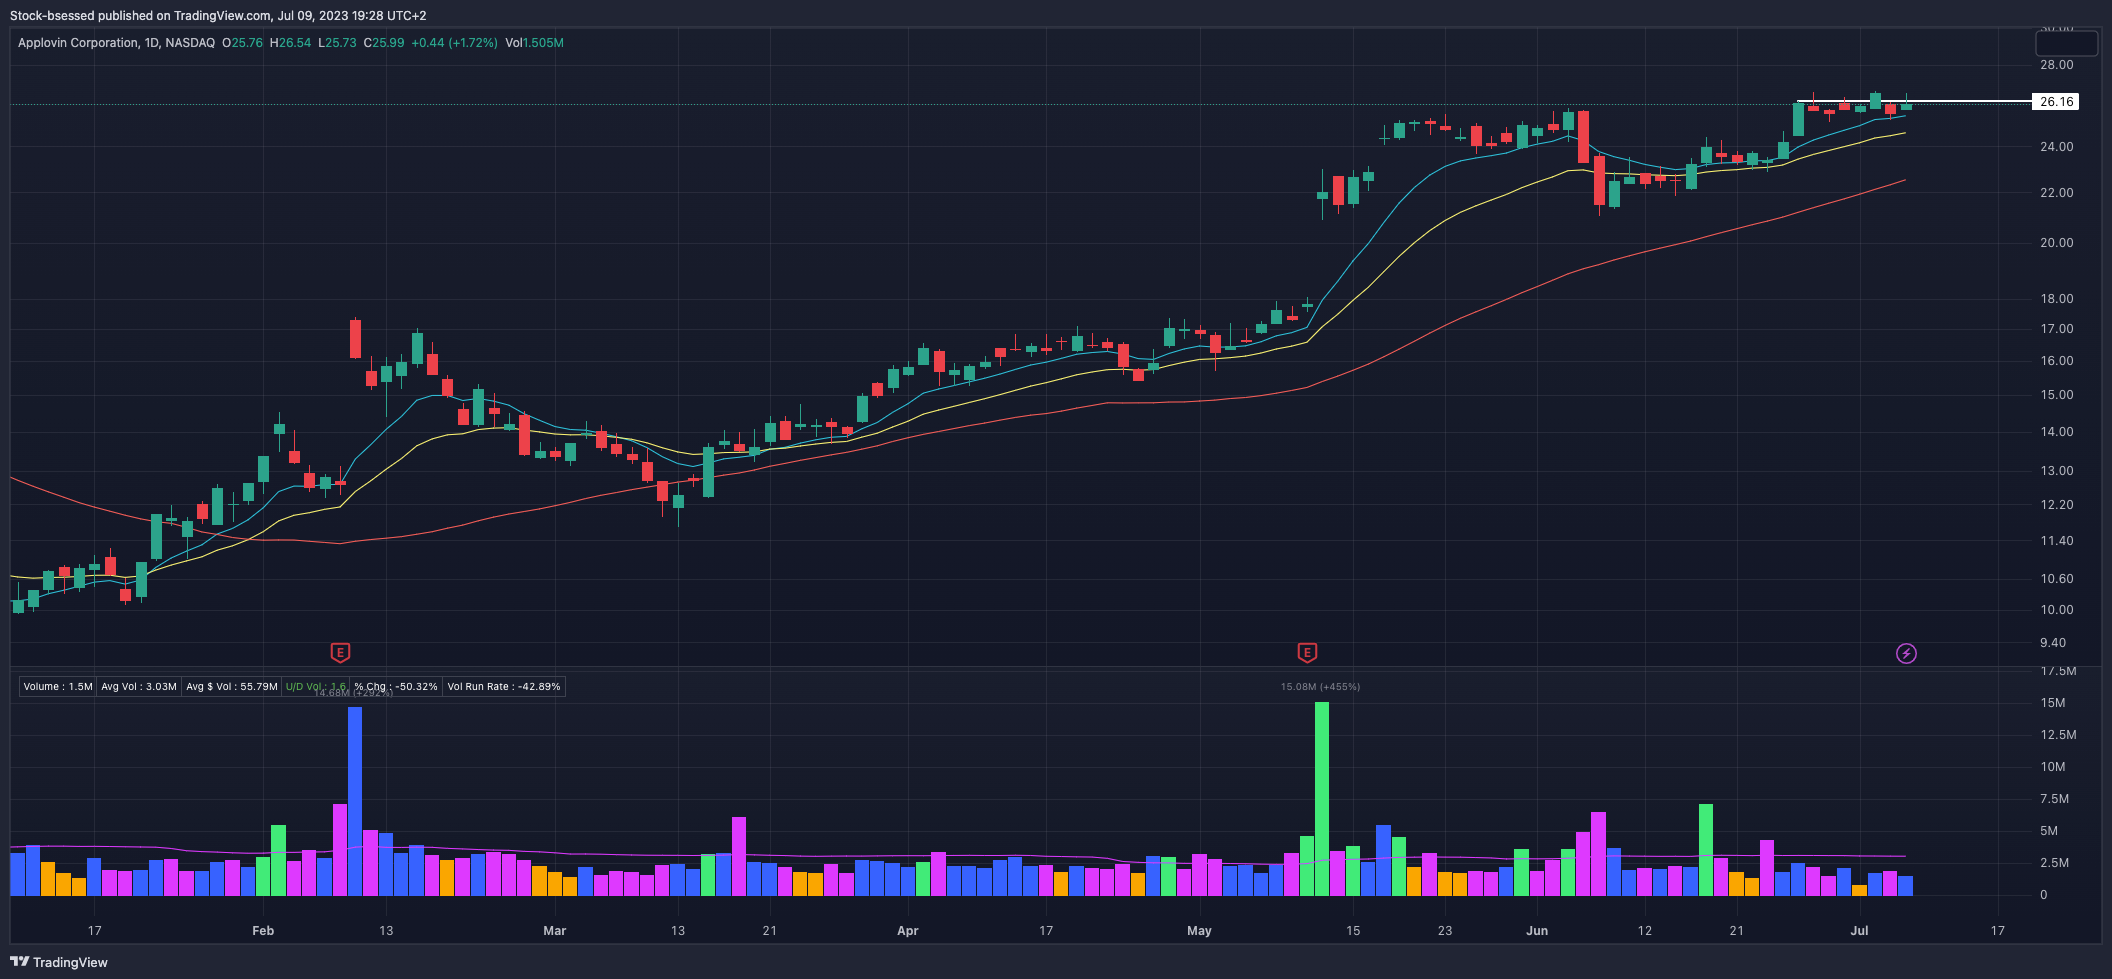
APP 0.00%↑ Another one that is worth keeping an eye on here as we can see how it is attempting to tighten up on the right side of its base while flagging out above the rising 10/20 EMAs. No shortage of momentum here as it currently sits up +142% year-to-date:
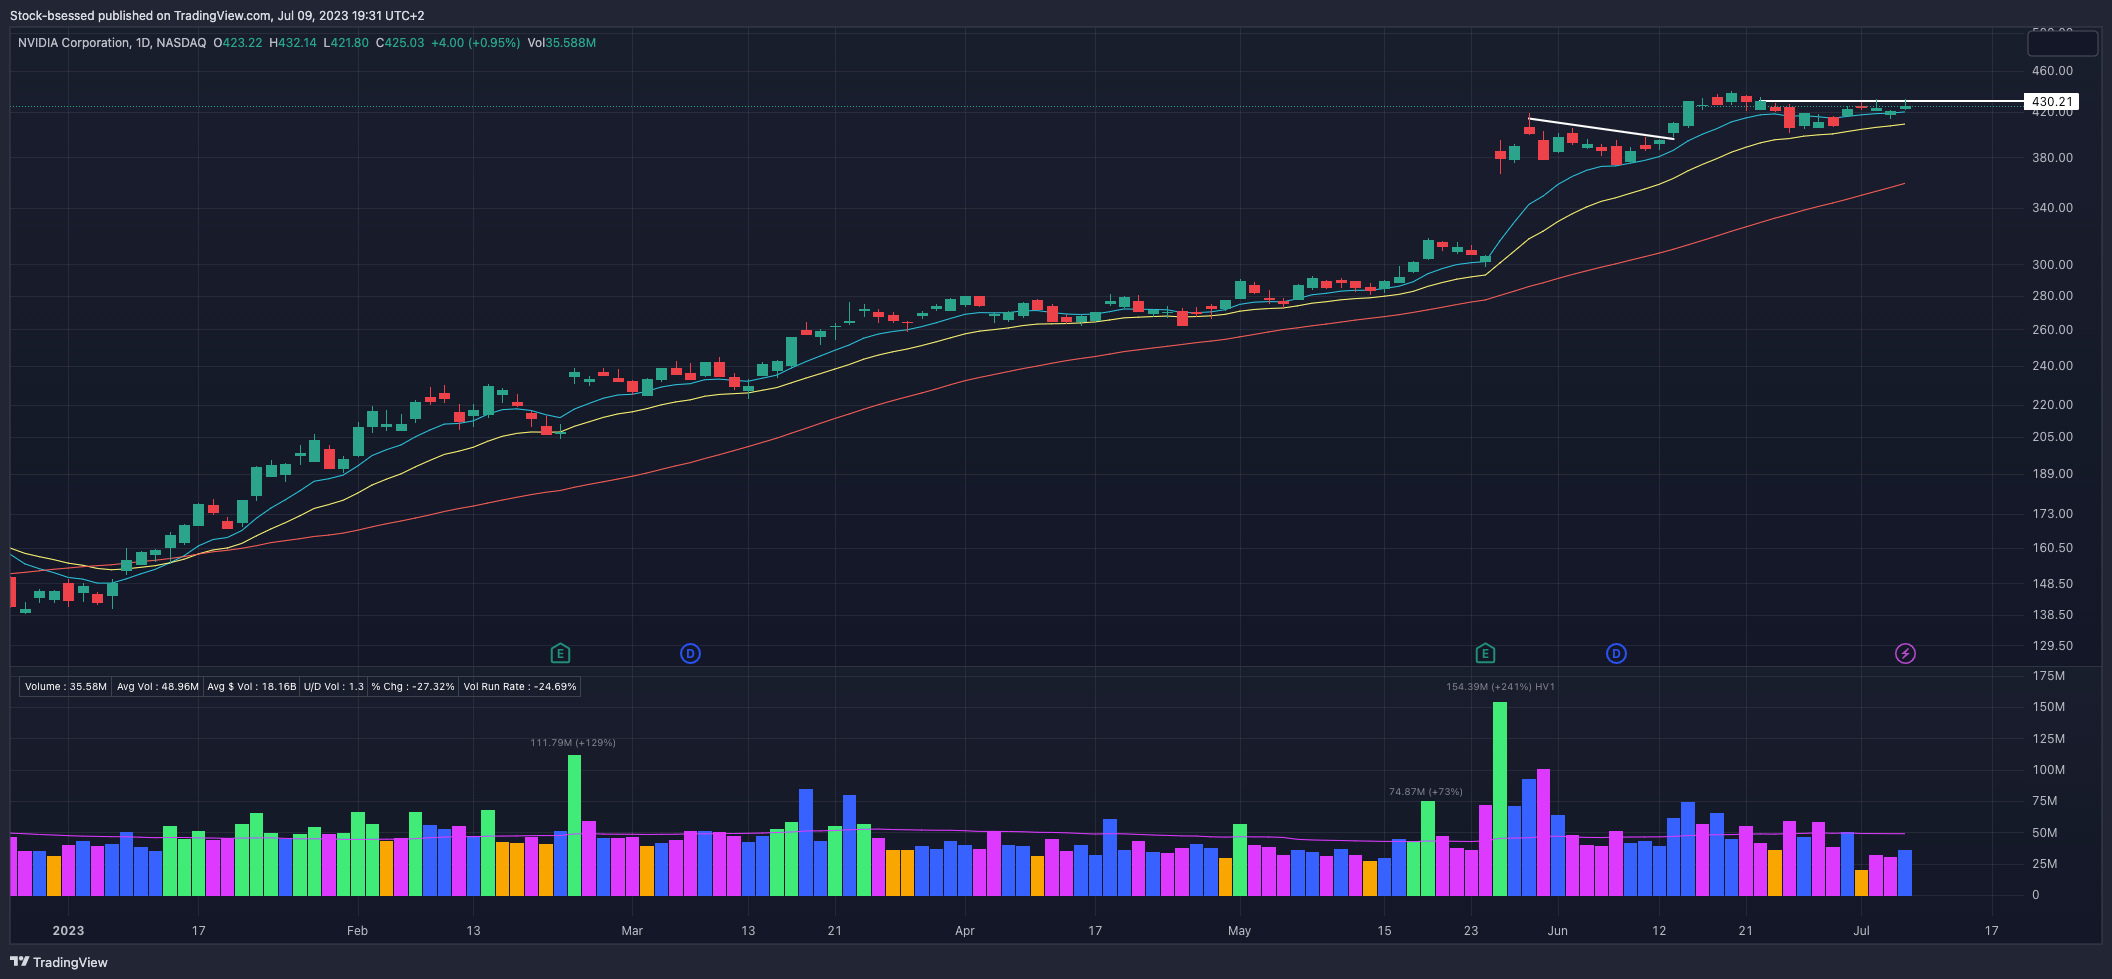
NVDA 0.00%↑ Clear momentum liquid leader which is now up +196% for the year with evident key levels as it attempts to tighten up below this 430 area. Wicks from Wednesday and Friday’s sessions show that sellers keep showing up whenever trying to push out above this area so if enough buying momentum shows up this could get ready to get going once more:
TTD 0.00%↑ Did gap down on Thursday but was able to reverse off the intraday lows to close right at the 20EMA which was reclaimed the following session to end the week closing above it once more. Watching action against its descending trend line right above:

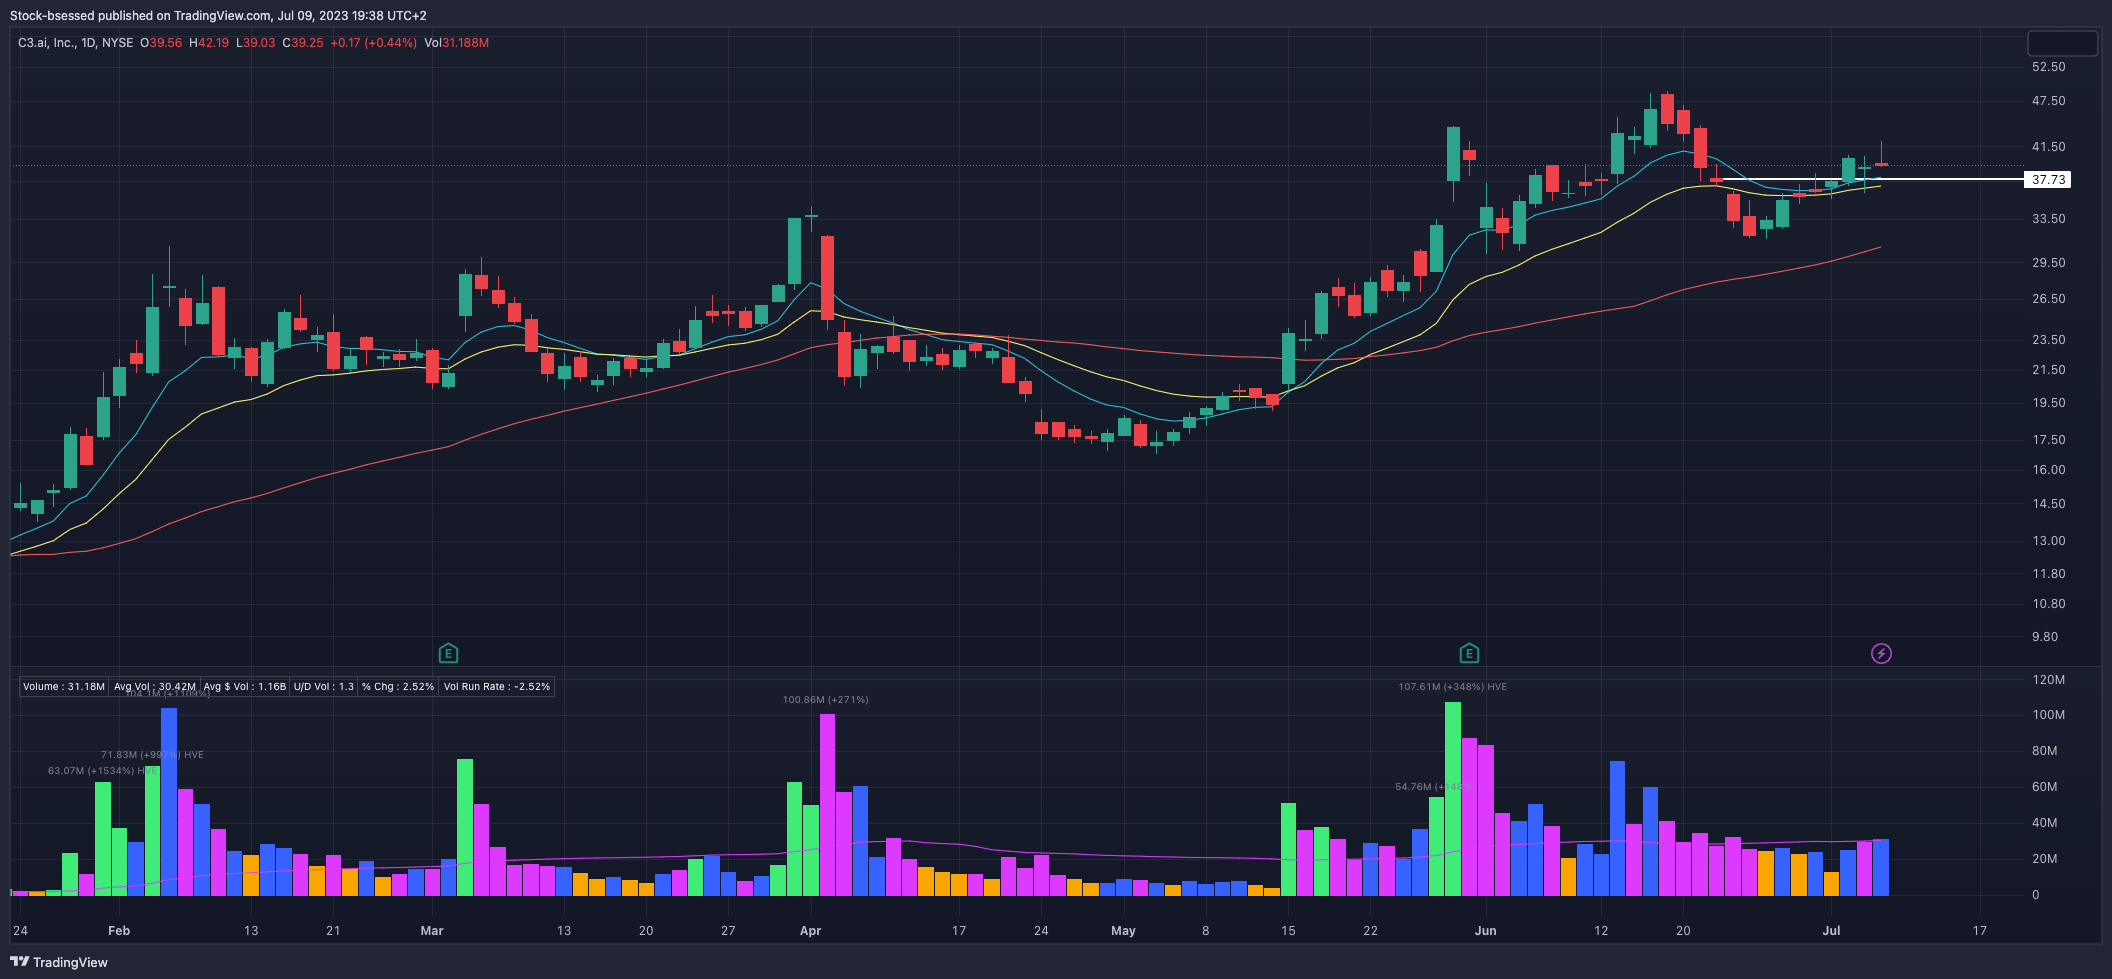
AI 0.00%↑ Some wild action this week with a strong move on Wednesday to clear the pivot point around 37.73 and close strong on the session, then undercut that session’s low on Thursday but was able to close the week well, above both the pivot as well as the rising 10/20EMAs:
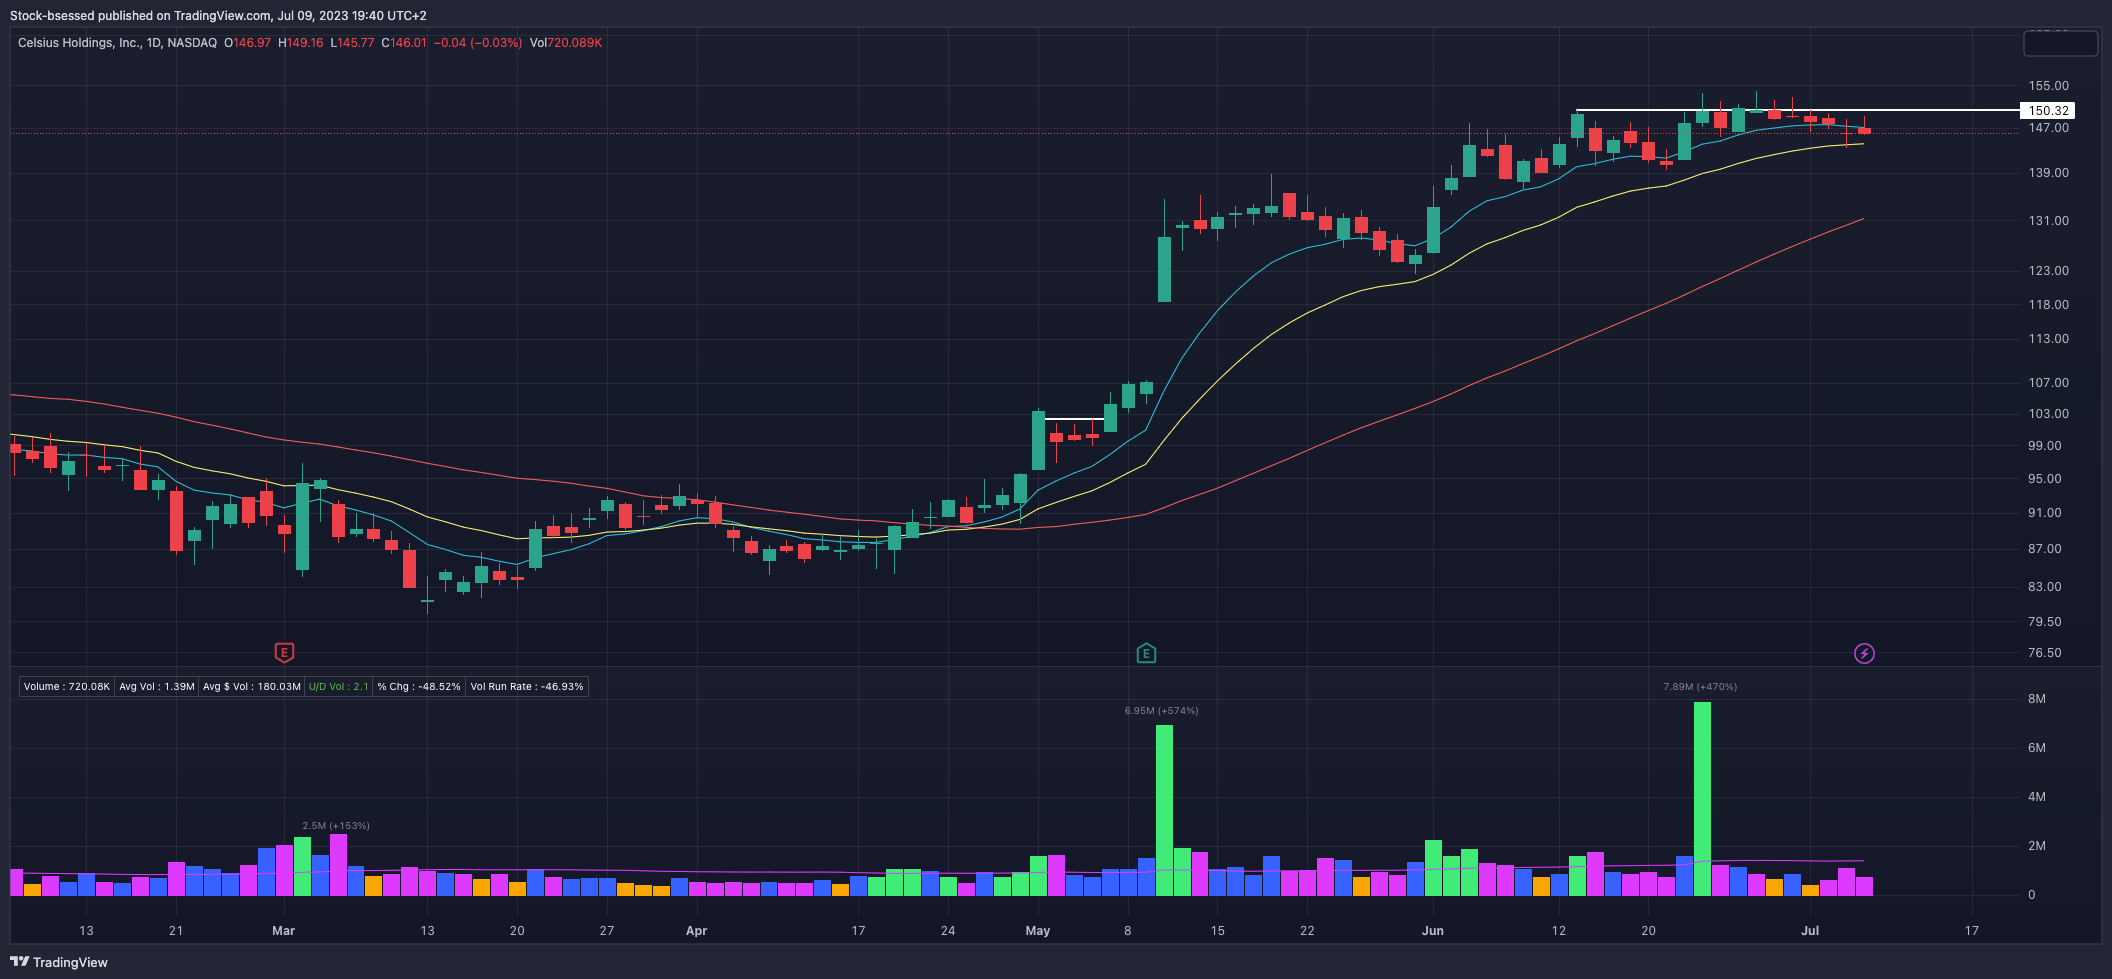
CELH 0.00%↑ Like how this came back in to find buyers at the 20EMA in a controlled manner. Clearly showing the importance of the 150 spot acting as resistance and will be watching closely for that area to be cleared if buyers show up with force:
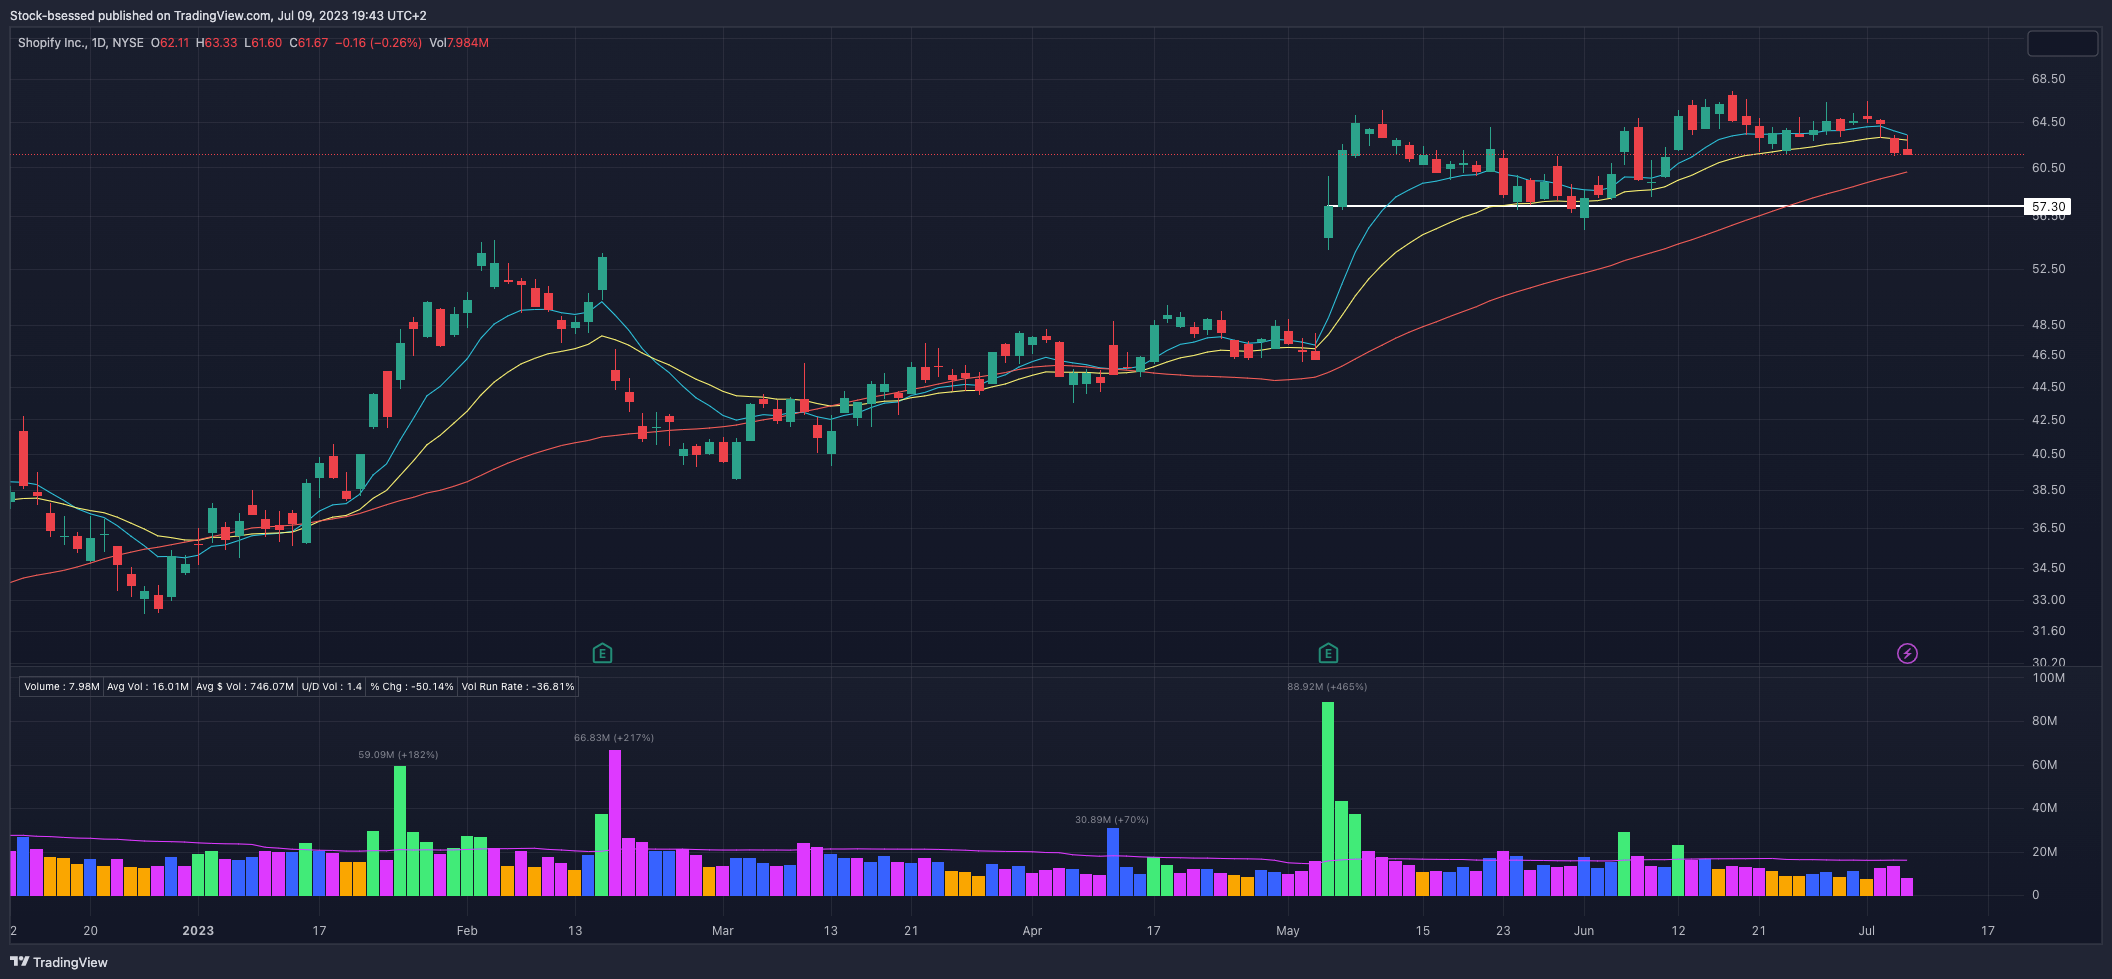
SHOP 0.00%↑ Rejected by the 10EMA on an intraday basis last session to close poorly right at the lows - seems to be heading back down the 50DMA and is yet to be determined whether buyers show up around that area:
Weekly
Keep reading with a 7-day free trial
Subscribe to Stockbsessed to keep reading this post and get 7 days of free access to the full post archives.