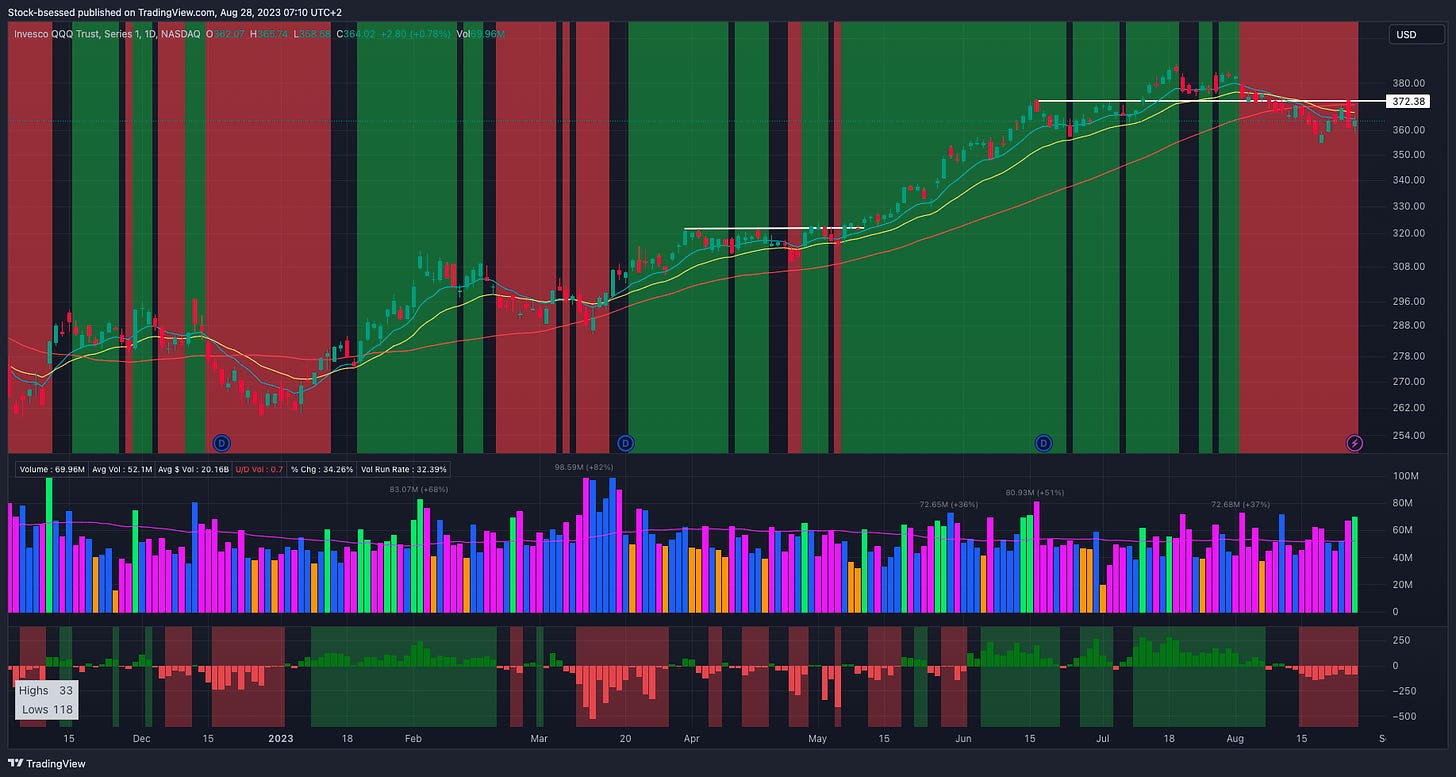
My main focus over the last couple of weeks has been exercising sit out power and remaining disciplined. For this reason, I have been working on a market timing model on tradingview so that I can further remove any element of subjectivity from my trading and aim to remain objective at all times.
My aim here is to avoid chop and go for the jugular when the deck is hot, this market health indicator specifically highlights the strong trending periods which can help prevent missing strong rallies - I have published it for free and you can find it here!
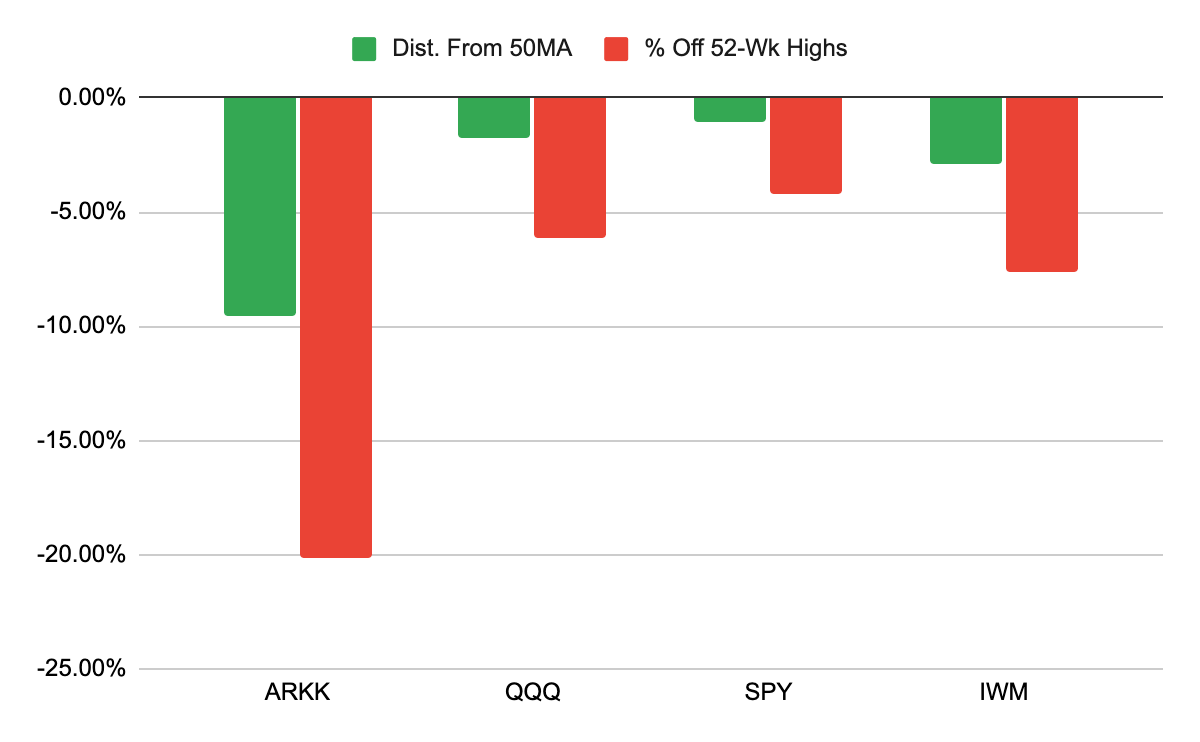
No need to force trades here - I patiently remain fully in cash as we wait for a healthier market environment. The market is clearly speaking to us as the QQQ 0.00%↑ is below the:
10EMA
20EMA
50SMA
The 10 and 20 EMAs are attempting to flatten out after around 3 weeks with a declining slope as new lows continue outpacing new highs!
Check out my website here for a FREE gift - stockbsessed.com
General Market Overview
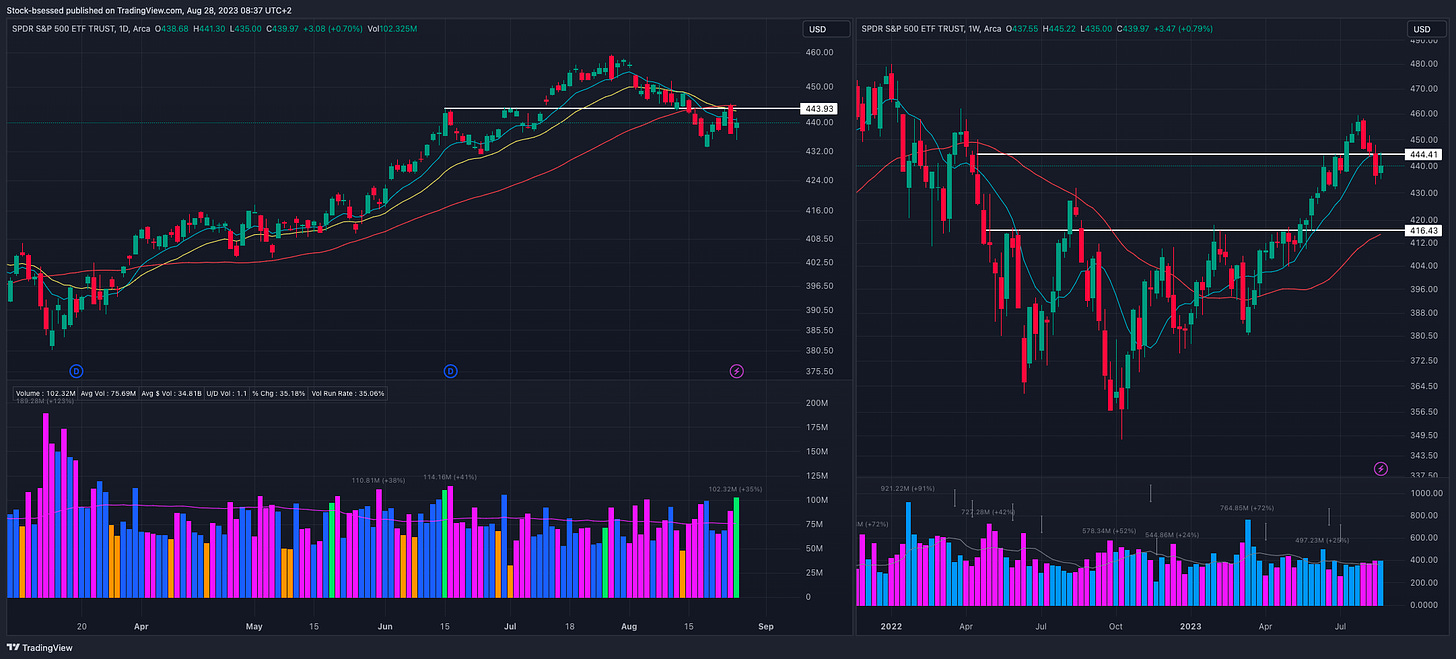
SPY 0.00%↑ Like how the weekly gives a clearer picture of the strength this has shown since its recent breakout above 417 back in mid-May. Ended up getting kept down by the underside of the 10-week last week and will be watching for a reclaim of that for a possible shakeout:
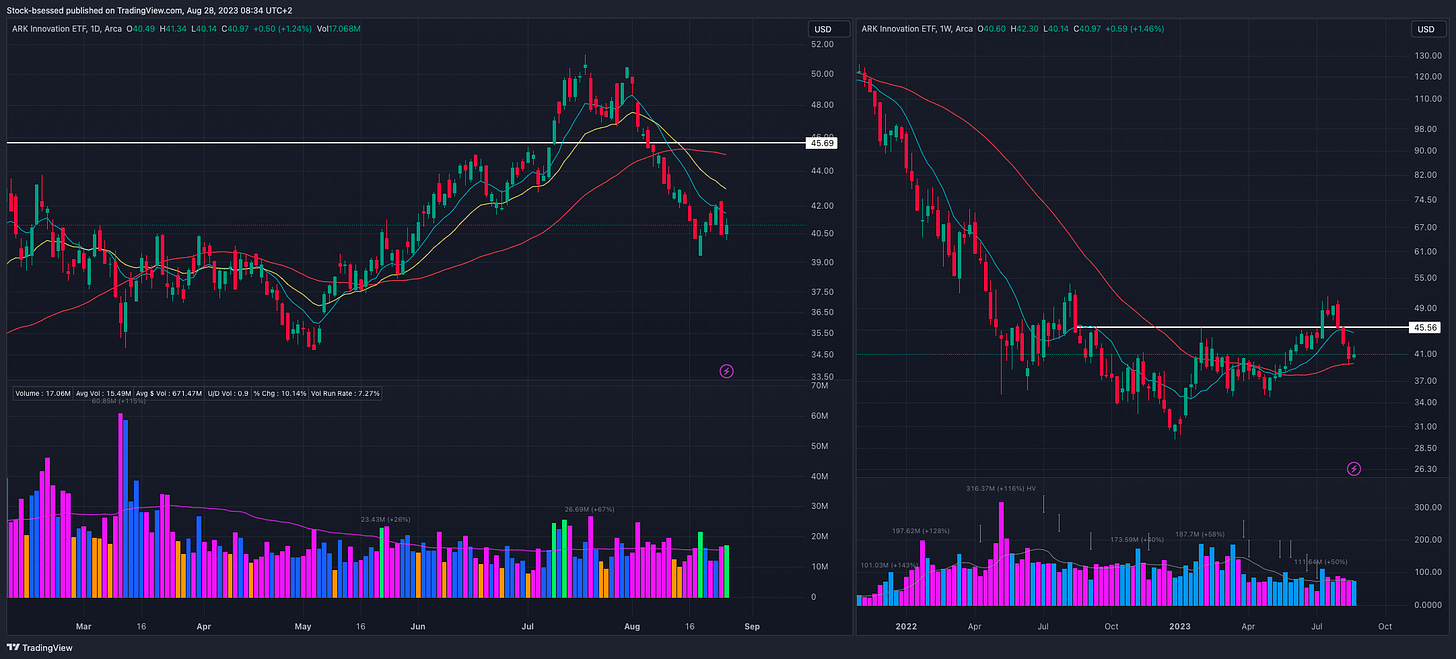
ARKK 0.00%↑ Key moving averages continue sloping downwards as we are now decisively below this key area around the 45 spot - weekly shows a recent pullback to the 40WMA where buyers showed up:
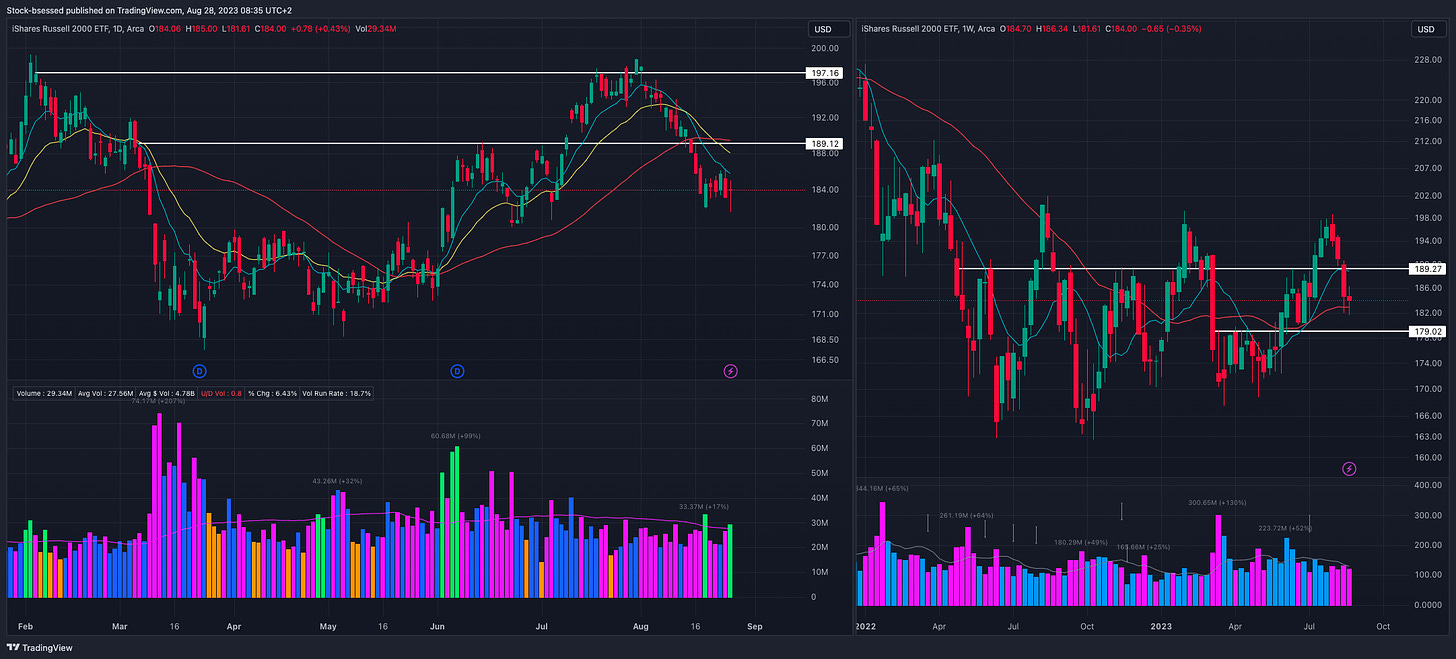
IWM 0.00%↑ Similar picture to ARKK in the sense that this is also below a couple of key areas - specifically around 189 and 197. Also pulled back to the 40-Week recently and may be attempting to push higher from here:
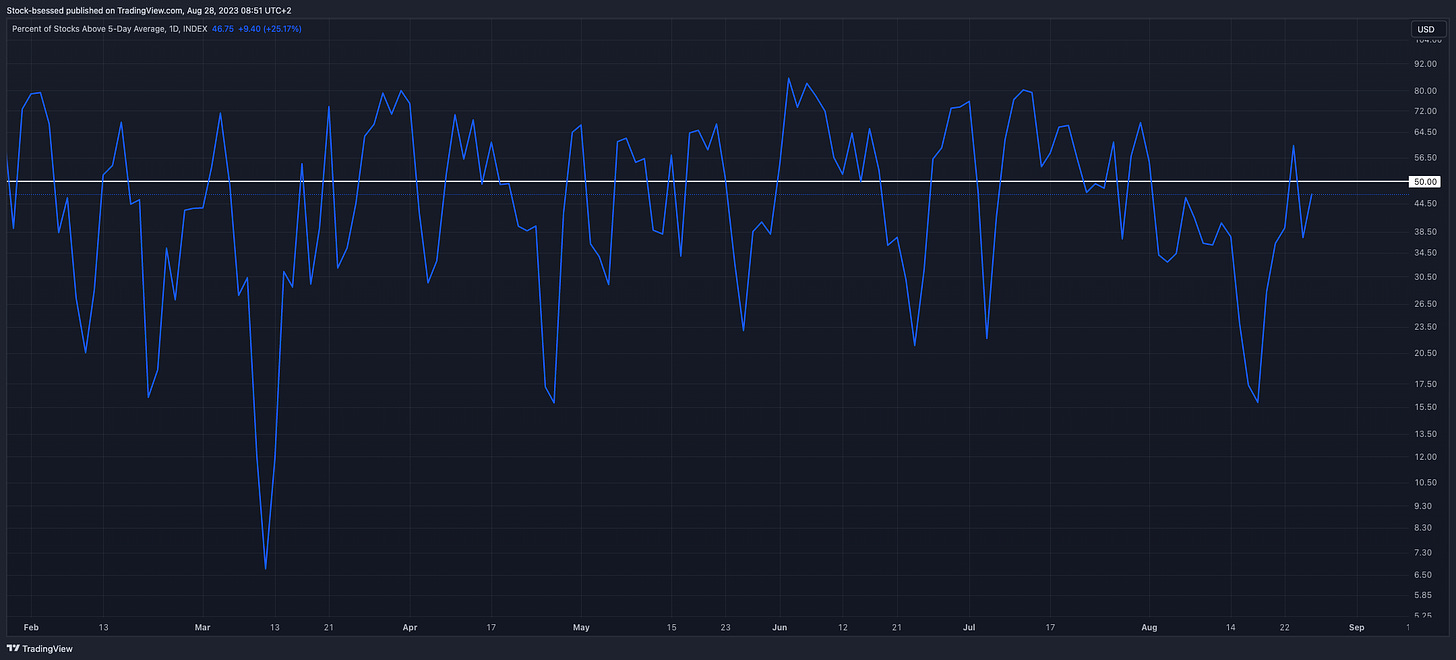
MMFD - Percent of Stocks Above 5-Day Average
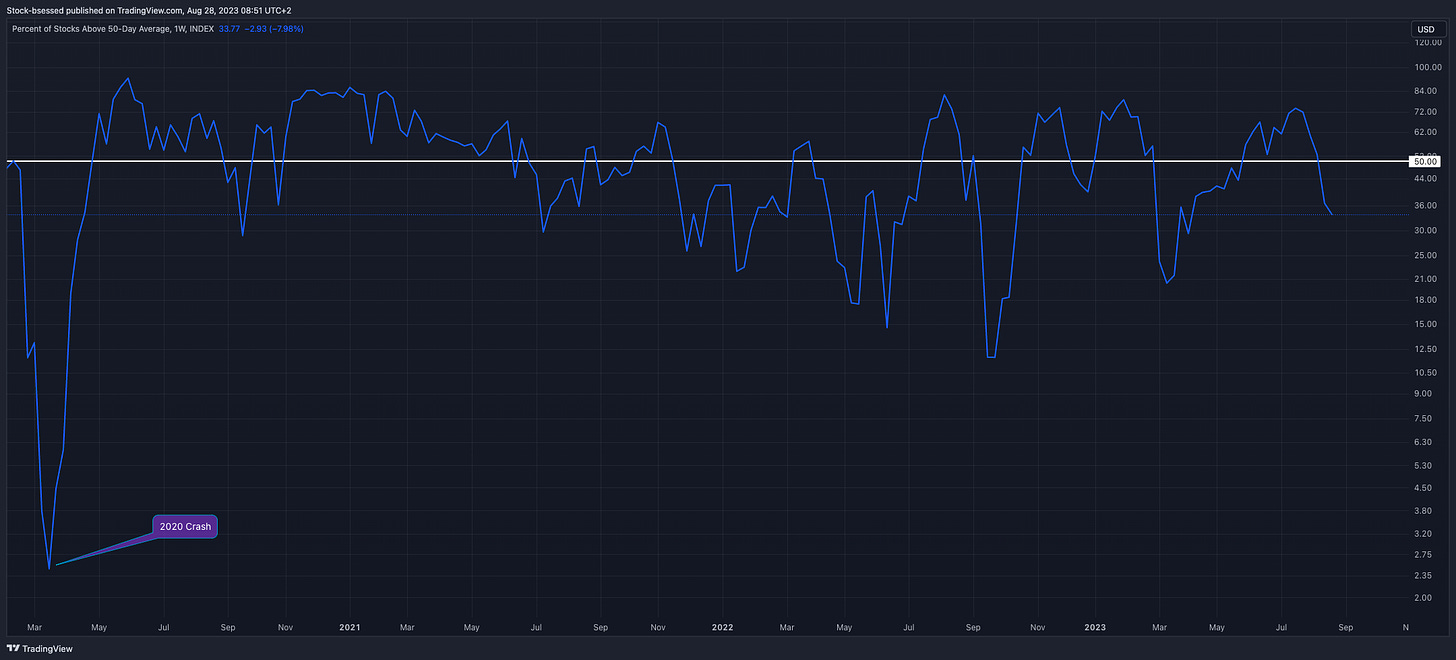
MMFI - Percent of Stocks Above 50-Day Average
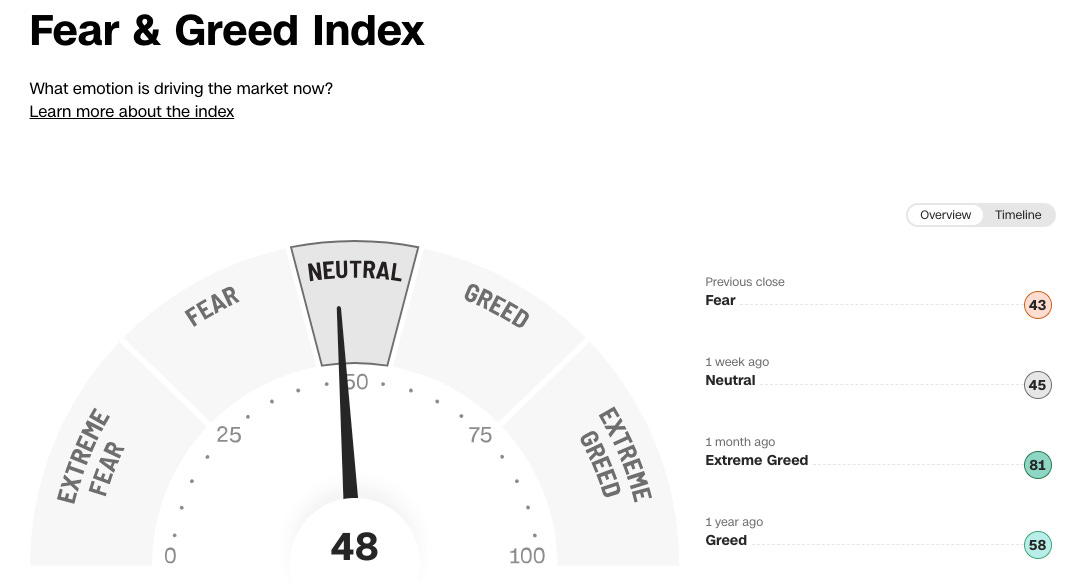
Fear & Greed Index
Good to see this cool down a bit:
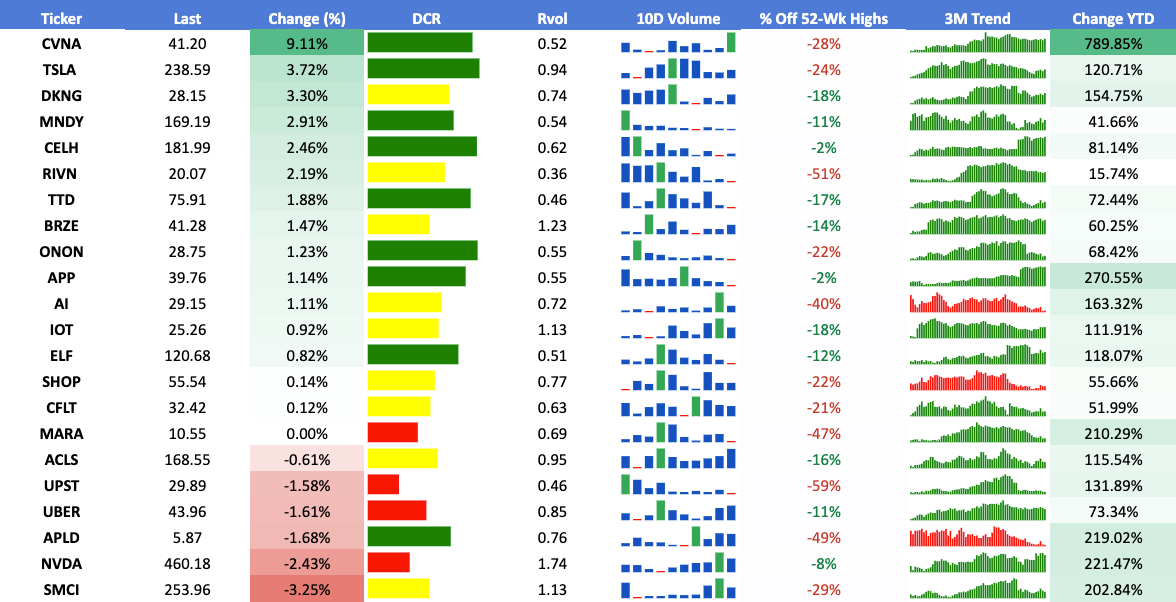
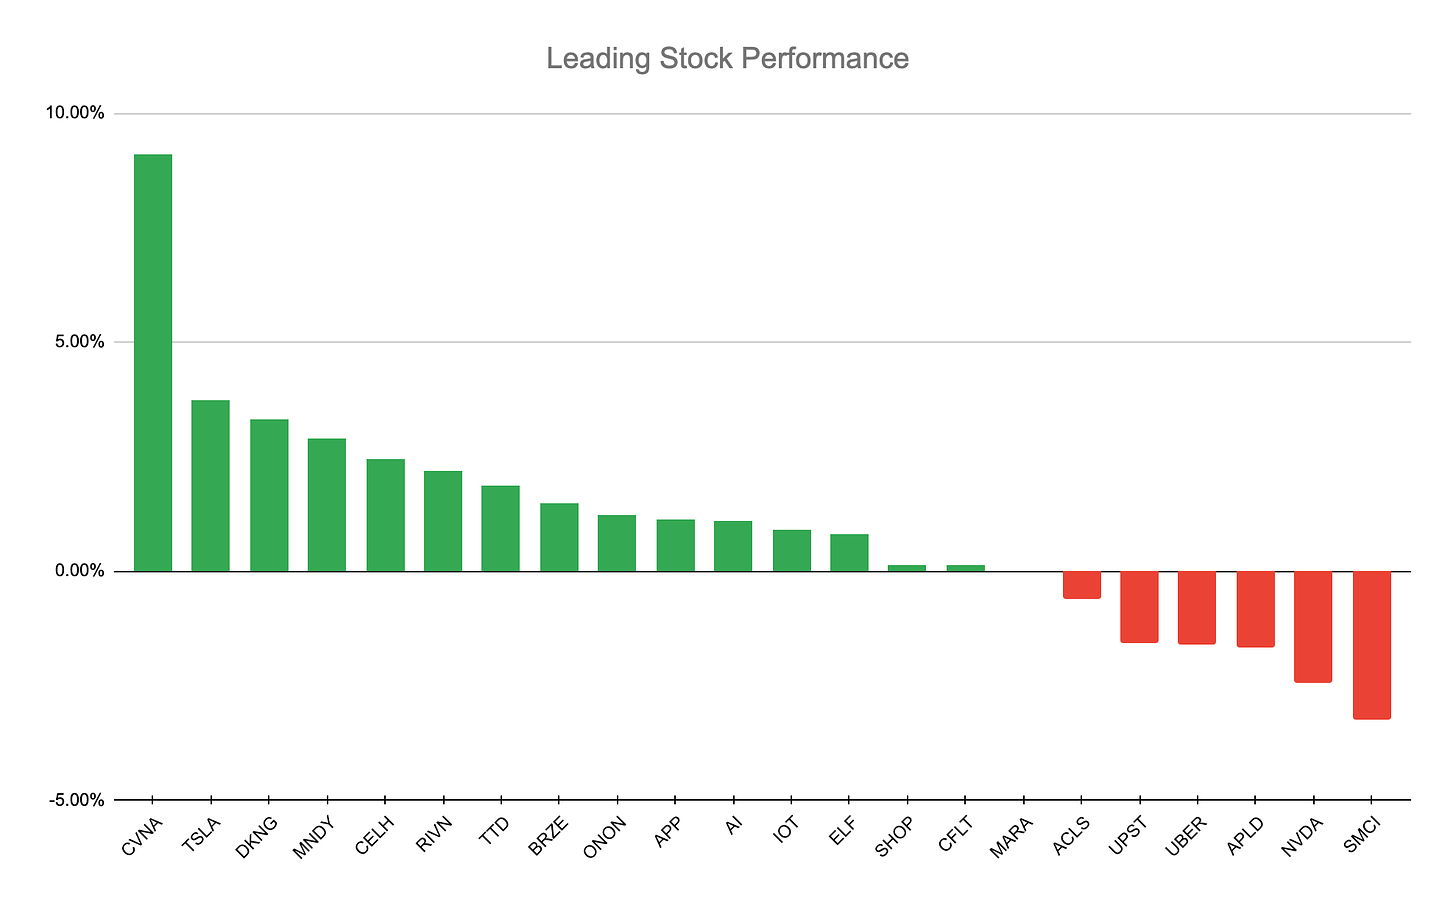
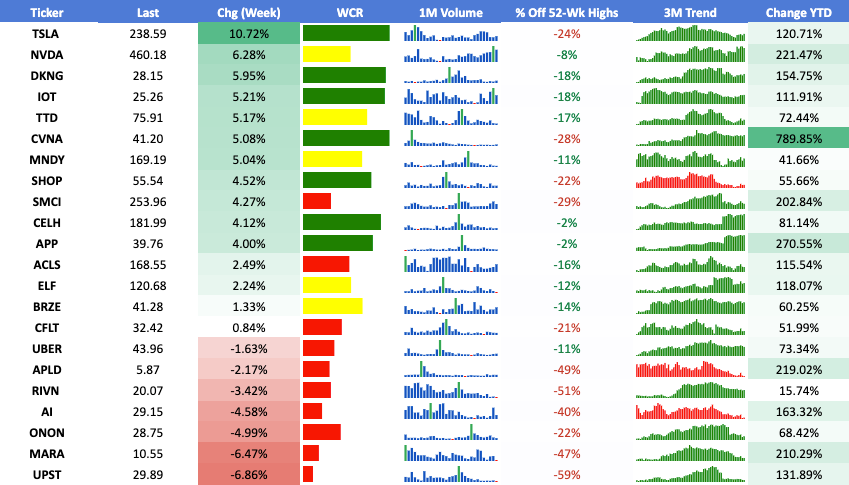
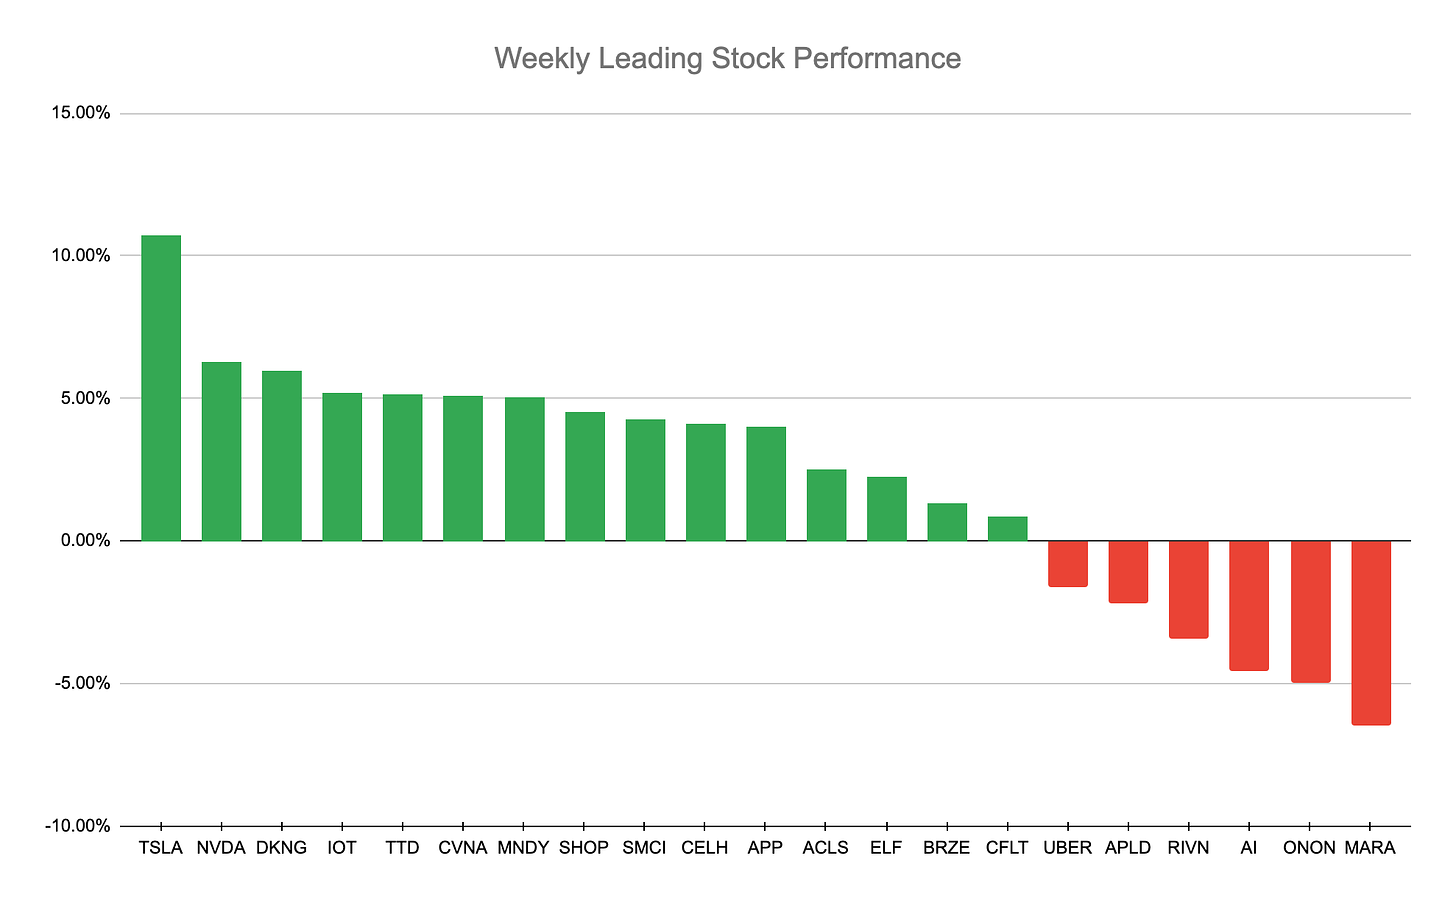
Leading Stocks Analysis
I am linking the leaders watchlist in tradingview for your convenience, here
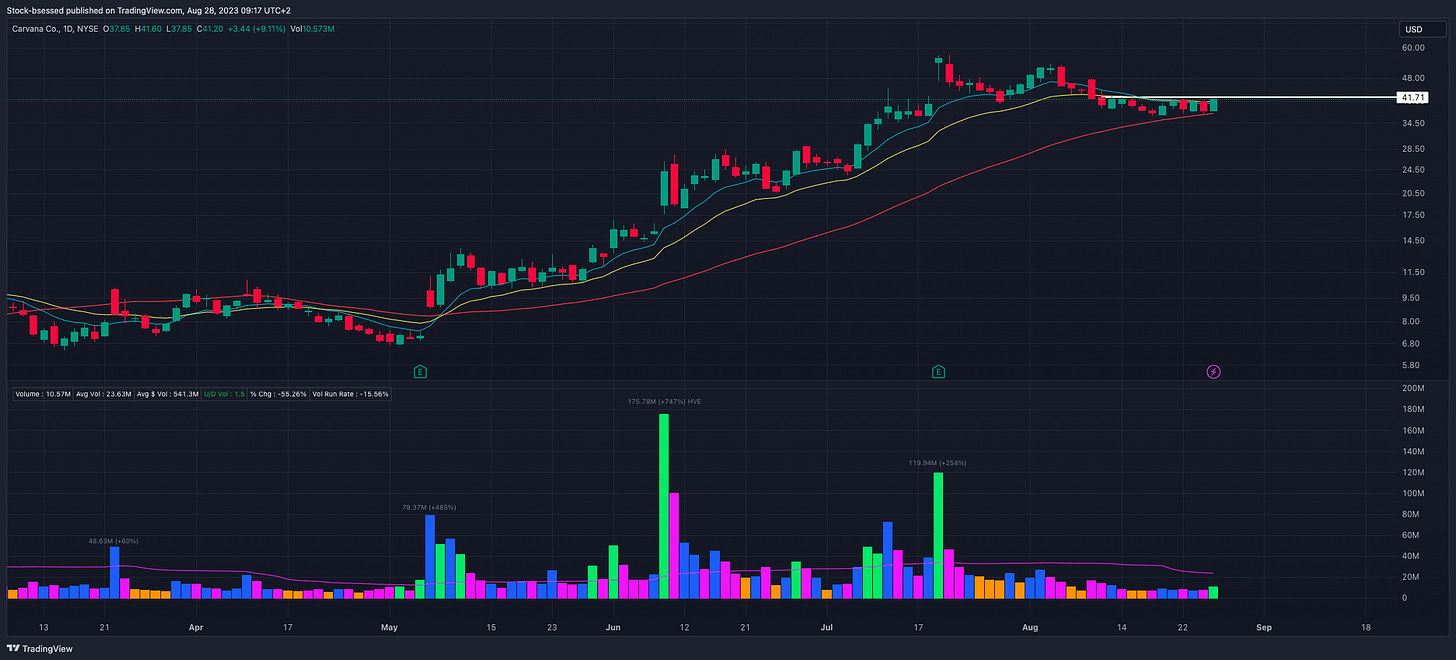
CVNA 0.00%↑ In my opinion it is worth keeping an eye on this one - even if not interested in trading in this environment / this specific stock, think it acts as a good proxy for overall speculative money and would benefit the general growth trade. Like how this has been tightening up right above the 50-day and was able to close back above the 10 and 20EMA last session - watching for a push above 41.70:
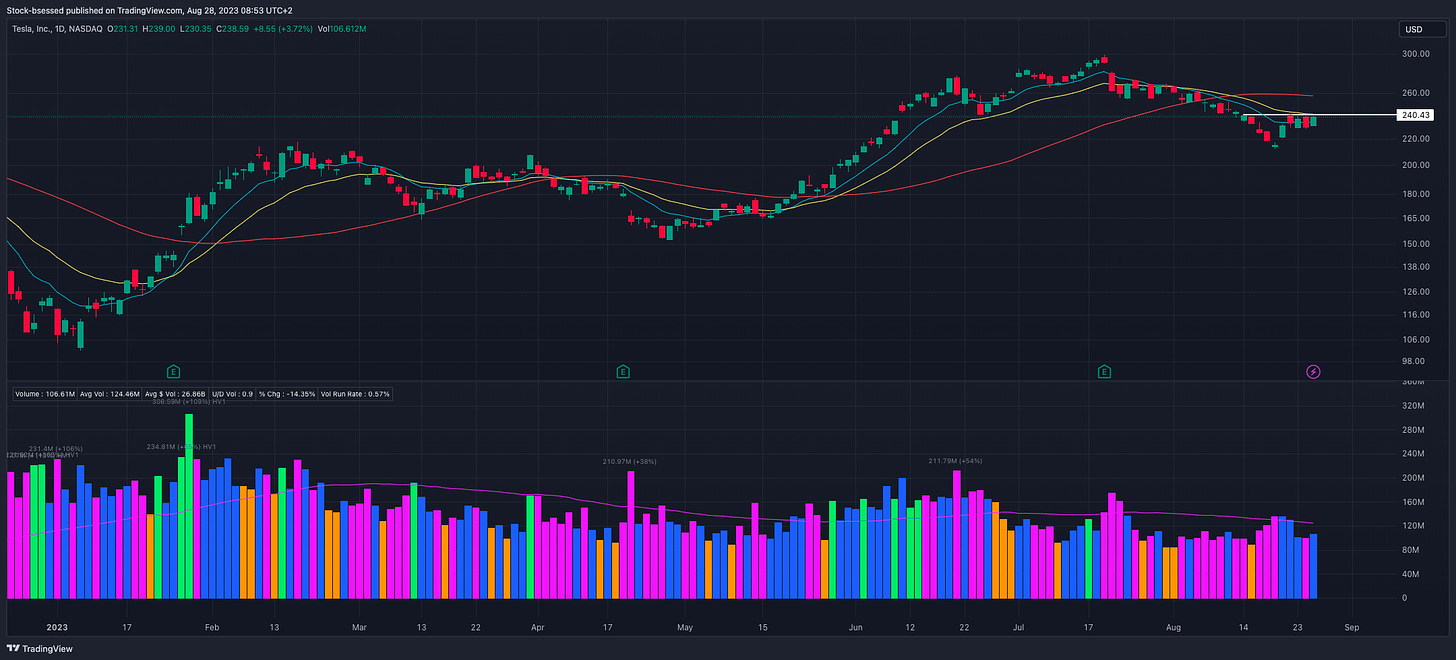
TSLA 0.00%↑ Like how this has been tightening up over the last 4 sessions here right below this 240 pivot and the 20EMA. Have no plans to trade until I see confirmation of an improved environment but I will be watching this one for a potential move back to the 50-day or for sellers to step up once more at the 20EMA:
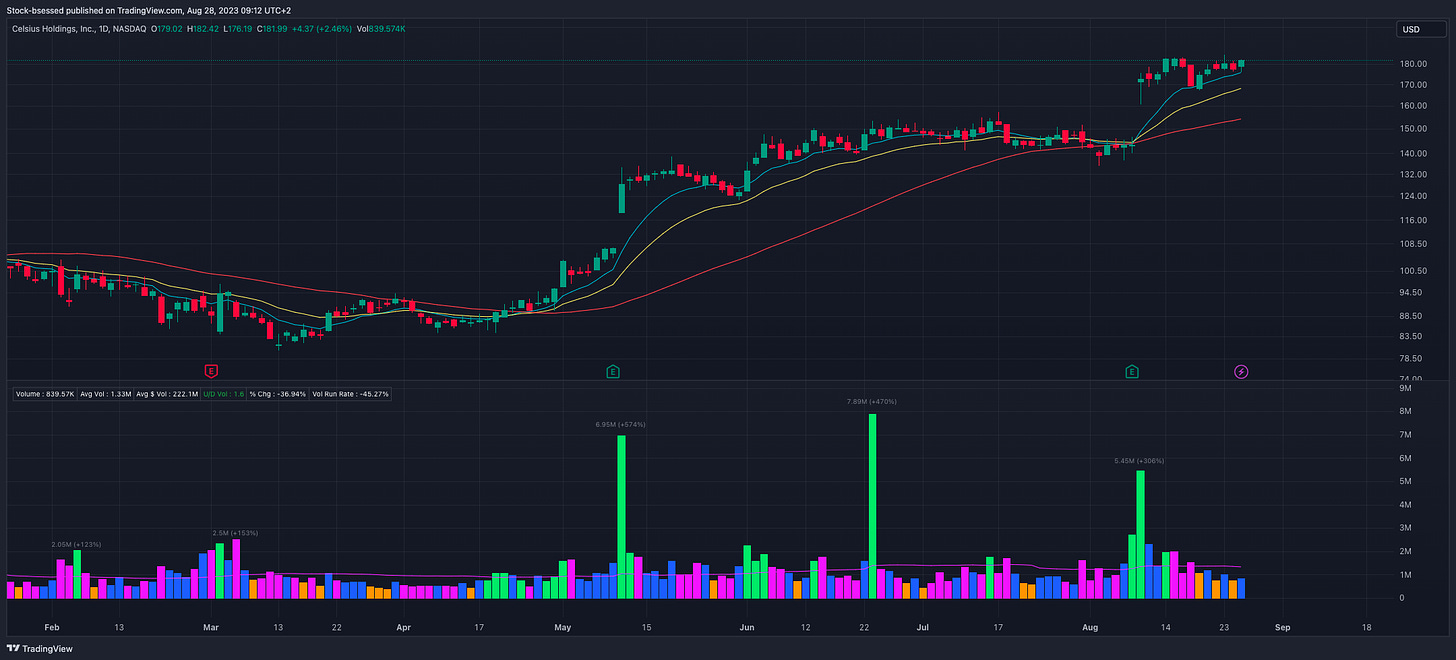
CELH 0.00%↑ Could not care less about the general market weakness as it continues showing relative strength while riding the 10EMA higher - like how it is now tightening up right below this 183 level:
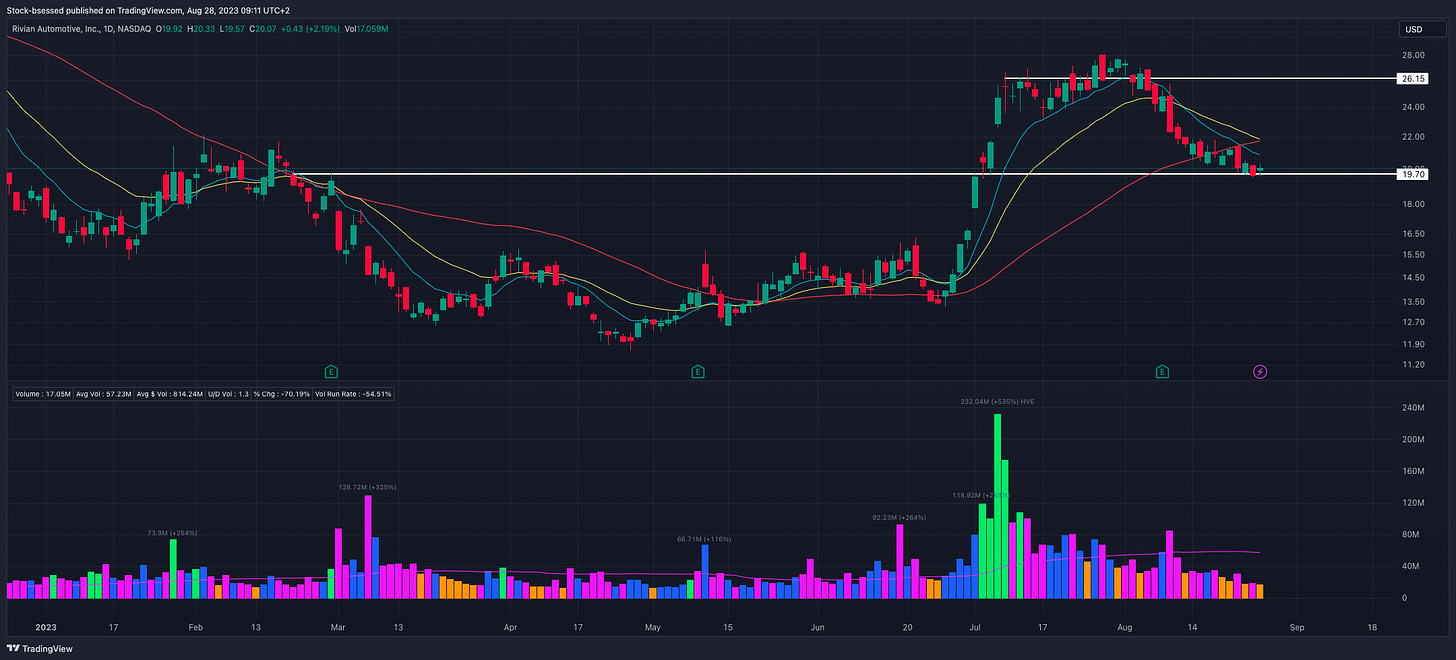
RIVN 0.00%↑ With a retest of the most recent base breakout - would like to see this hold the 20 spot and push up higher from here:
APP 0.00%↑ Similar shape to CELH 0.00%↑ as this keeps on grinding higher and riding the moving averages while forming base after base as it now tightens up right at the highs:
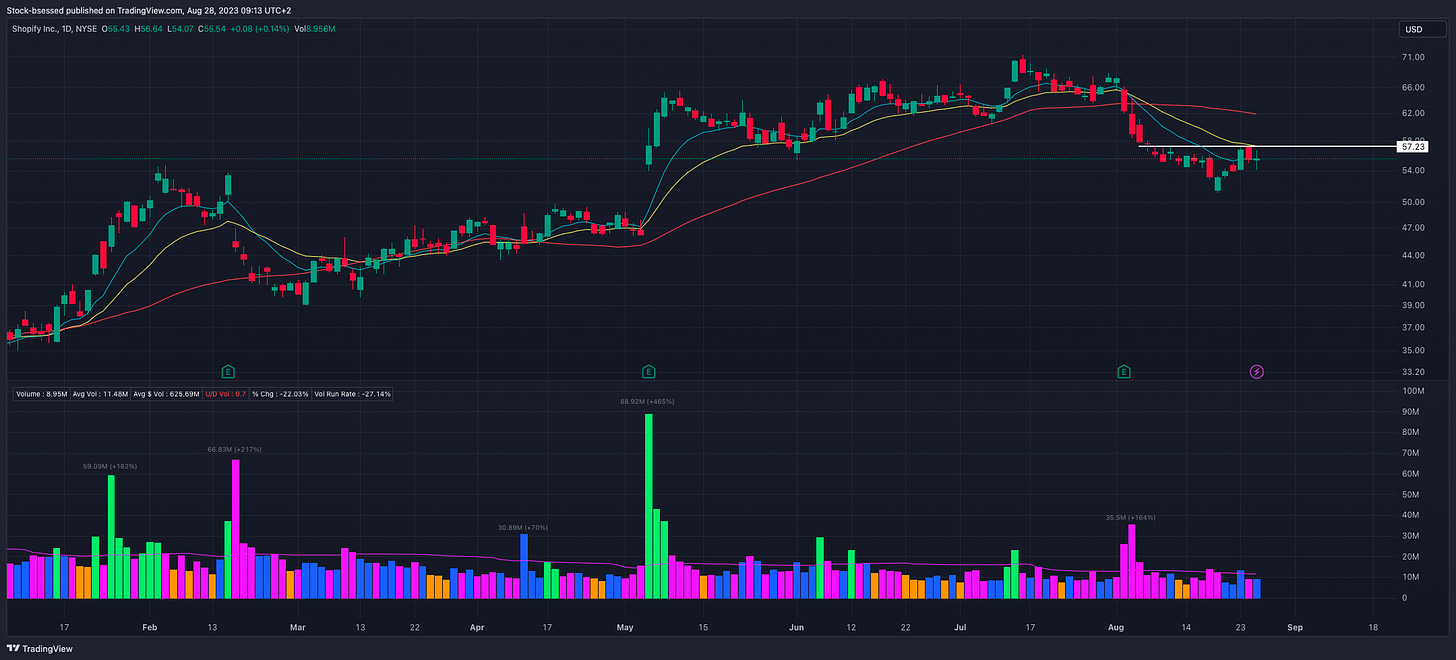
SHOP 0.00%↑ Similar shape to TSLA 0.00%↑ in that this is also attempting to tighten up over the last few sessions, sitting just below the 20EMA - will be watching for a break of last session’s highs and a push through this 57 area:
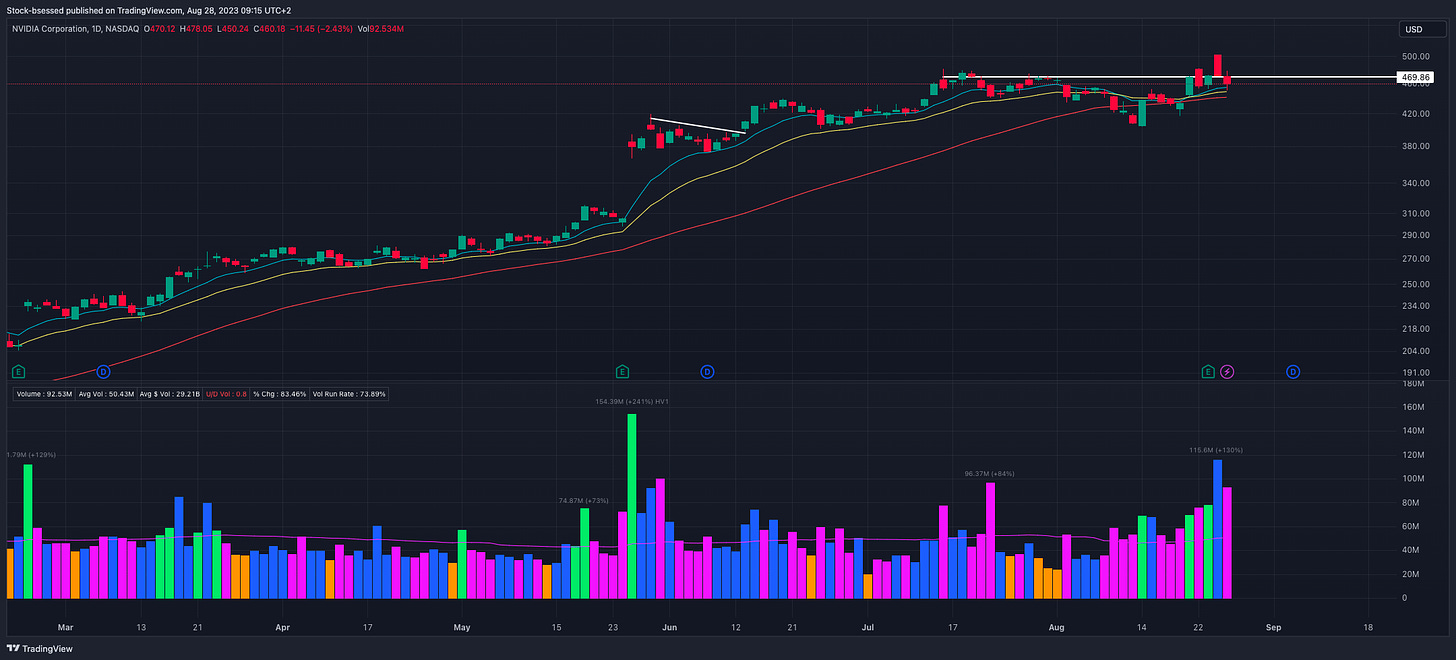
NVDA 0.00%↑ Struggled to hold on to the after-hours gains on Thursday after initially reacting well to its earnings report before sellers maintained clear control throughout the session to close this right near the lows. Nothing broken just yet as this is still above KMAs however as mentioned last article this had already gapped up several times in a row over the last few earnings reports and so may have become a bit too “obvious” of a trade:
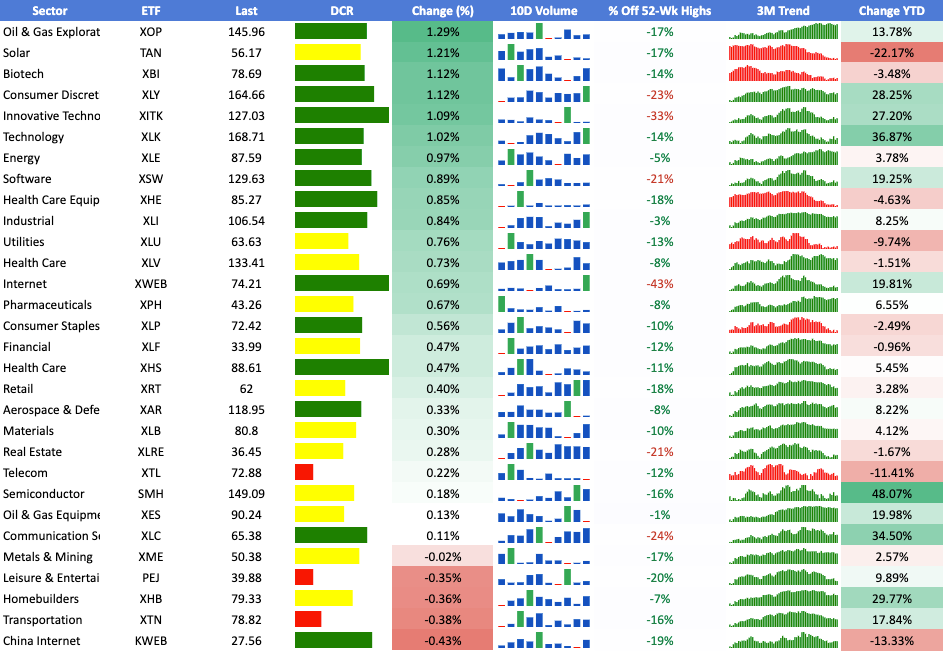
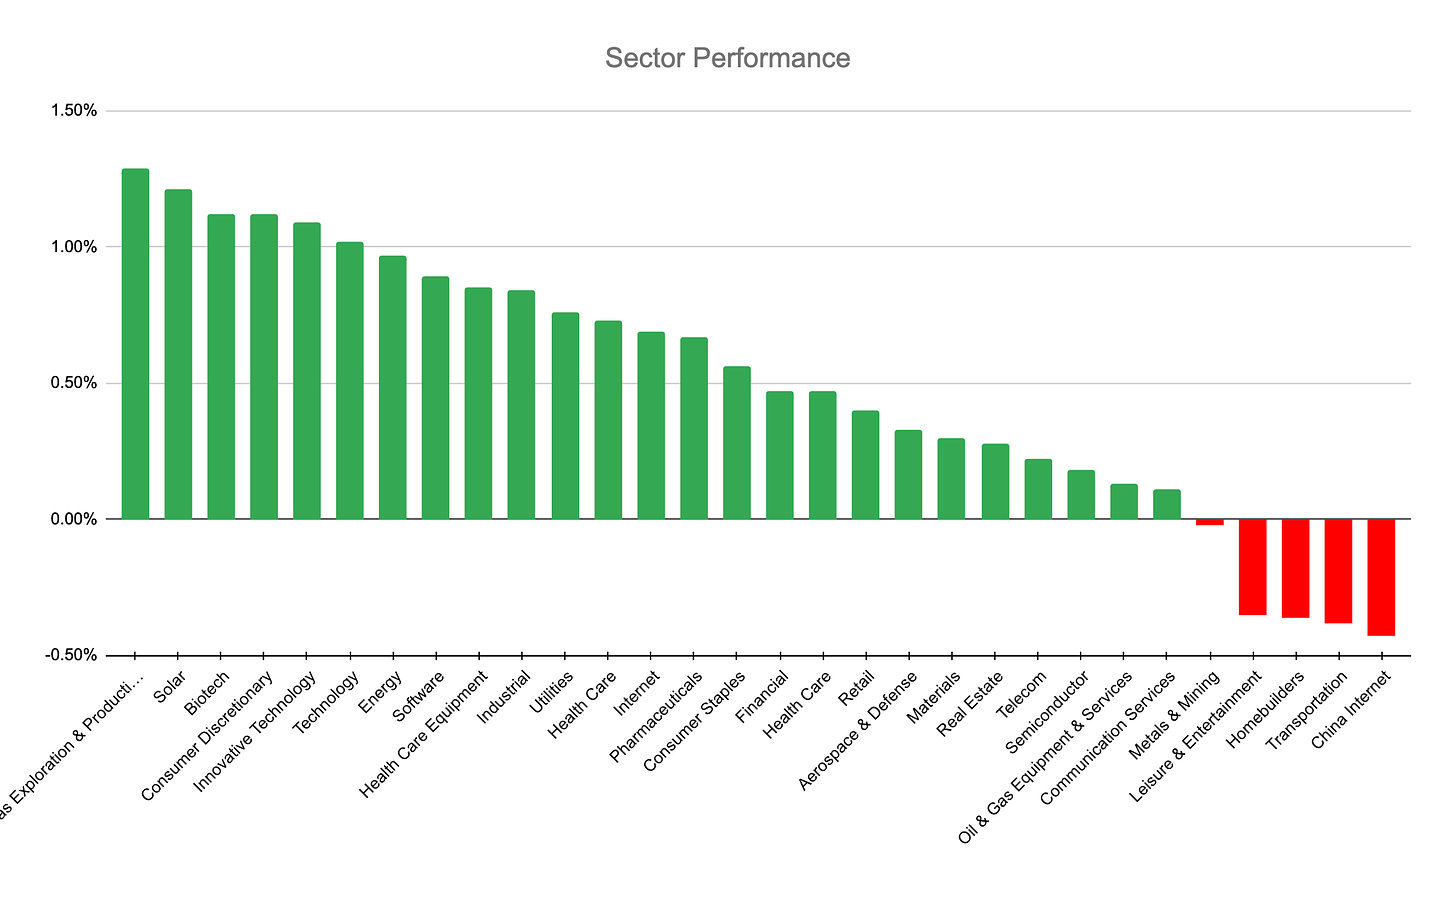
Individual Sector Analysis
I am linking the sectors watchlist in tradingview for your convenience, here
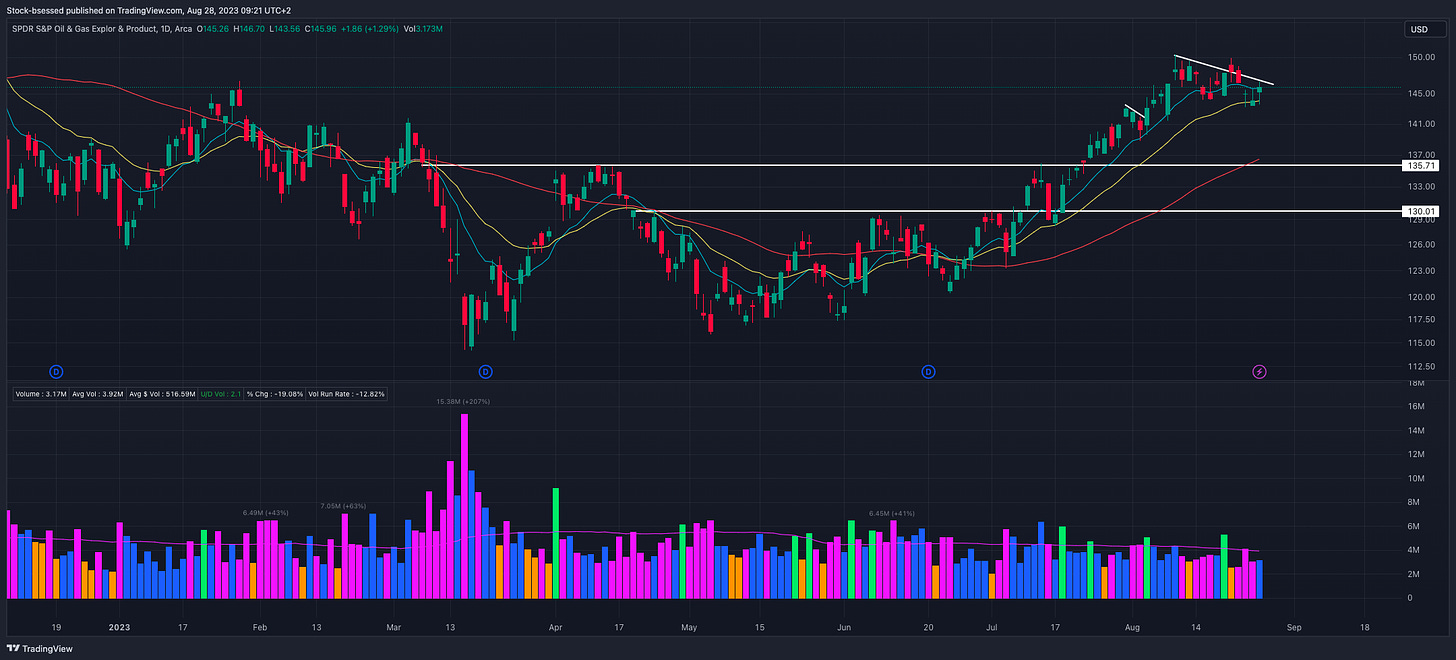
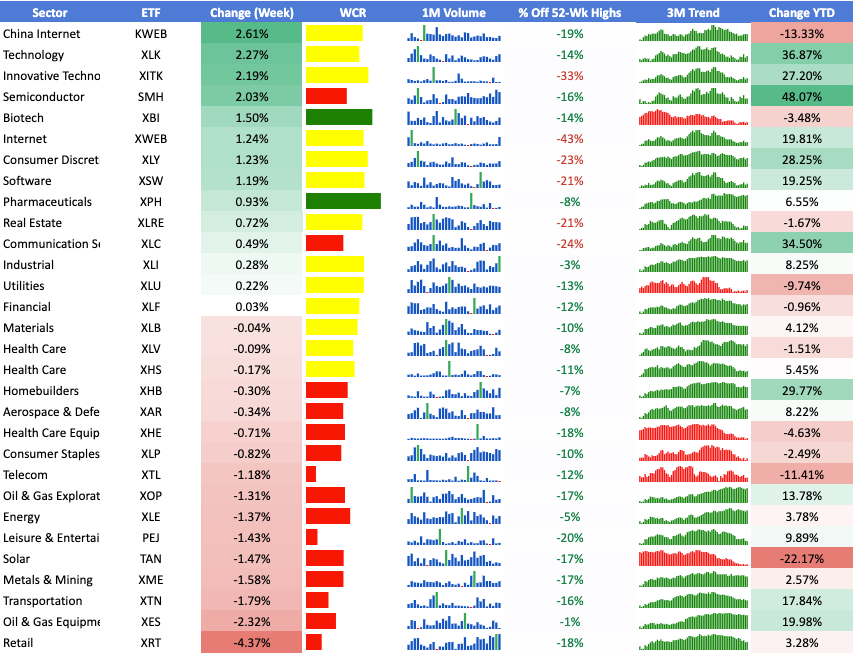
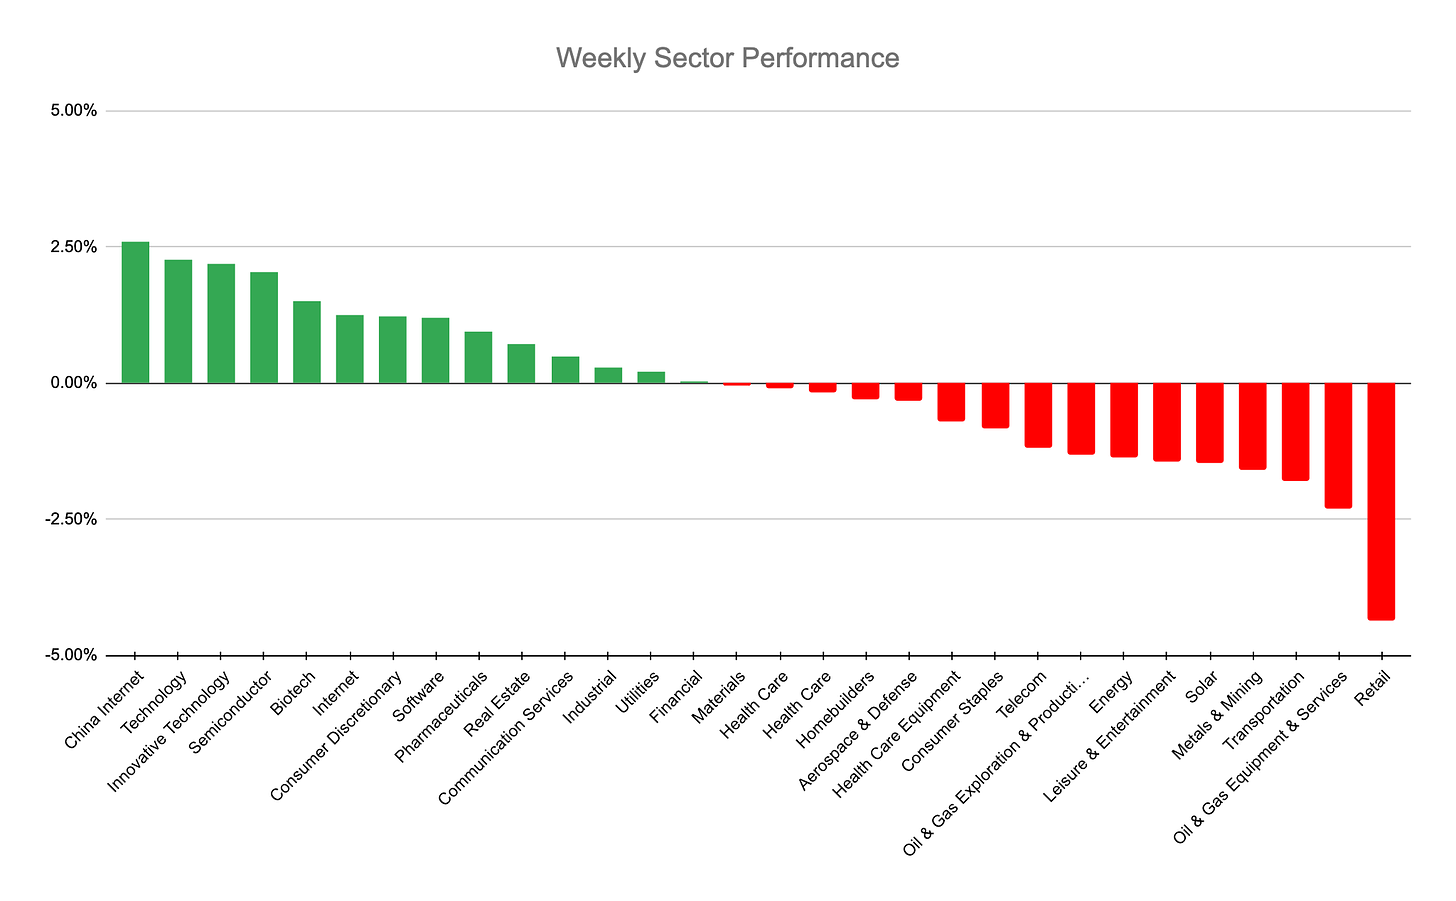
XOP 0.00%↑ XLE 0.00%↑ - Energy remains strong here while the general growth trade takes a rest with the QQQ 0.00%↑ showing signs of distribution
XLK 0.00%↑ A reclaim of the 10EMA and this 170 level would be great for tech here:
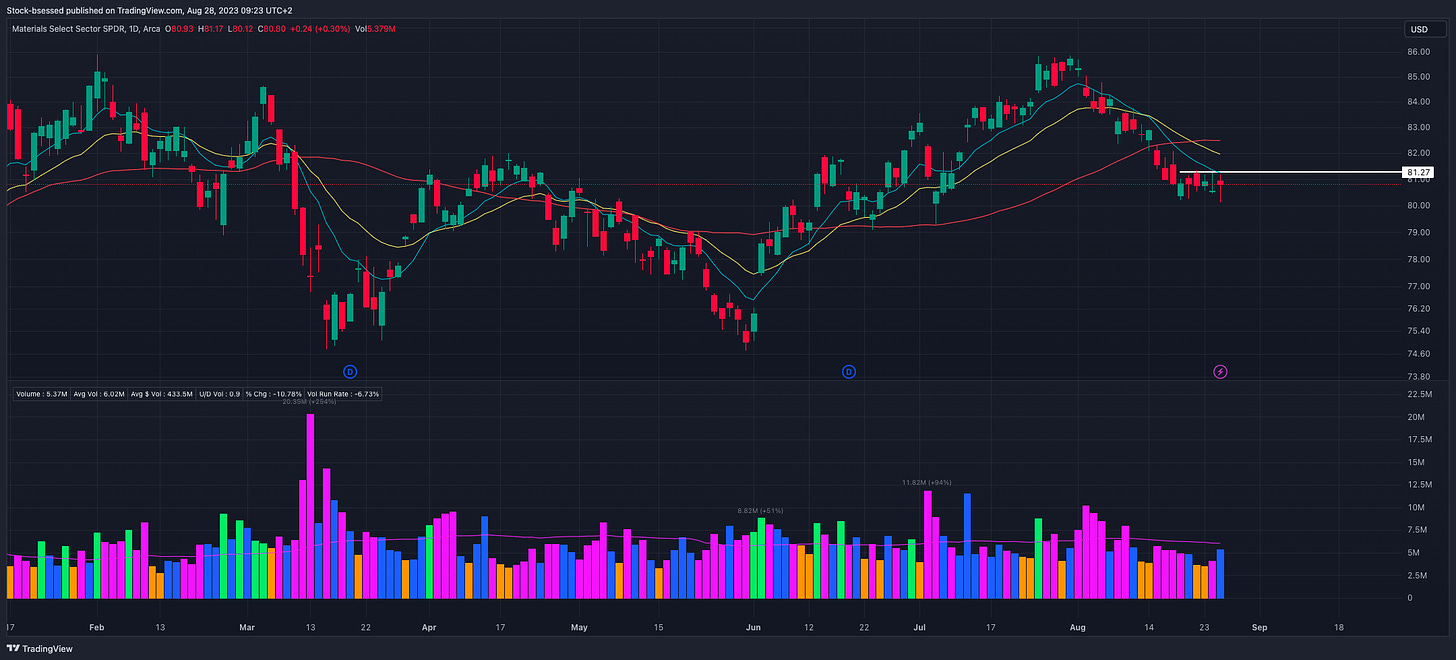
XLB 0.00%↑ Pulled back below the KMAs here and is now attempting to U-turn as it tightens up below the 10EMA and this 81 area:
Scans
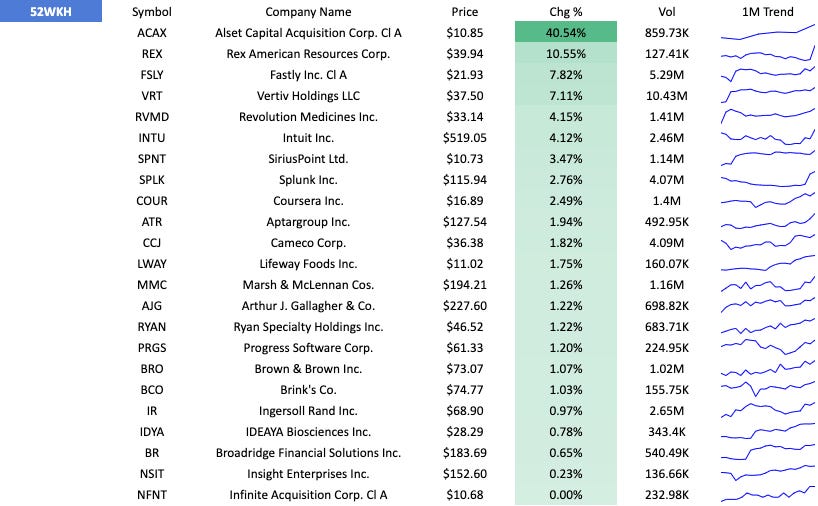
52 Week highs
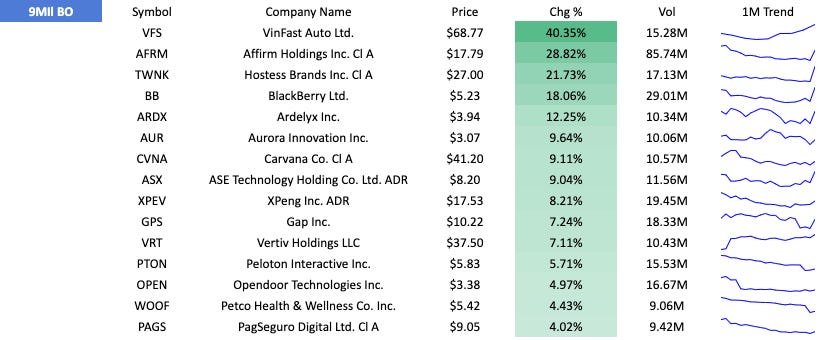
9 Million breakout
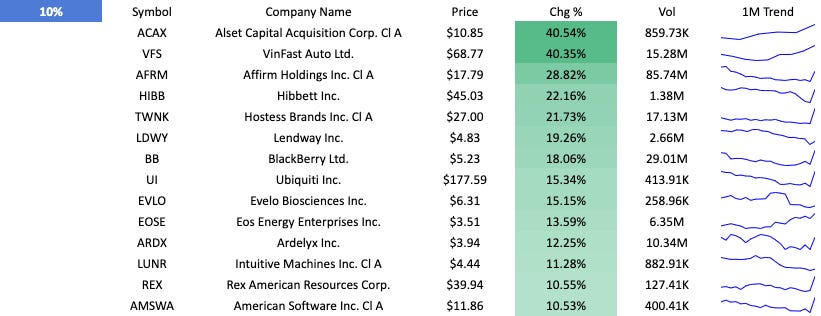
+10% Breakout
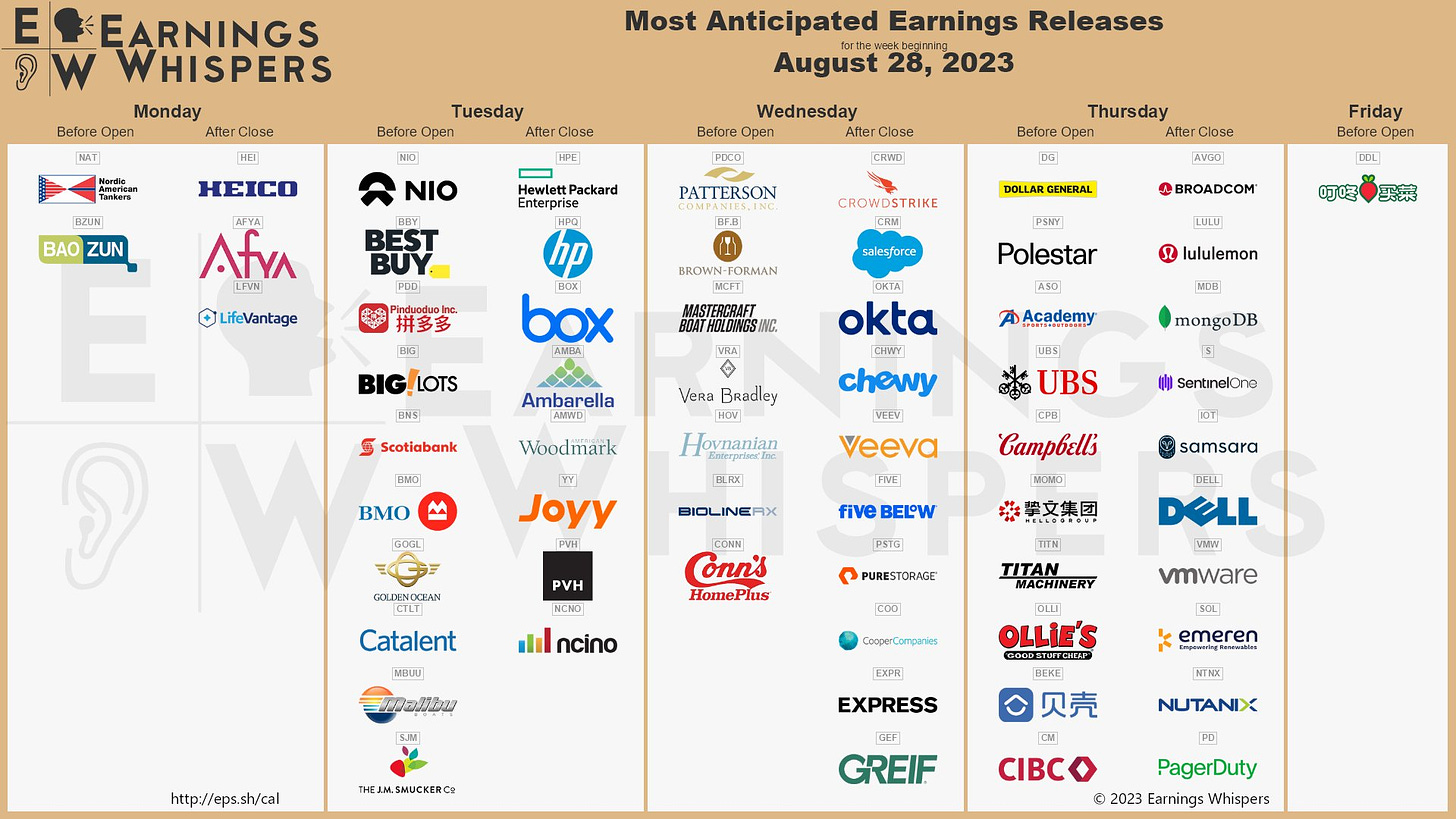
Upcoming Earnings
Personal Portfolio Update
No trades made this week as I remain 100% in cash.
Focus List
Reminder to NOT force anything and rather wait for your edge to show up clearly!
Pivots
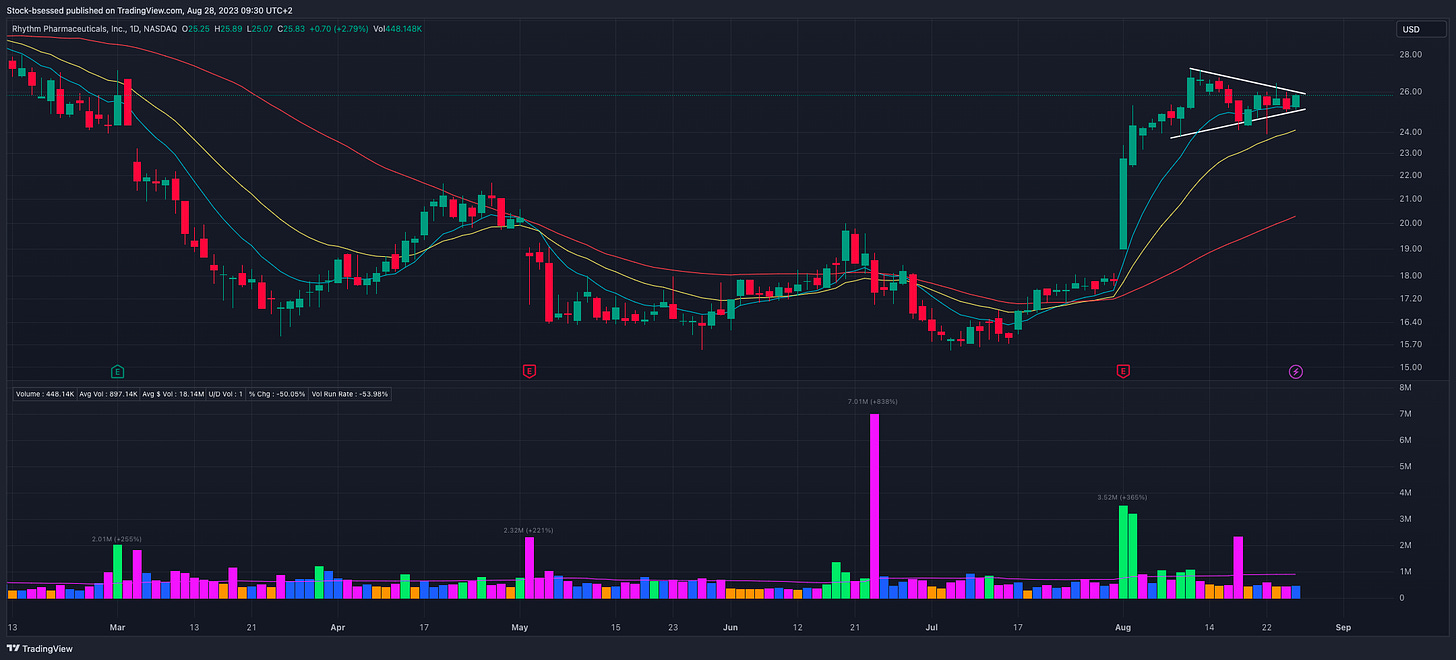
RYTM 0.00%↑ - Really liking how this is coming together with an inside day last session:
High-Tight Flags
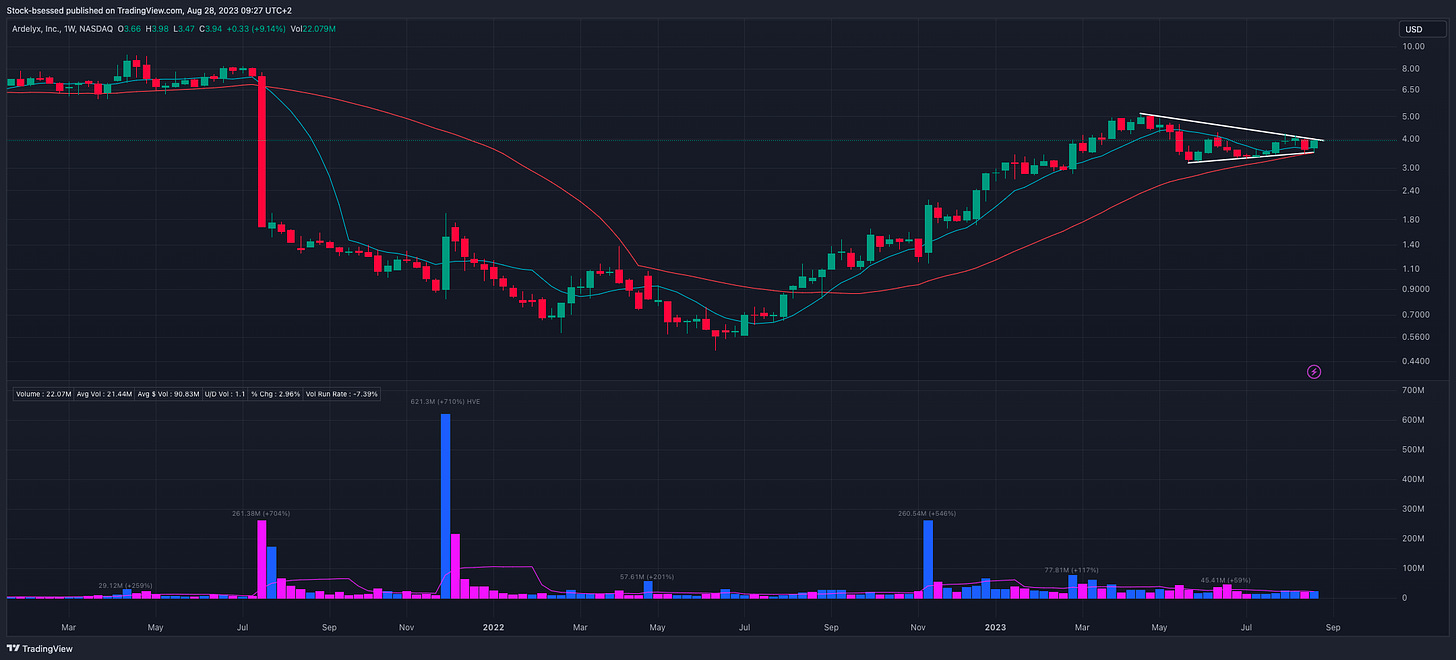
ARDX 0.00%↑ Like how this is shaping up on the weekly here:


