

Weekly Review & Focus List For Week of 13th March
Weekly Review & Focus List For Week of 13th March
Widespread Distribution - Earnings, Industry & Leading Stock Analysis, + 3 Helpful Scans

Hi all!
In this version of the weekly newsletter I will cover:
General Market Overview
The action displayed by leading stocks with TML potential
Individual Industry Analysis - Which groups are breaking down vs showing relative strength
3 Helpful Scans to get potential leaders on our radar
Links to TradingView watchlists
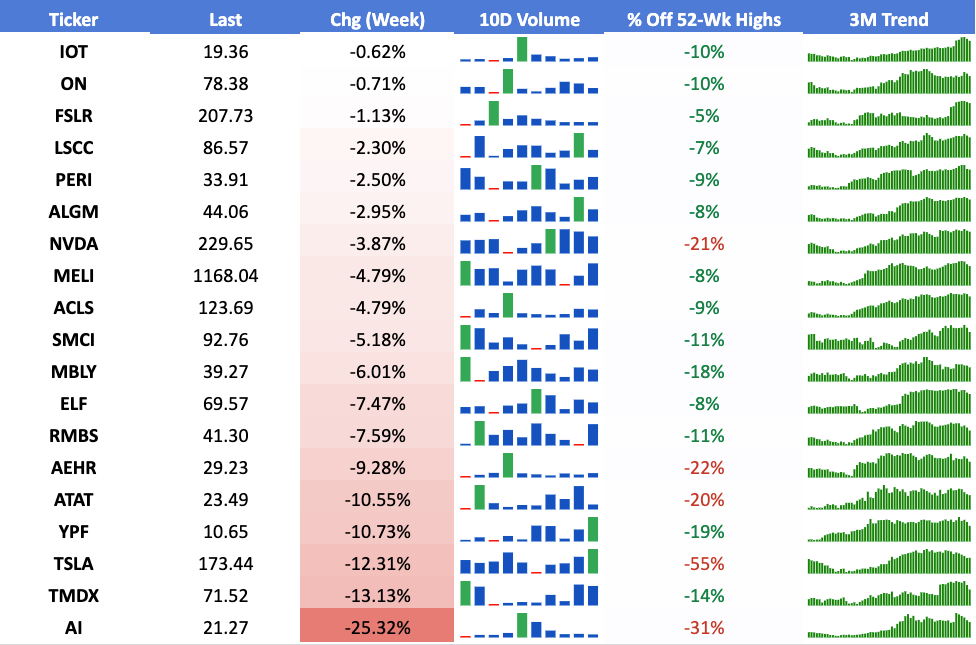
Stocks currently on my watch list
Stockbsessed is neither an investment or financial advisor. Stockbsessed does not provide financial advice and none of the information being provided is to be seen as such.
General Market Overview
The theme towards the end of last week was overall distribution with poor closes both on the session as well as for the week. Both leading stocks and the indexes got hit hard and were down figures that in some cases would be normal for a decline over a whole year rather than a single week.
As I have been advocating for some time now, patience is key, both in this current tape and most of all for a successful trading career over the years. You simply cannot make it as a trader if you are:
Eager to trade
Suffering with FOMO
Not practising progressive exposure - jumping in with large % position sizes right off the bat at the first sign of a potential market turn
It is essential that you are patient and follow the overall market as well as individual stocks closely to let the setups pull you back in with small position sizes, and if you do make progress with those initial buys - that would warrant taking on additional risk as it gets financed from previous trades.
Last Session:

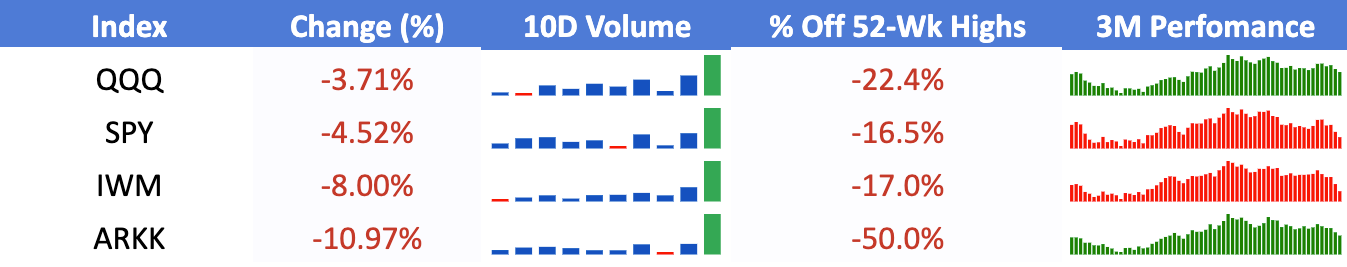
All major indexes now decisively below the 50-day moving average and all more than -16.5% off the highs - sellers are clearly in control as last session saw distribution with a pick up in volume that closed towards the lower end of the daily range.
Week:
While this is in no way a signal of any kind on its own, it does offer some perspective that we should not abandon our process just because things are looking gloom - continue keeping in tune with the market and following stocks as you never know when things might turn around, image below shows March is often when the market bottoms:

Came across an interesting chart showing the average decline in years where the SP500 closed negative up to 2011. The fact that the average decline was 13.77%, and the SPY 0.00%↑ lost almost a third of that in just a single week shows that this was not ordinary selling but rather widespread distribution over the last week:

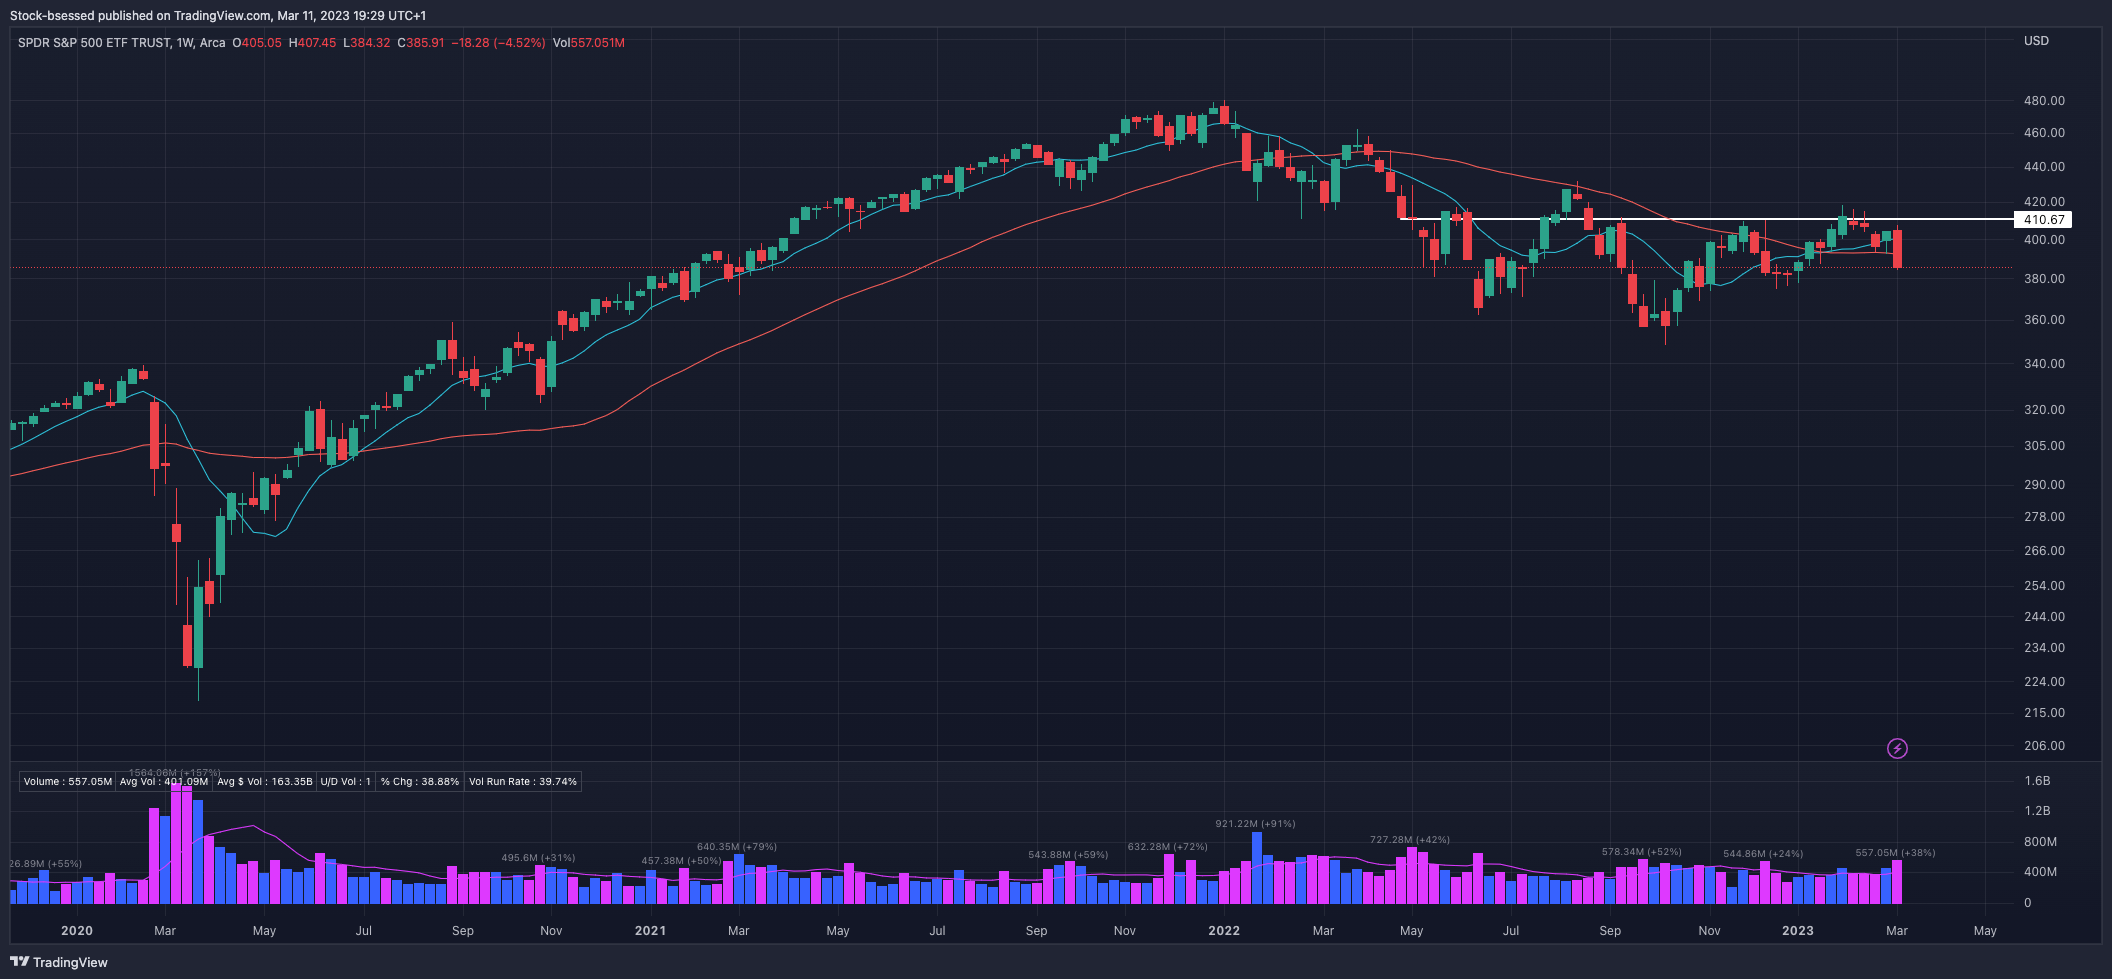
SPY 0.00%↑ Breaks previous session's low and found additional selling from there, now firmly below ALL key moving averages with the 10 & 20EMA trending downwards and the 50/200DMA flattening out above price.

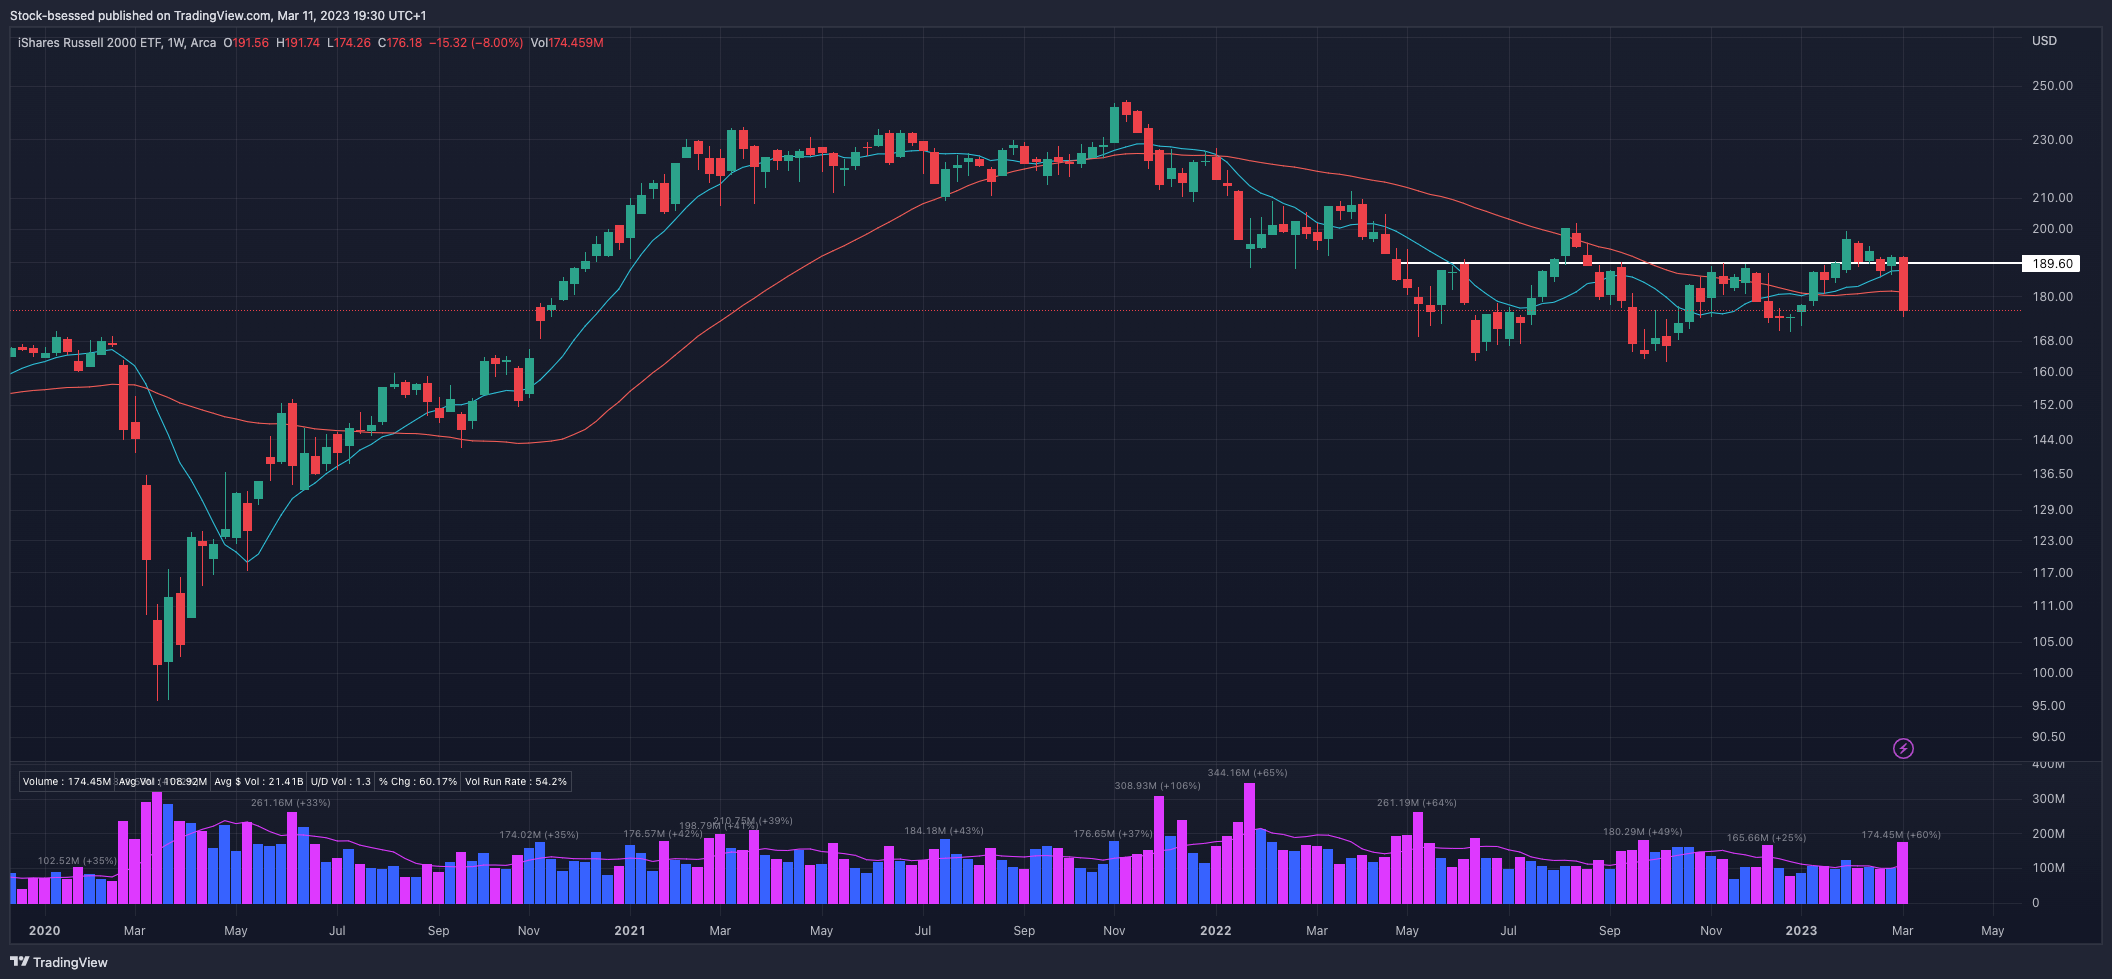
Breaks down through the 10 and 40 Week moving averages:
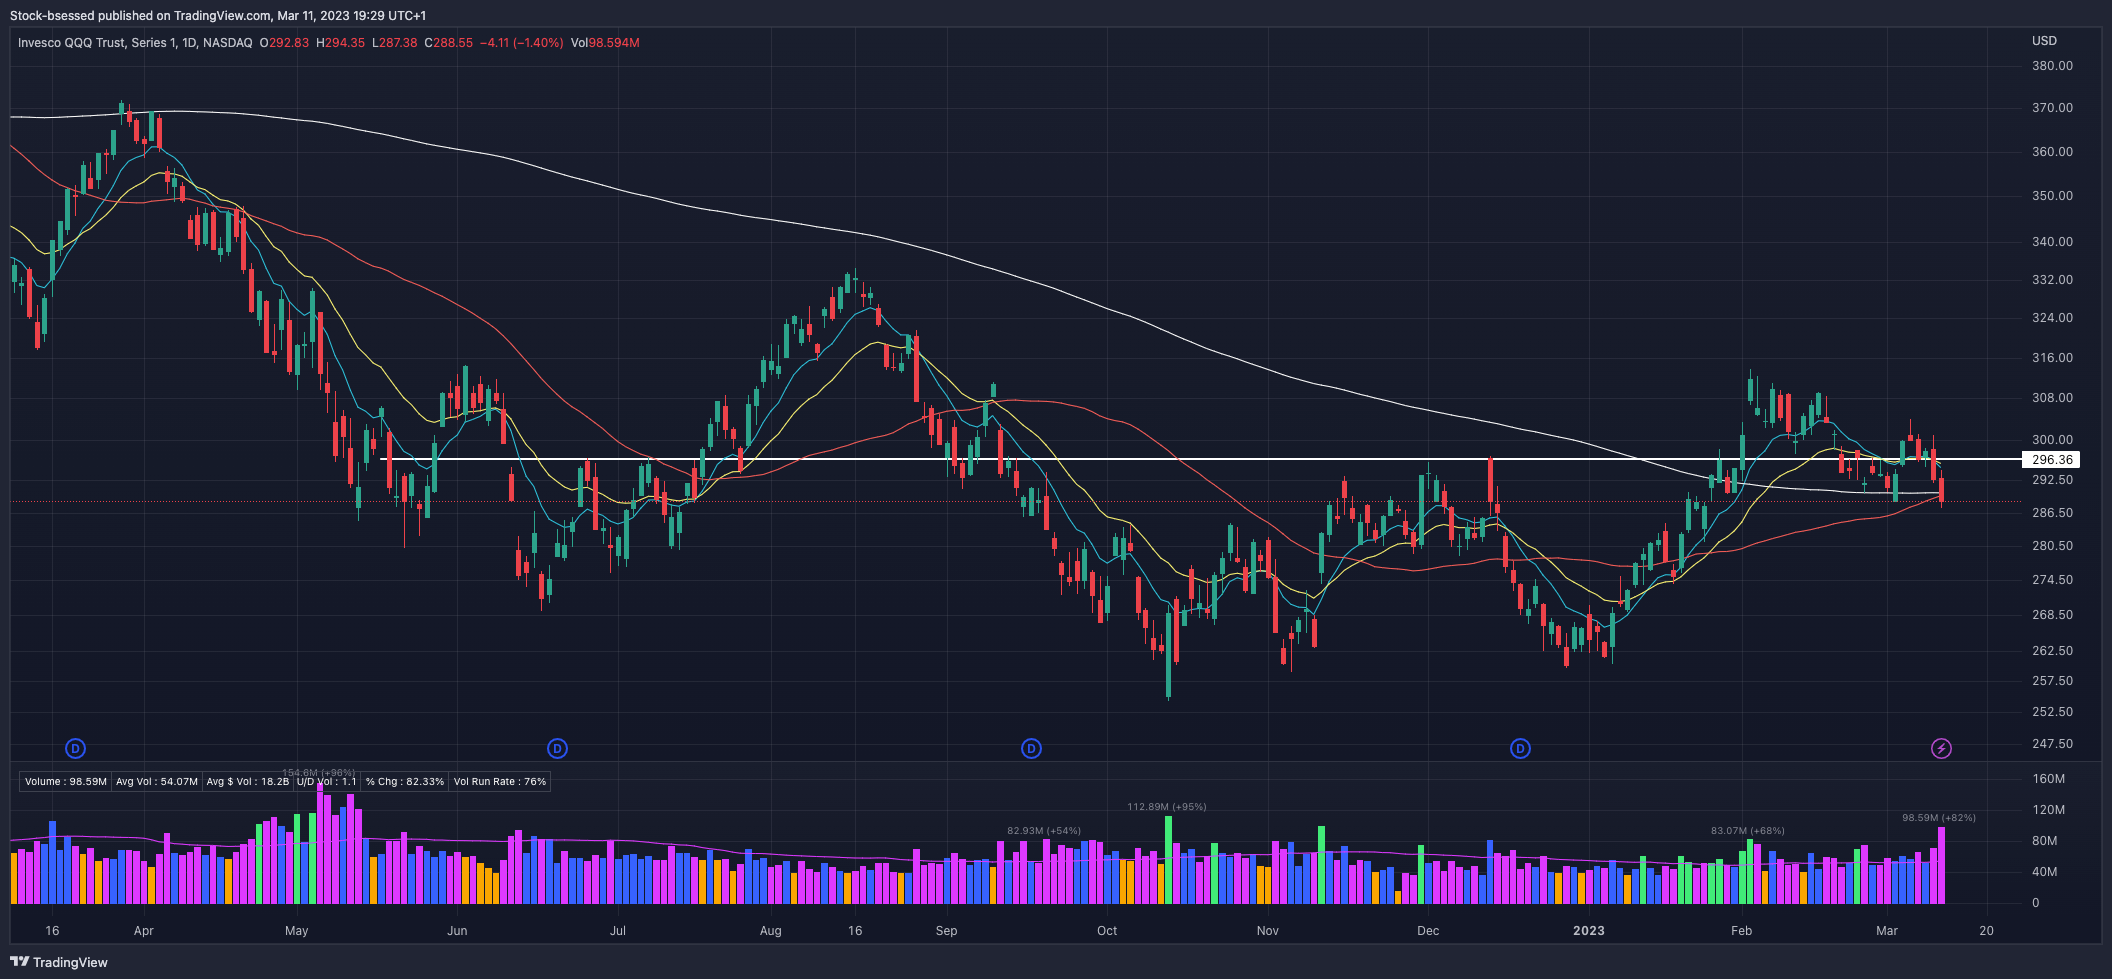
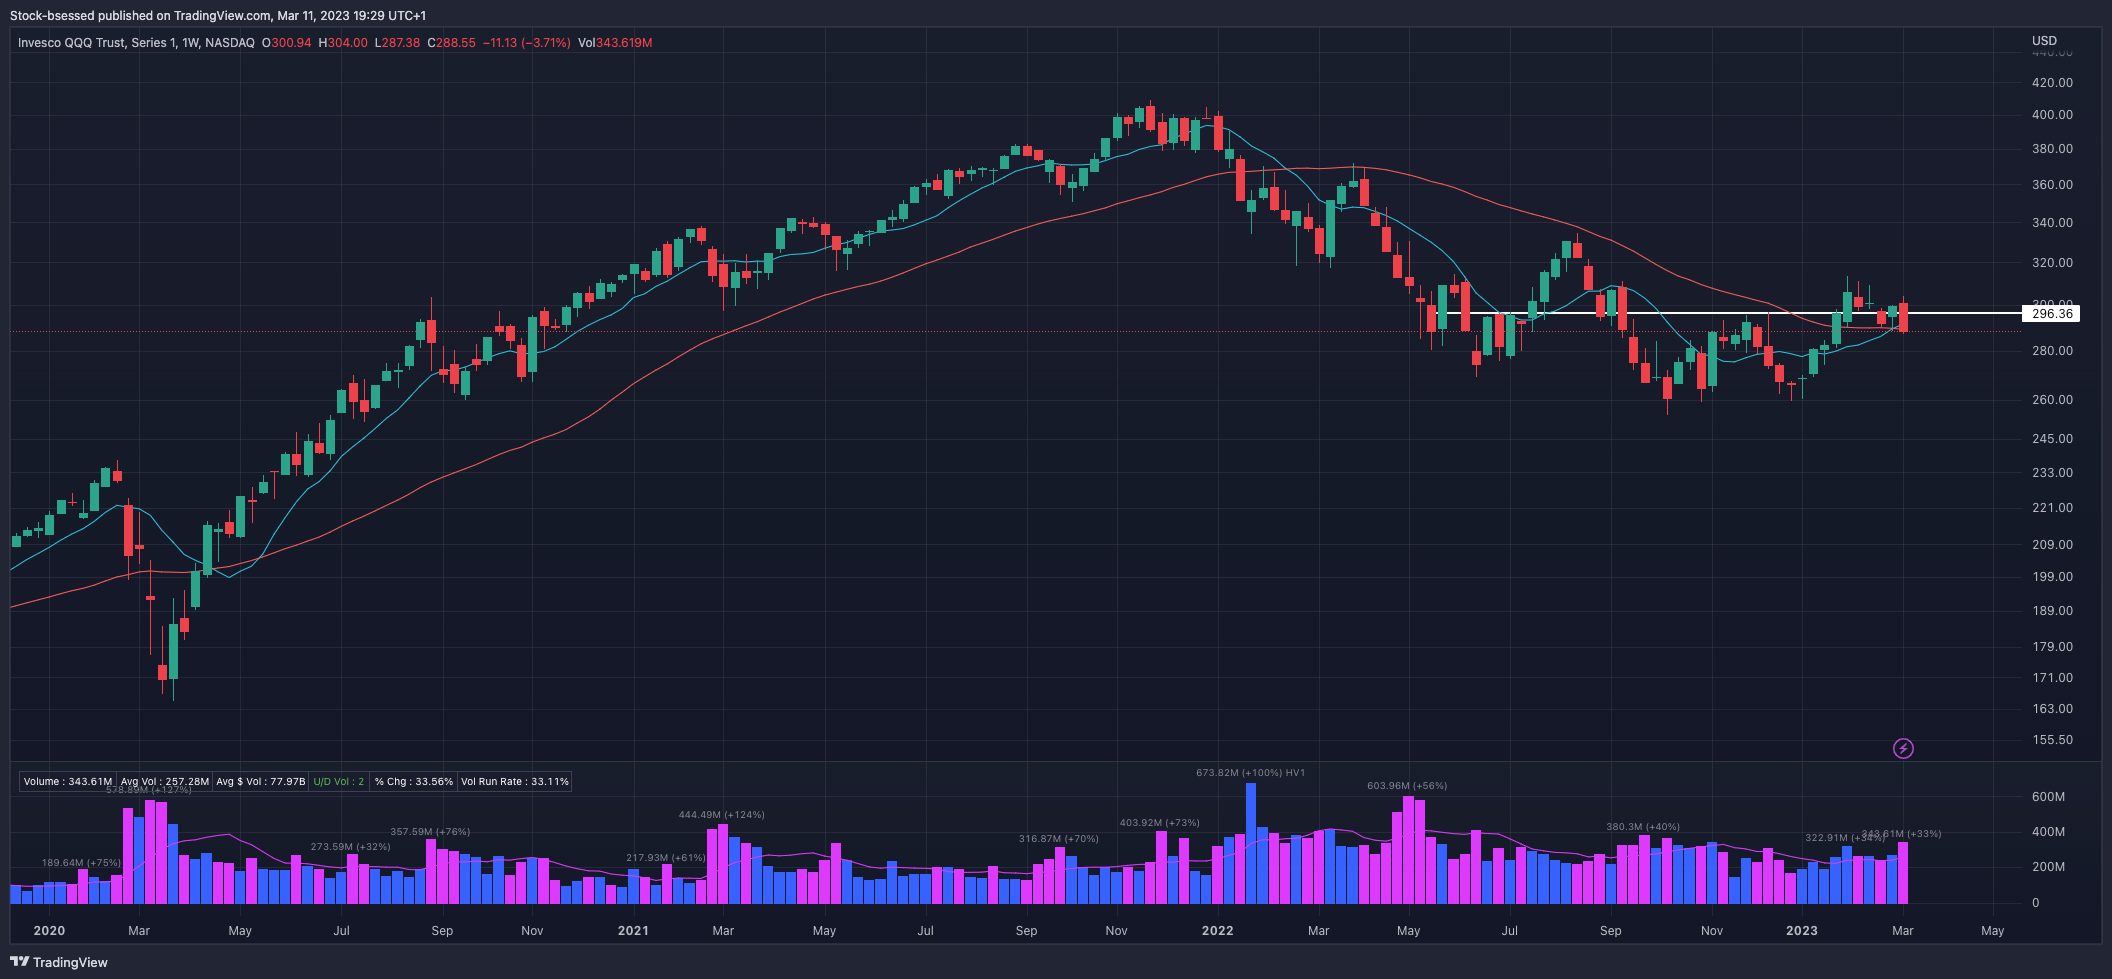
QQQ 0.00%↑ Was previously looking quite strong as it was flagging nicely above previous resistance and key moving averages but now below ALL KMAs as it broke the 50/200DMA on a pickup in volume last session:
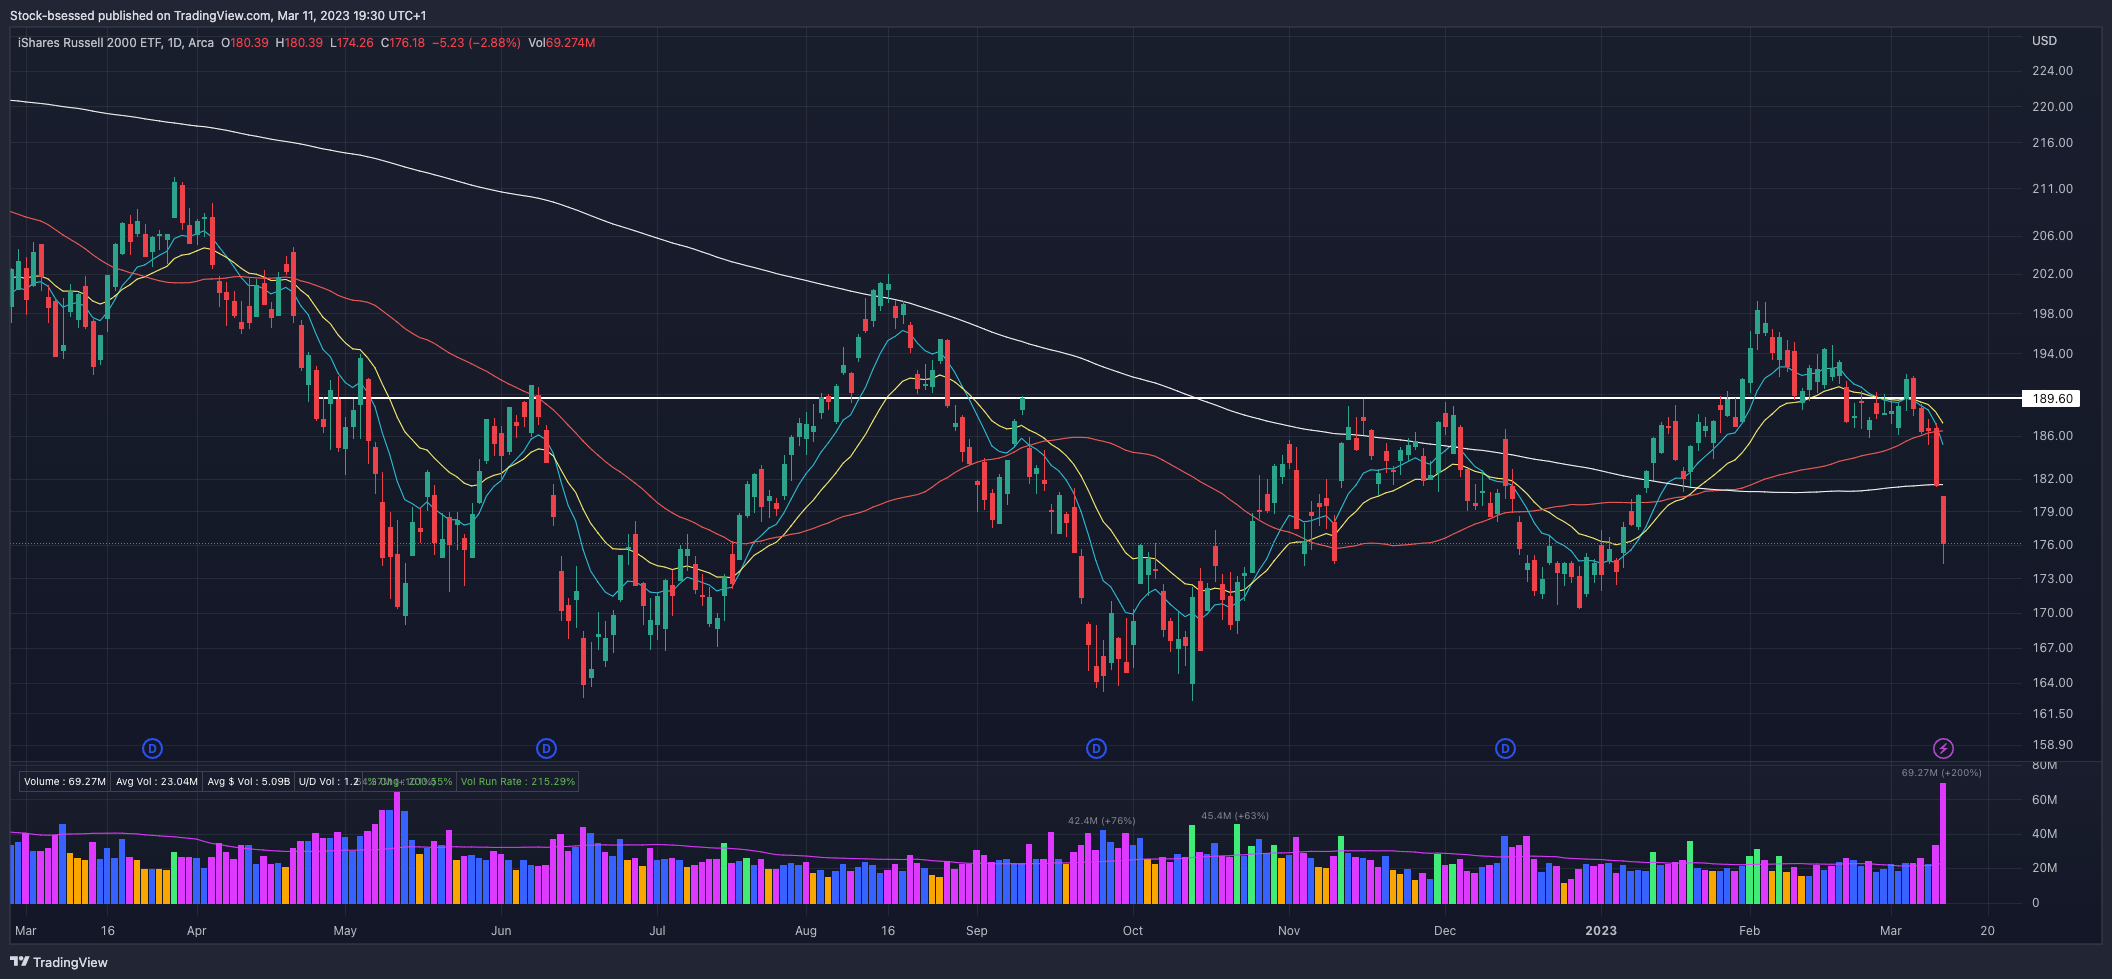
IWM 0.00%↑ Relative weakness in small-caps as the IWM falls -2.88% on +200% volume to take it below ALL KMAs:
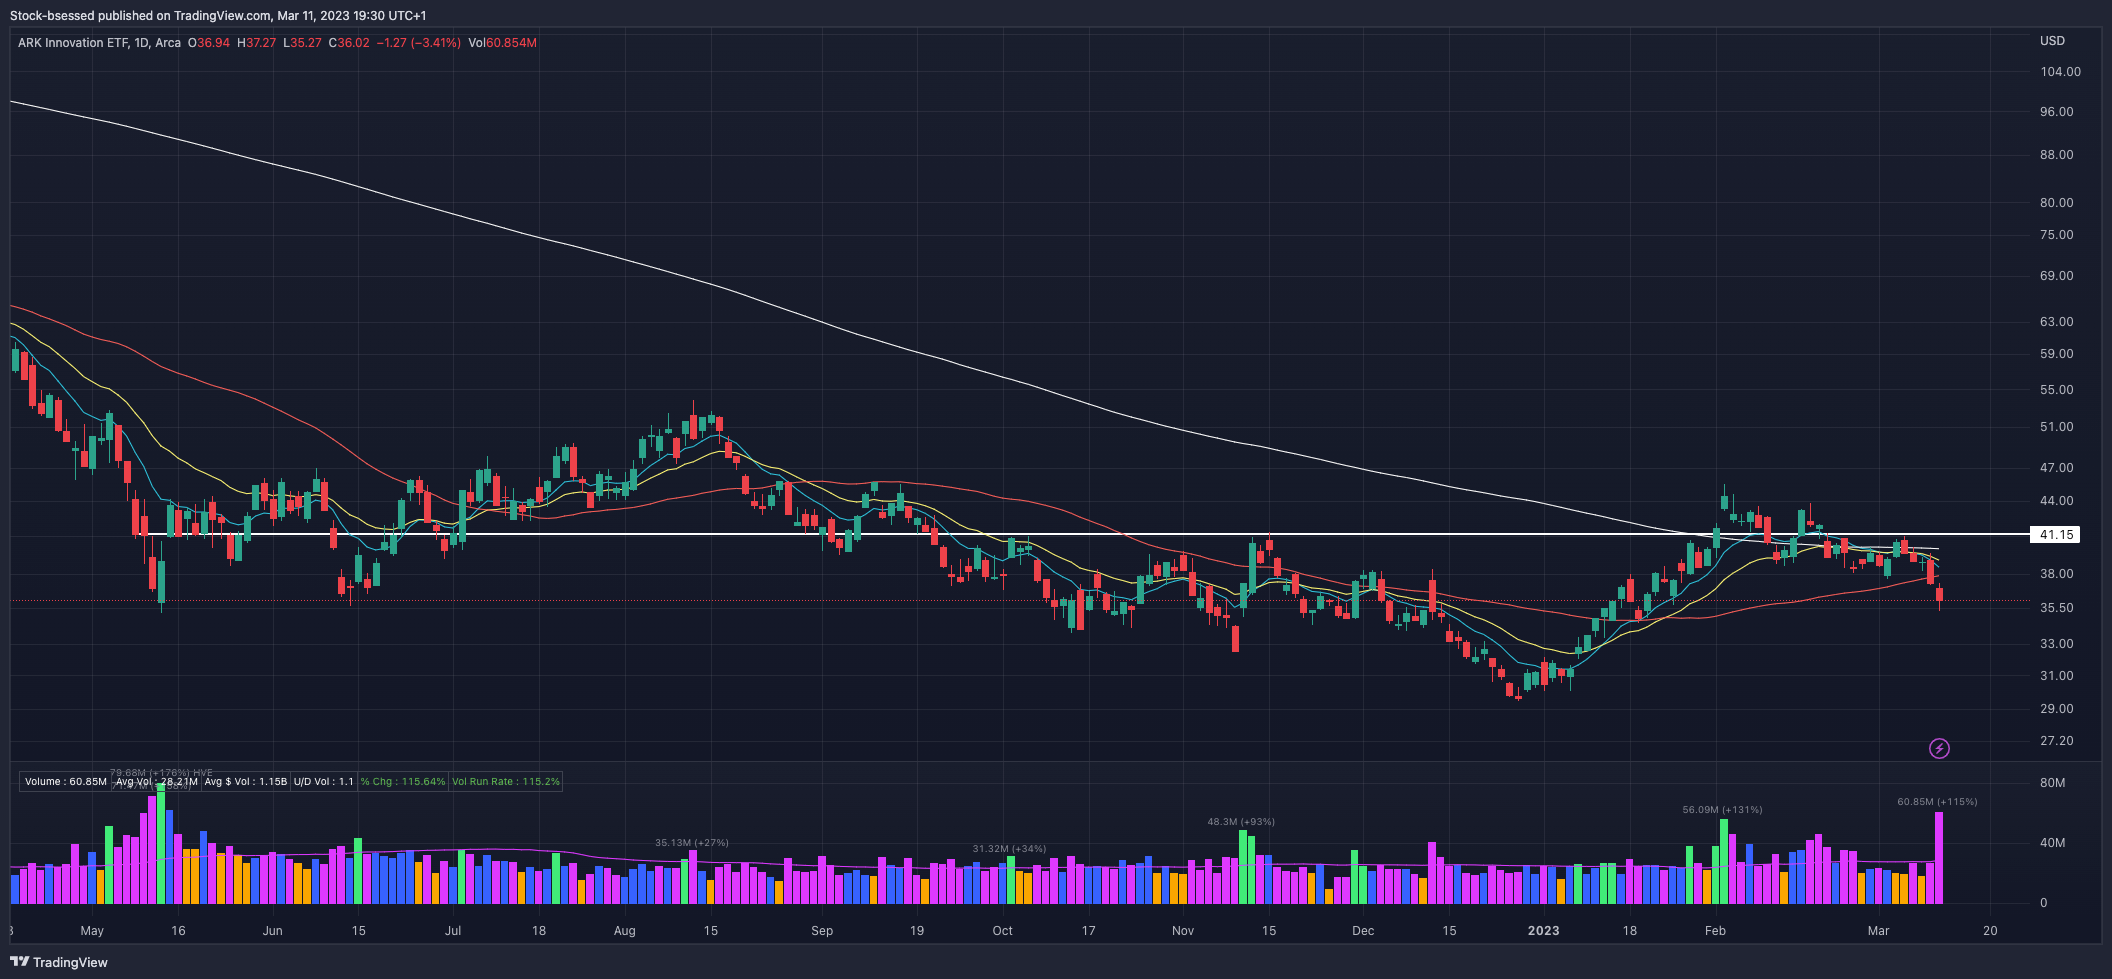
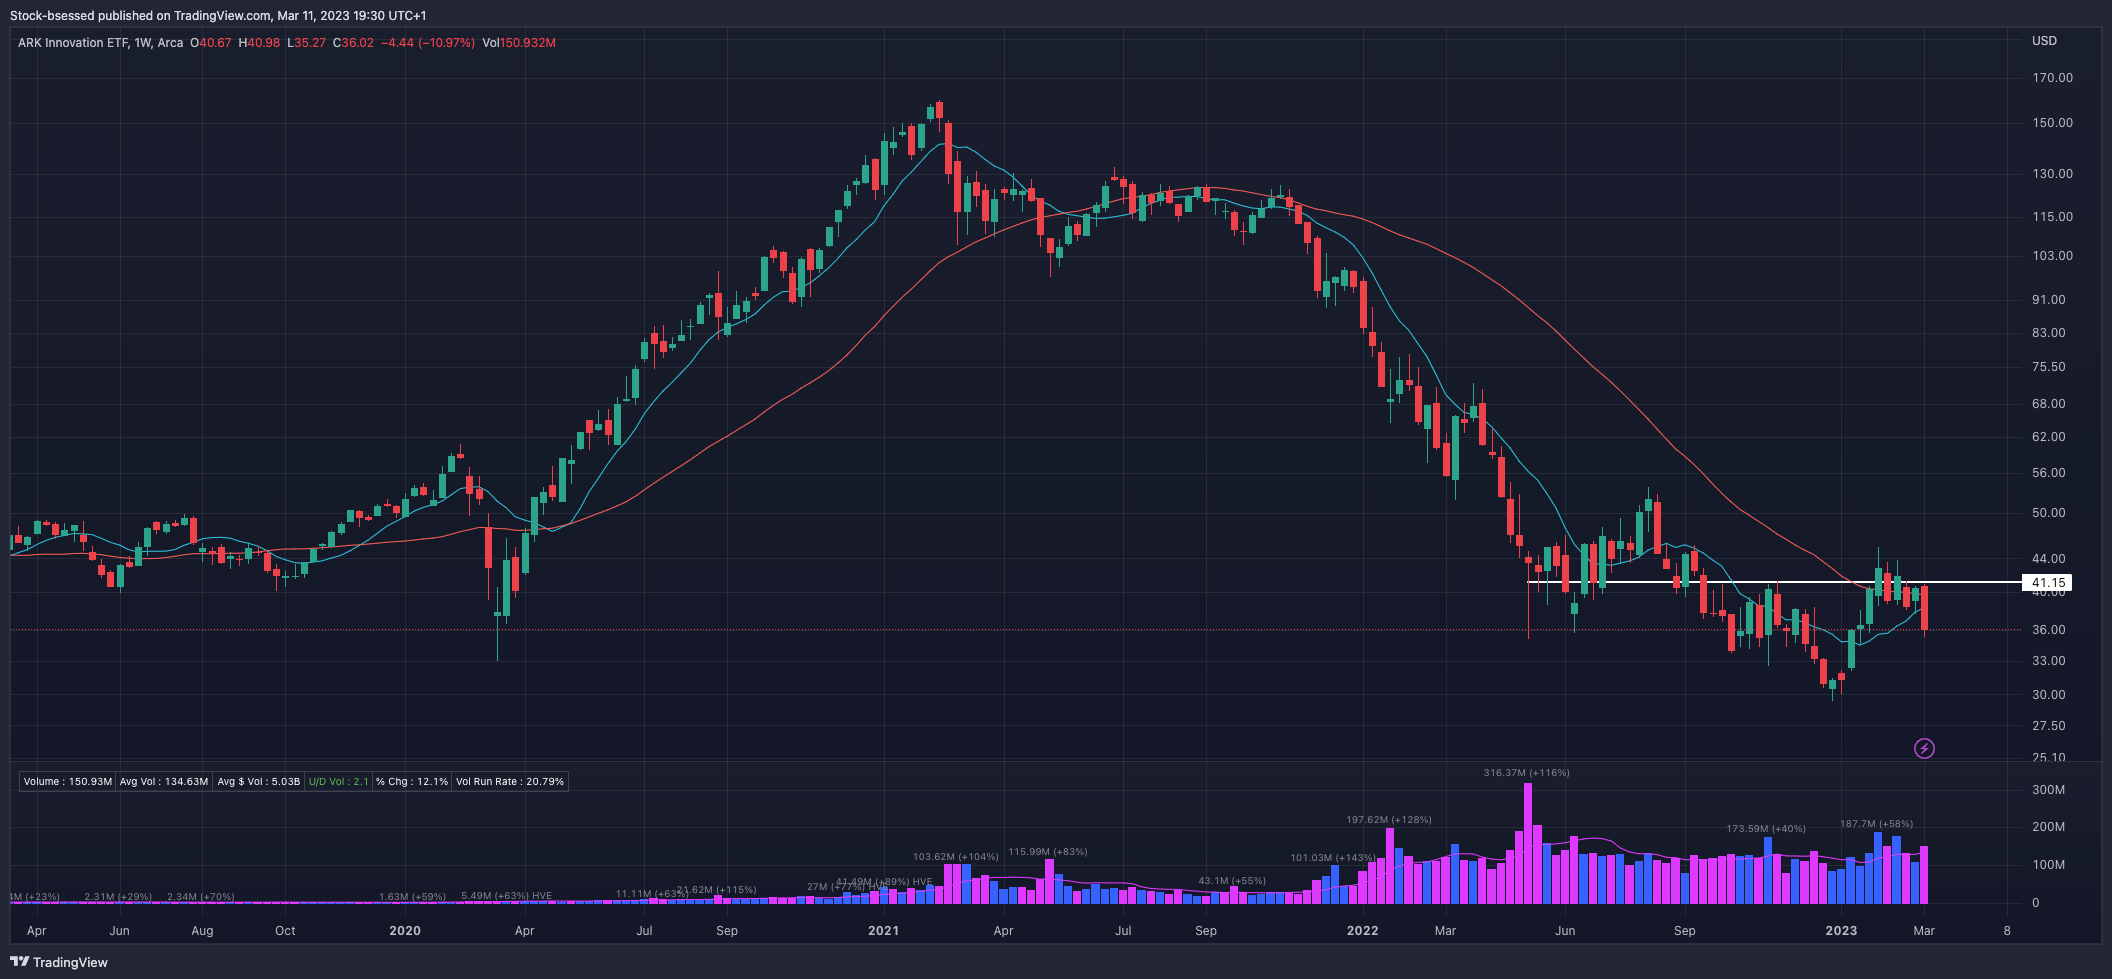
ARKK 0.00%↑ As above, showed relative weakness and lost key areas as it fell -3.41% on +115% volume:
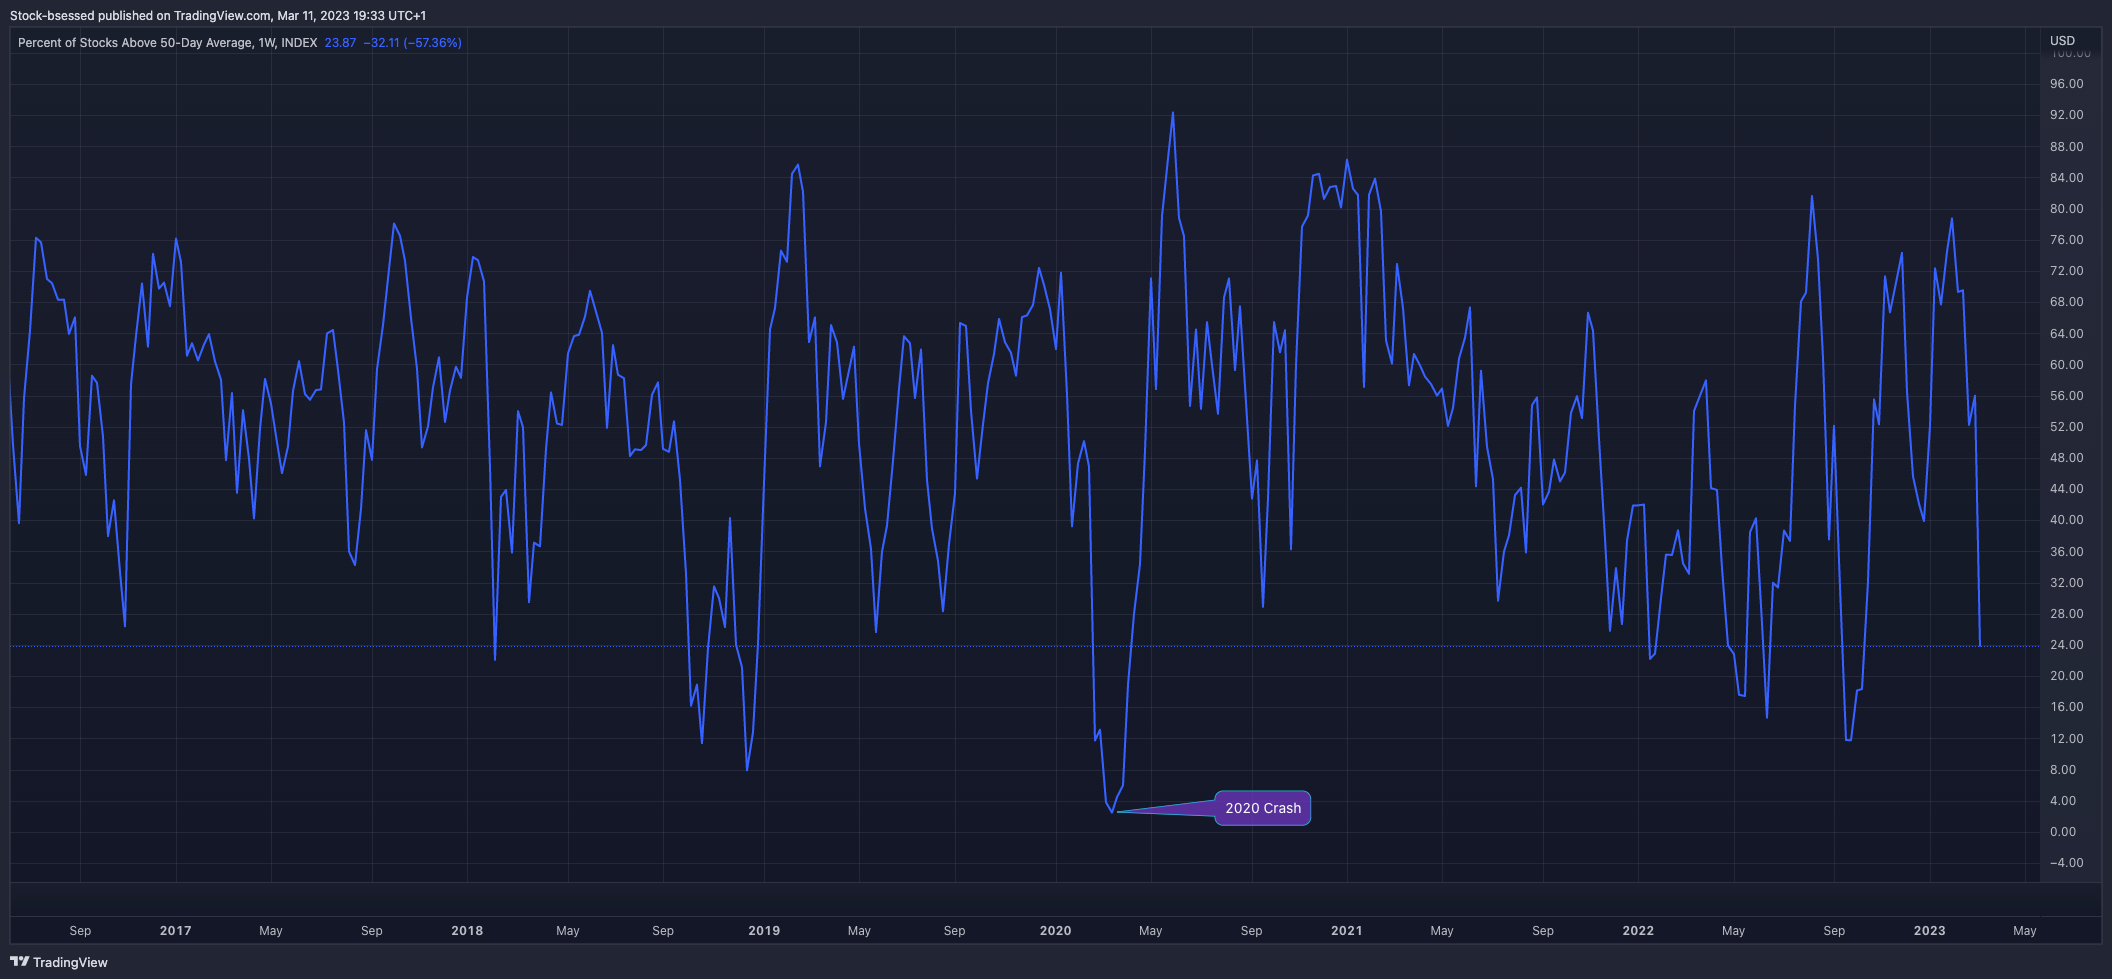
MMFI - Percent of Stocks Above 50-Day Average
Approaching levels where bottoms may form:
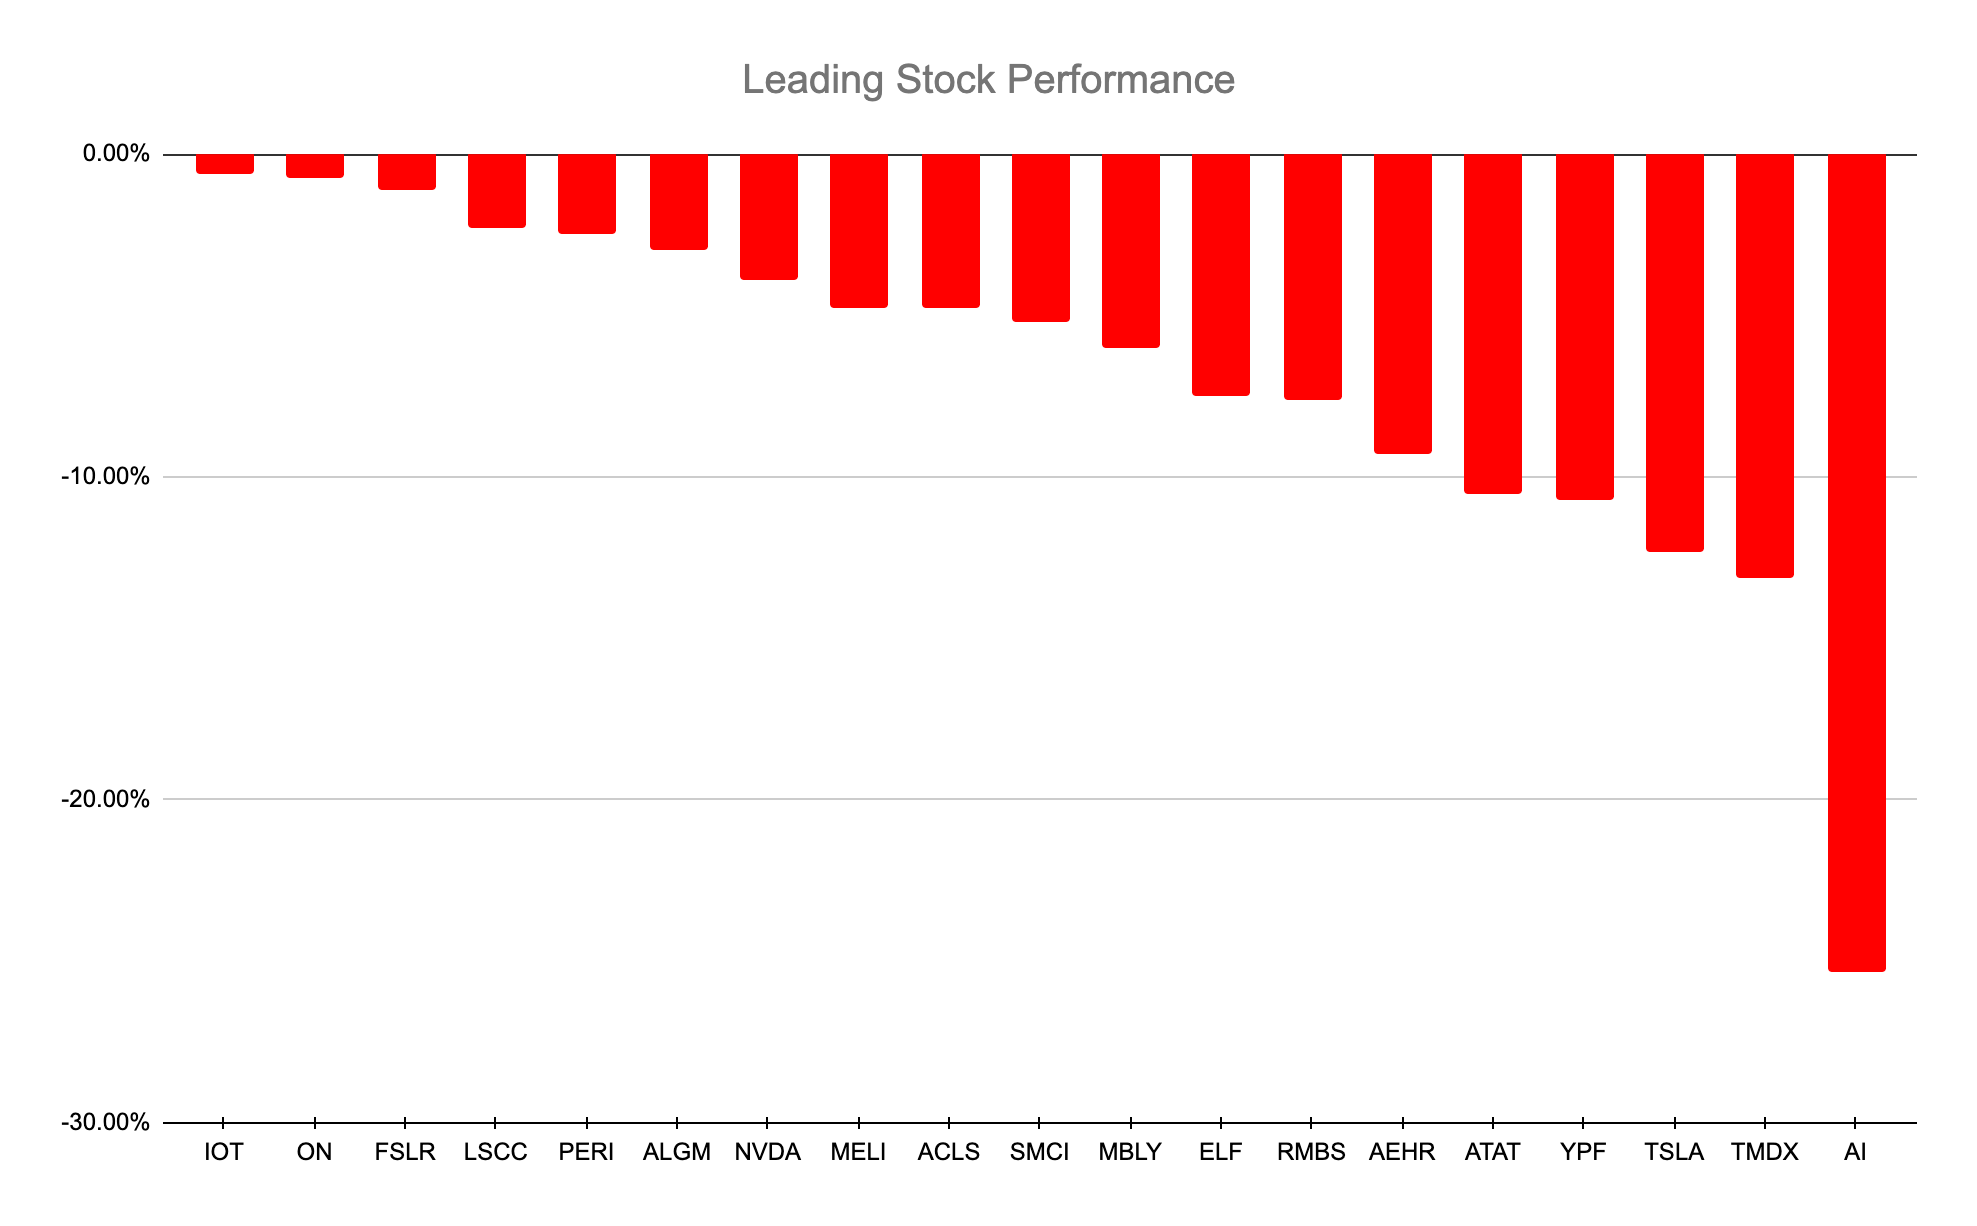
Leading Stocks Analysis
Session:

At the start of this week, things were looking positive as we were coming off a good week for individual stocks, however, that quickly turned around as distribution took over with failed breakouts showing up all over the place. As Mark Minervini constantly states, the best indicator of market health are how the leaders are acting - a lack of follow through is an immediate red flag in my process and often indicates warning signs before the indexes have the time to show it.
Failed breakouts:
Relative strength:
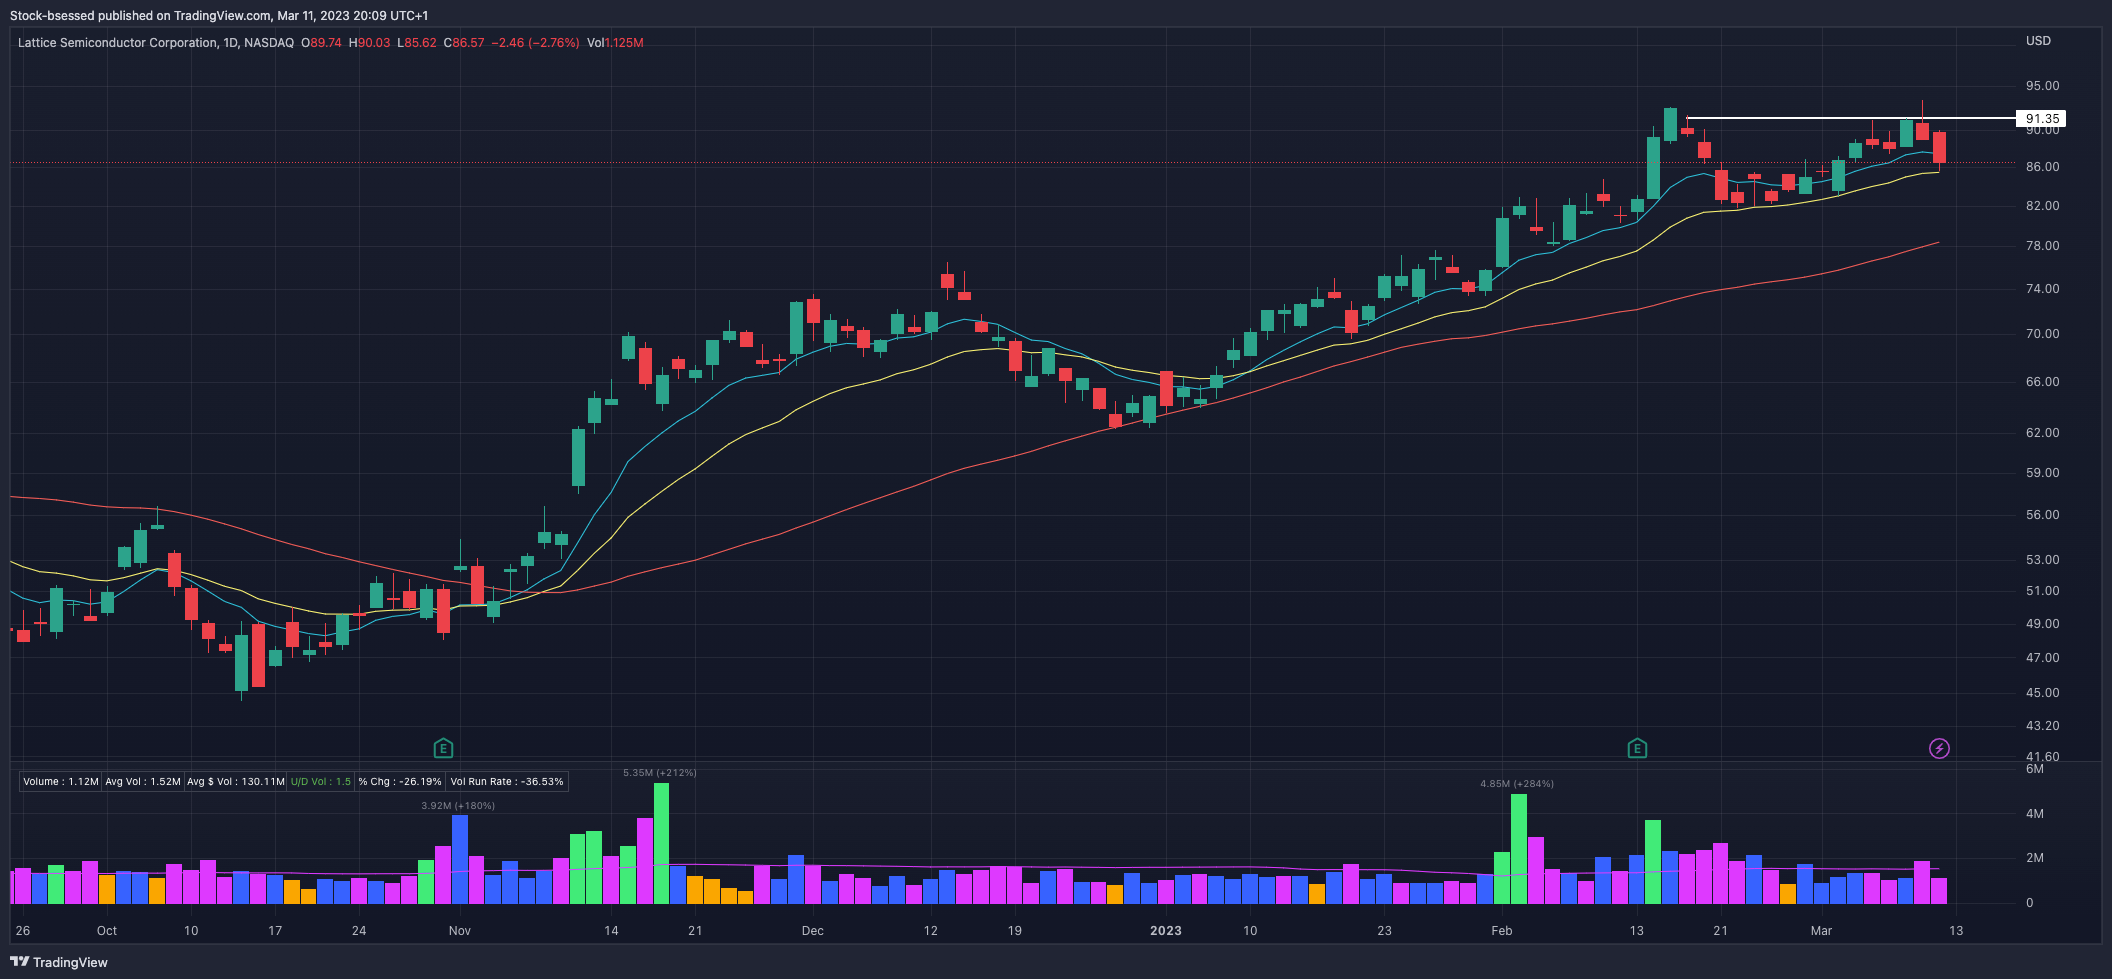
FSLR 0.00%↑ Gives little back after running +30% fuelled by earnings, flagging above short-term KMAs and showing relative strength up here. Watching this one closely but for an indication of market health as well as a potential entry:

Week:
I am linking the leaders watchlist in tradingview for your convenience, here
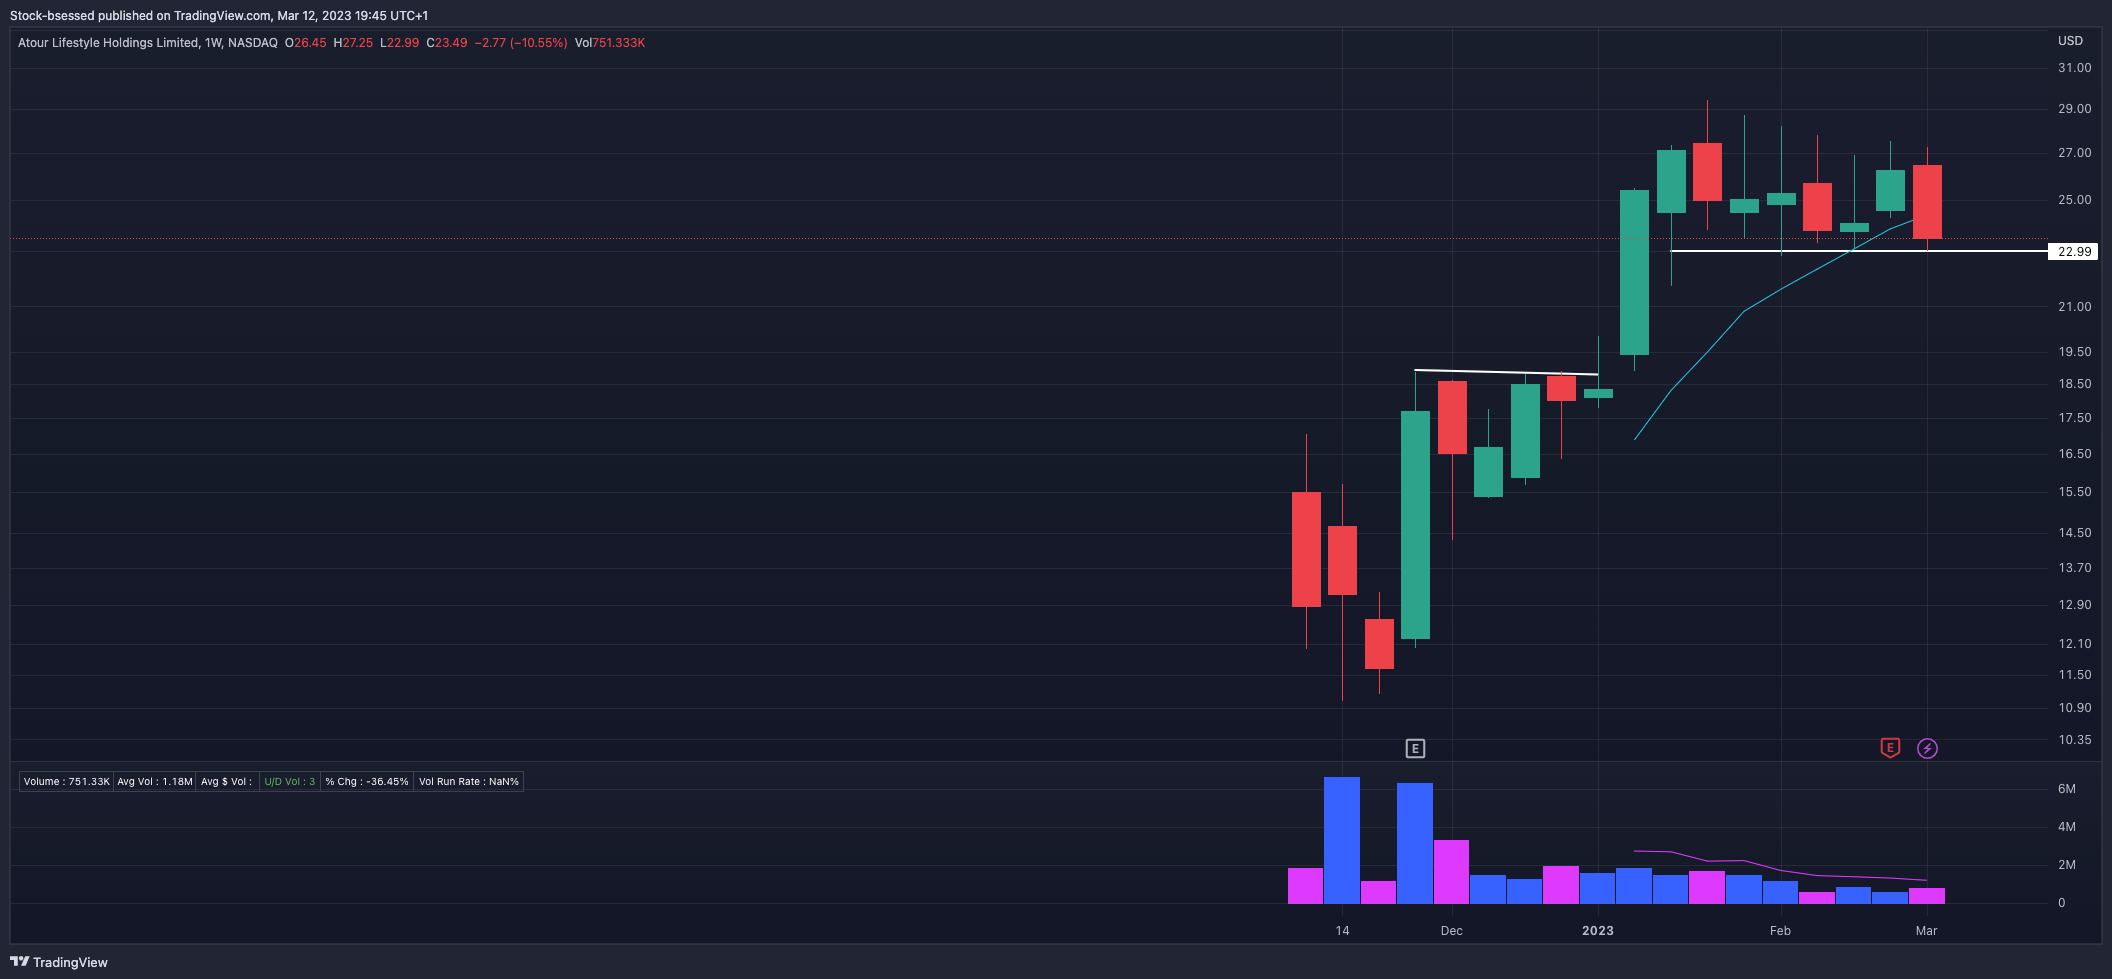
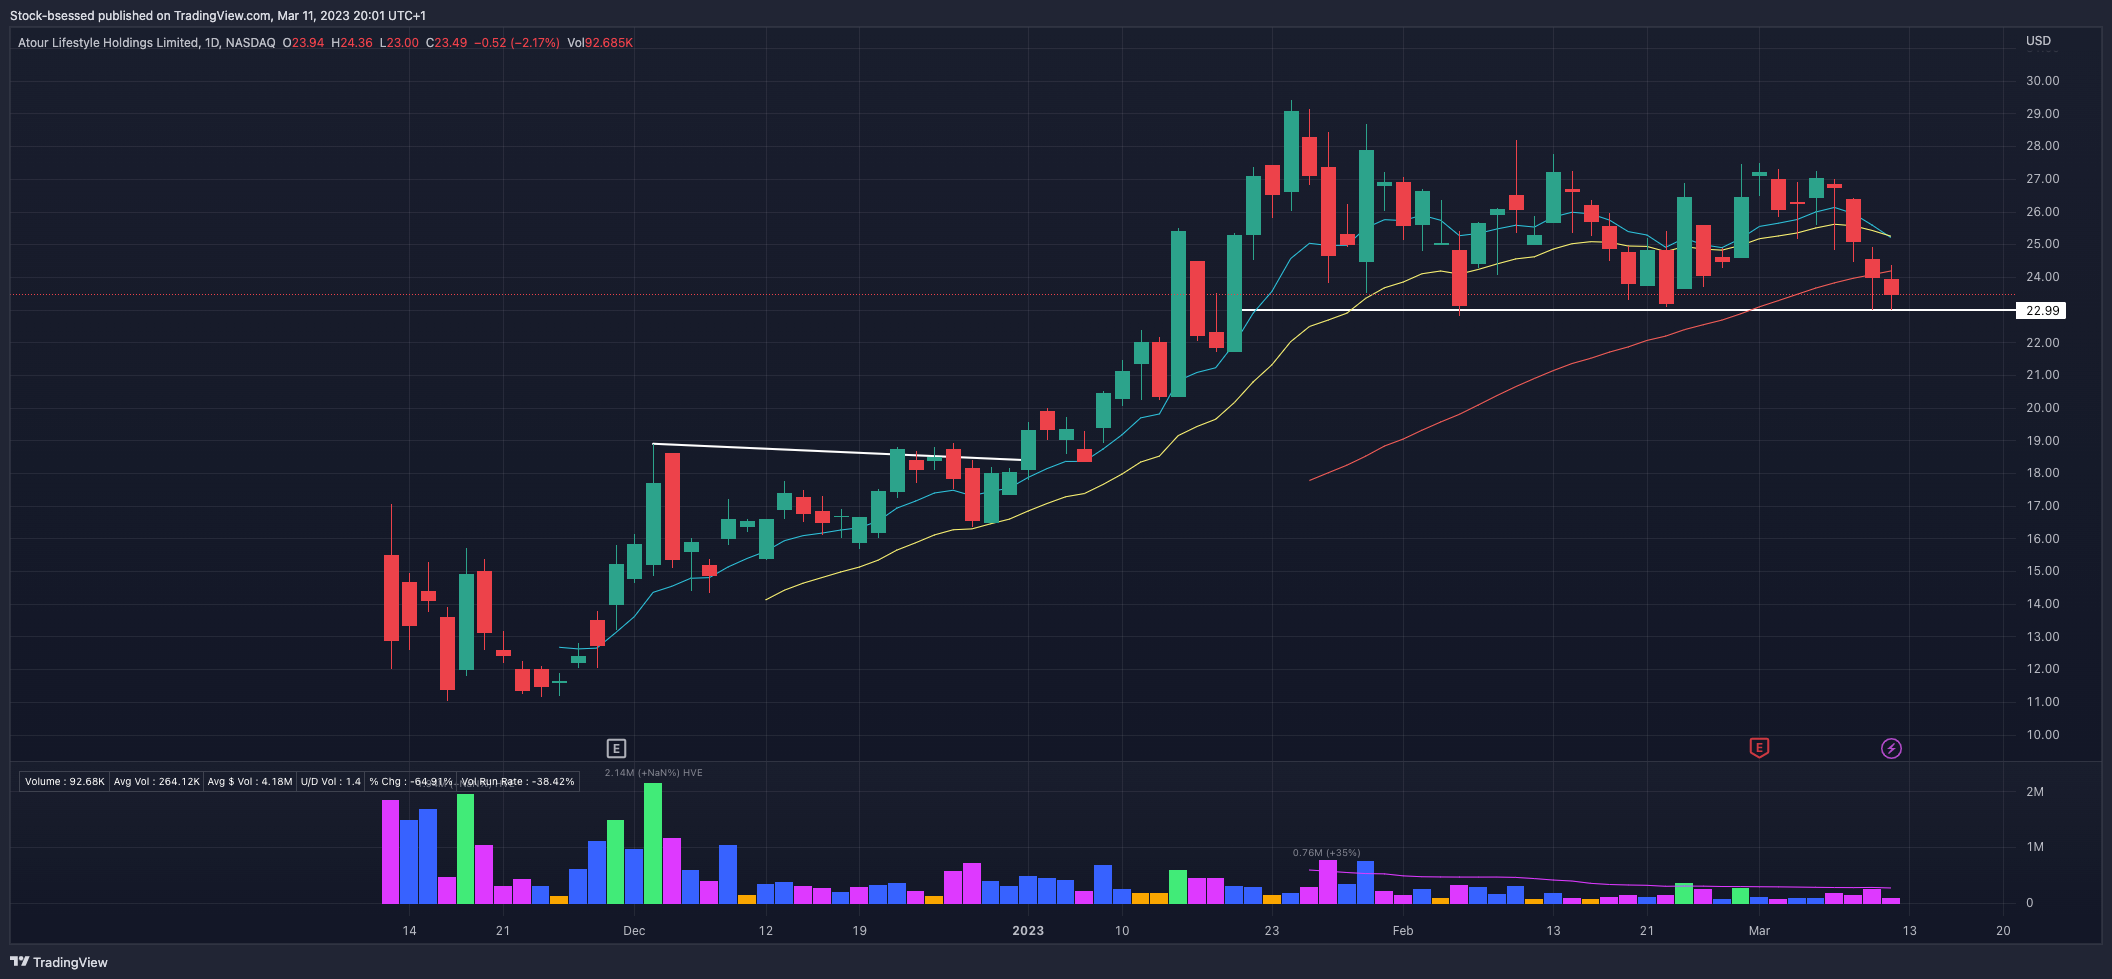
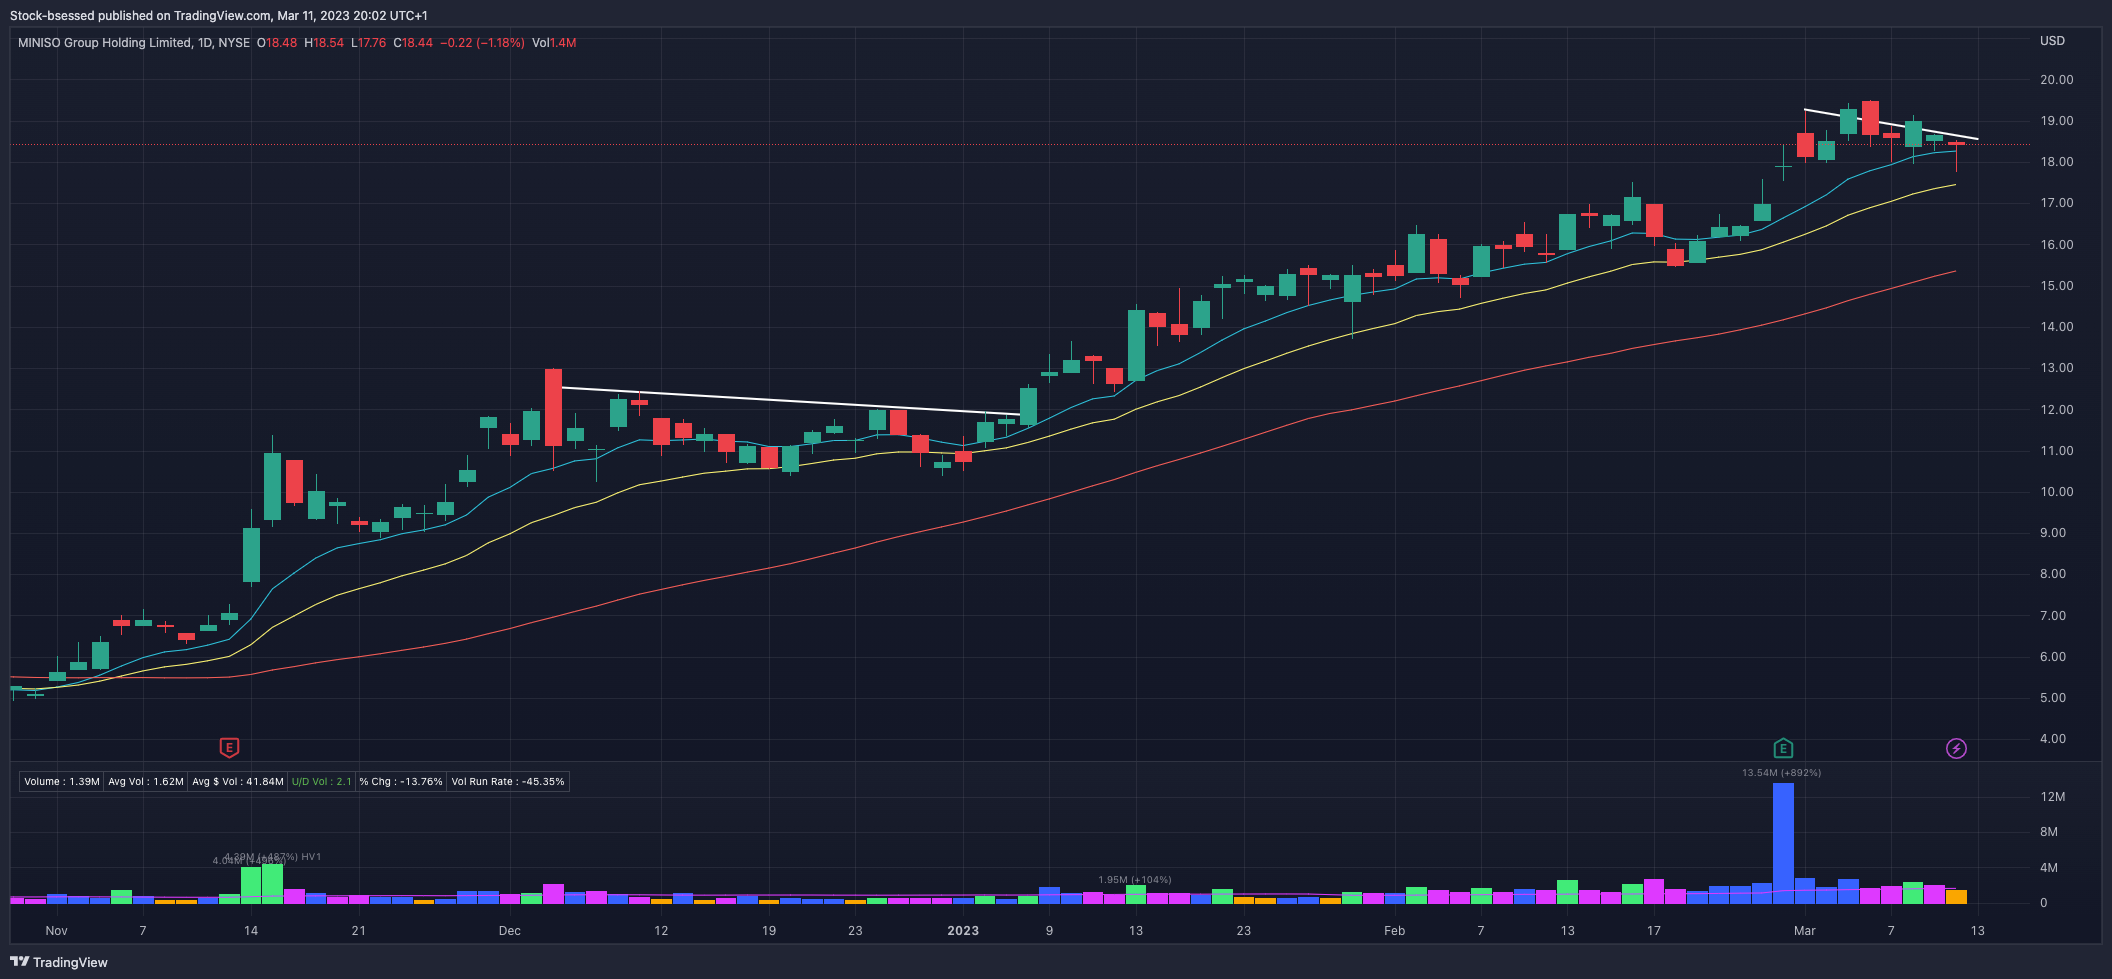
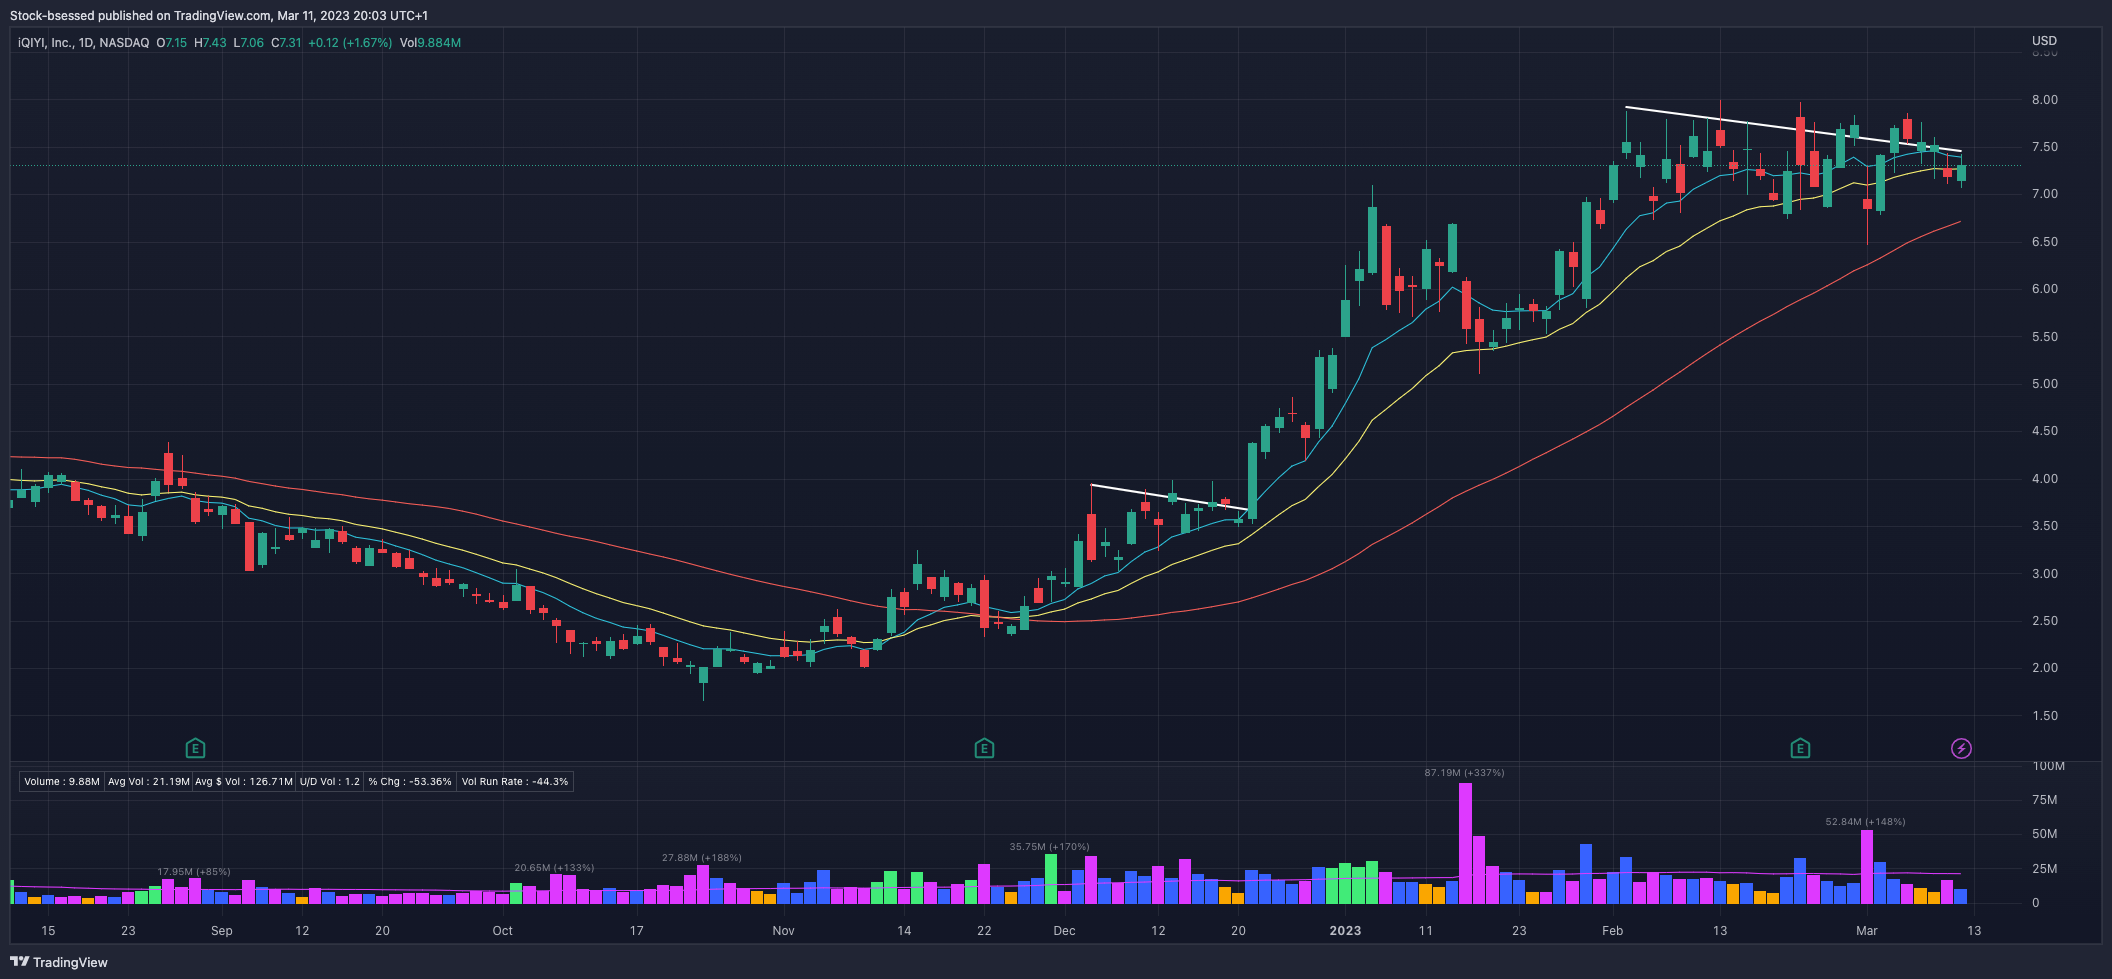
ATAT 0.00%↑ At a key area on the weekly:
MBLY 0.00%↑ Some wild action with wide-ranges but on the weekly continues to trend above the 10WMA

AI 0.00%↑ Stalls out at a previous area of note on the weekly chart and gets hit hard. Still above the 10WMA and this short but wide base on the weekly:

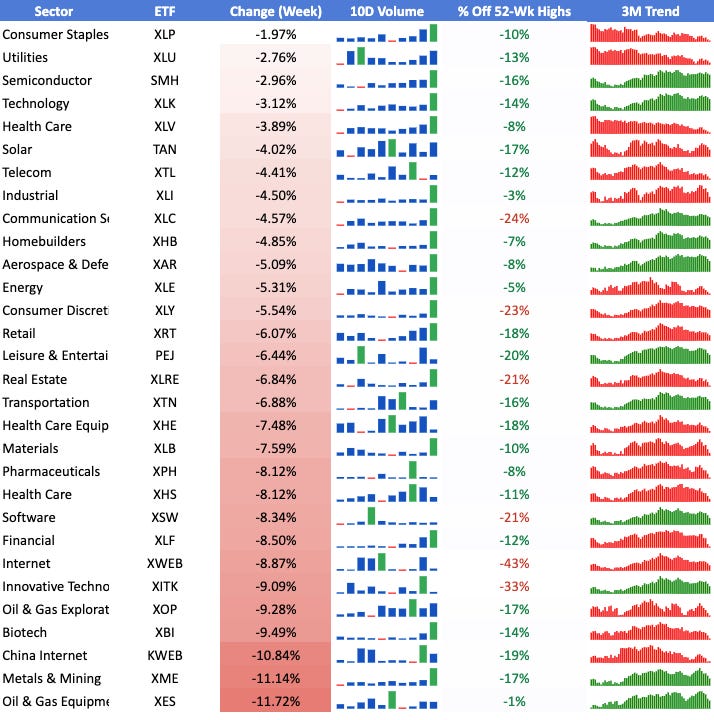
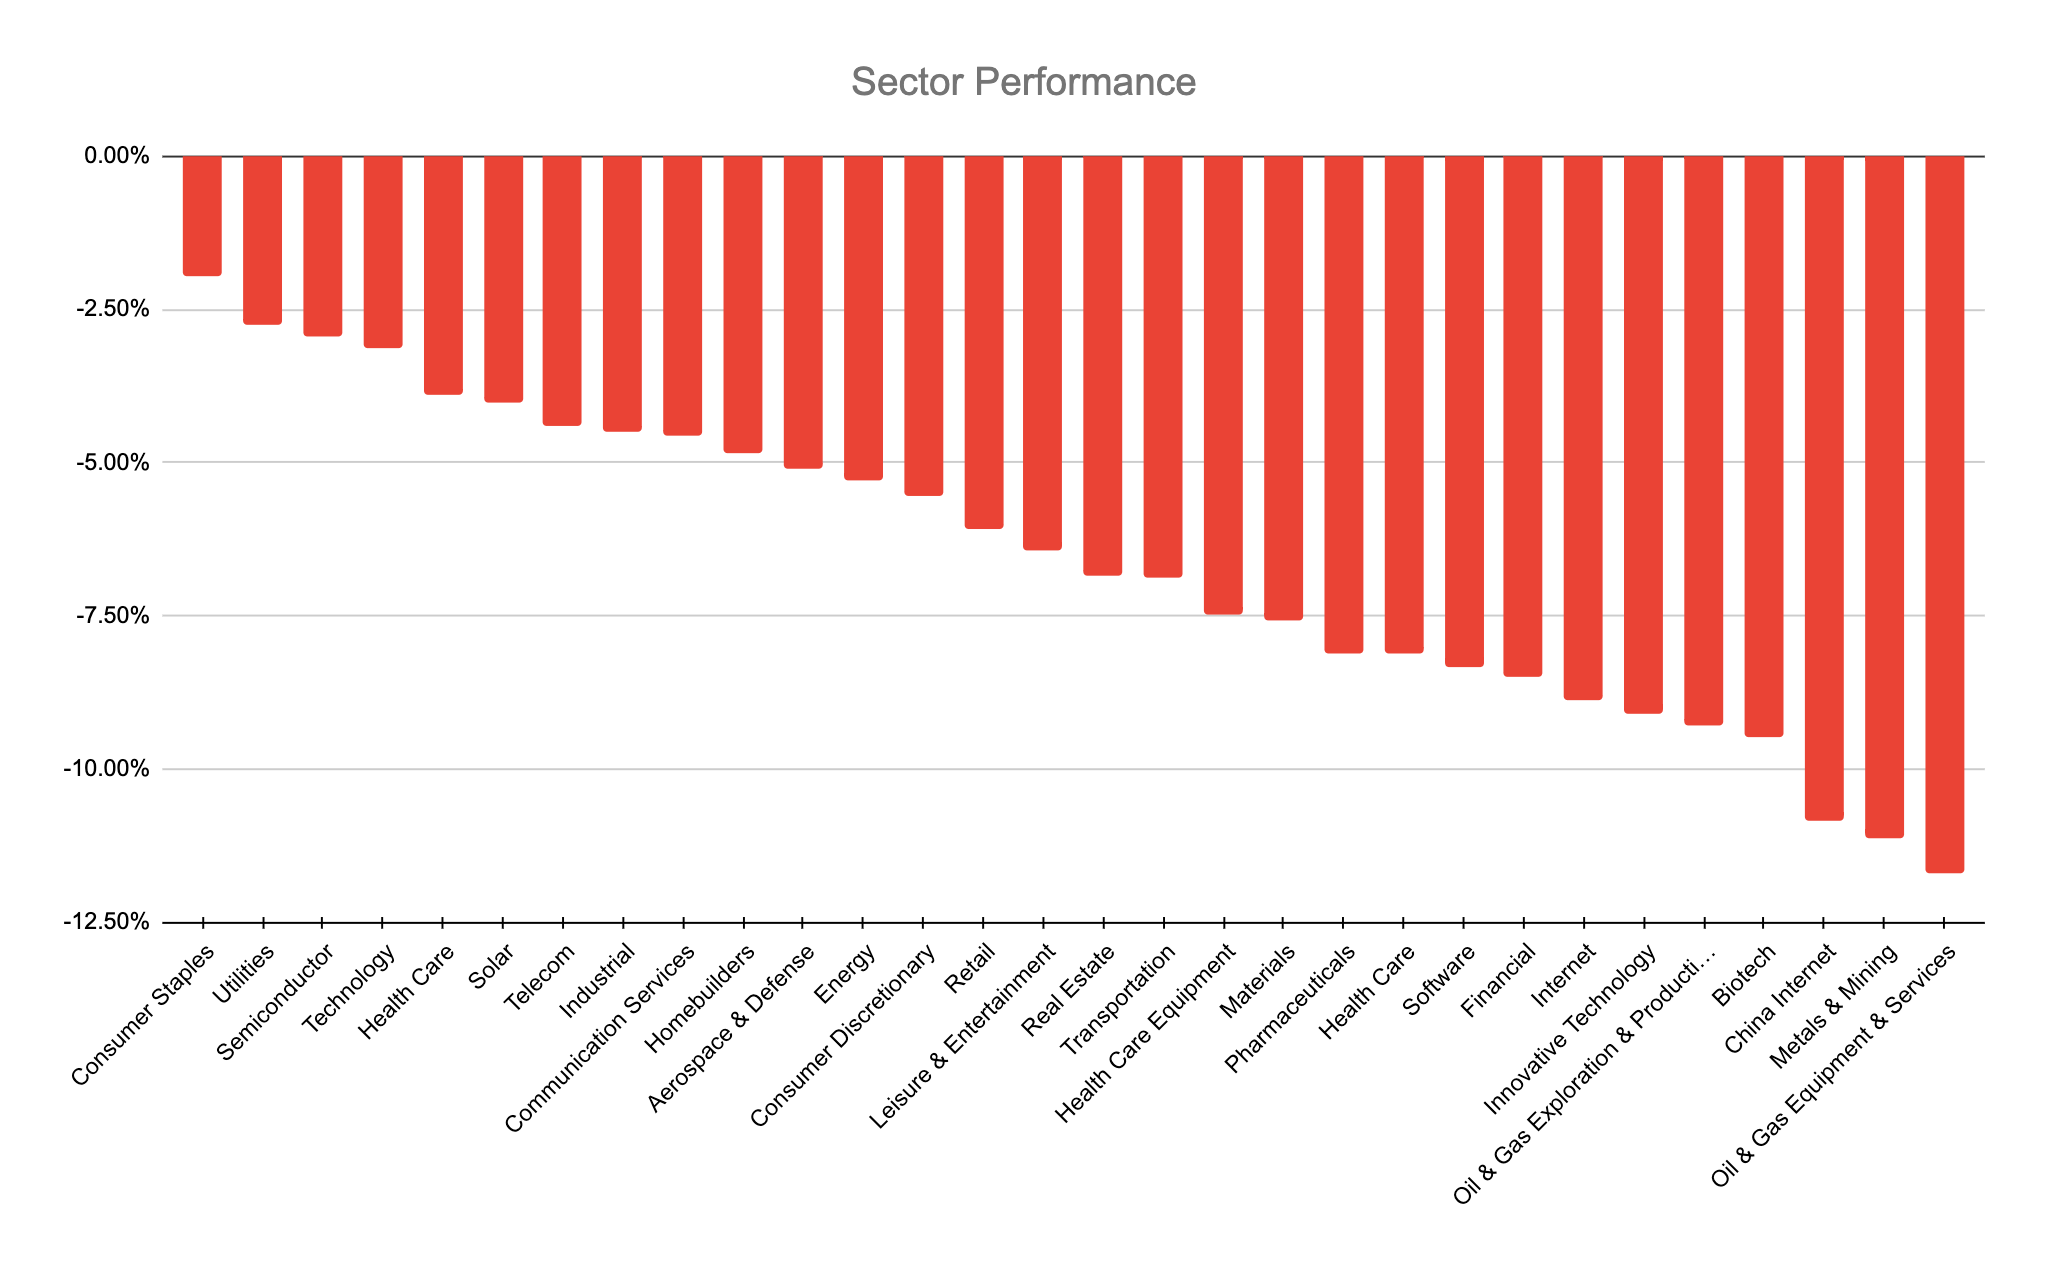
Individual Industry Analysis
Session:

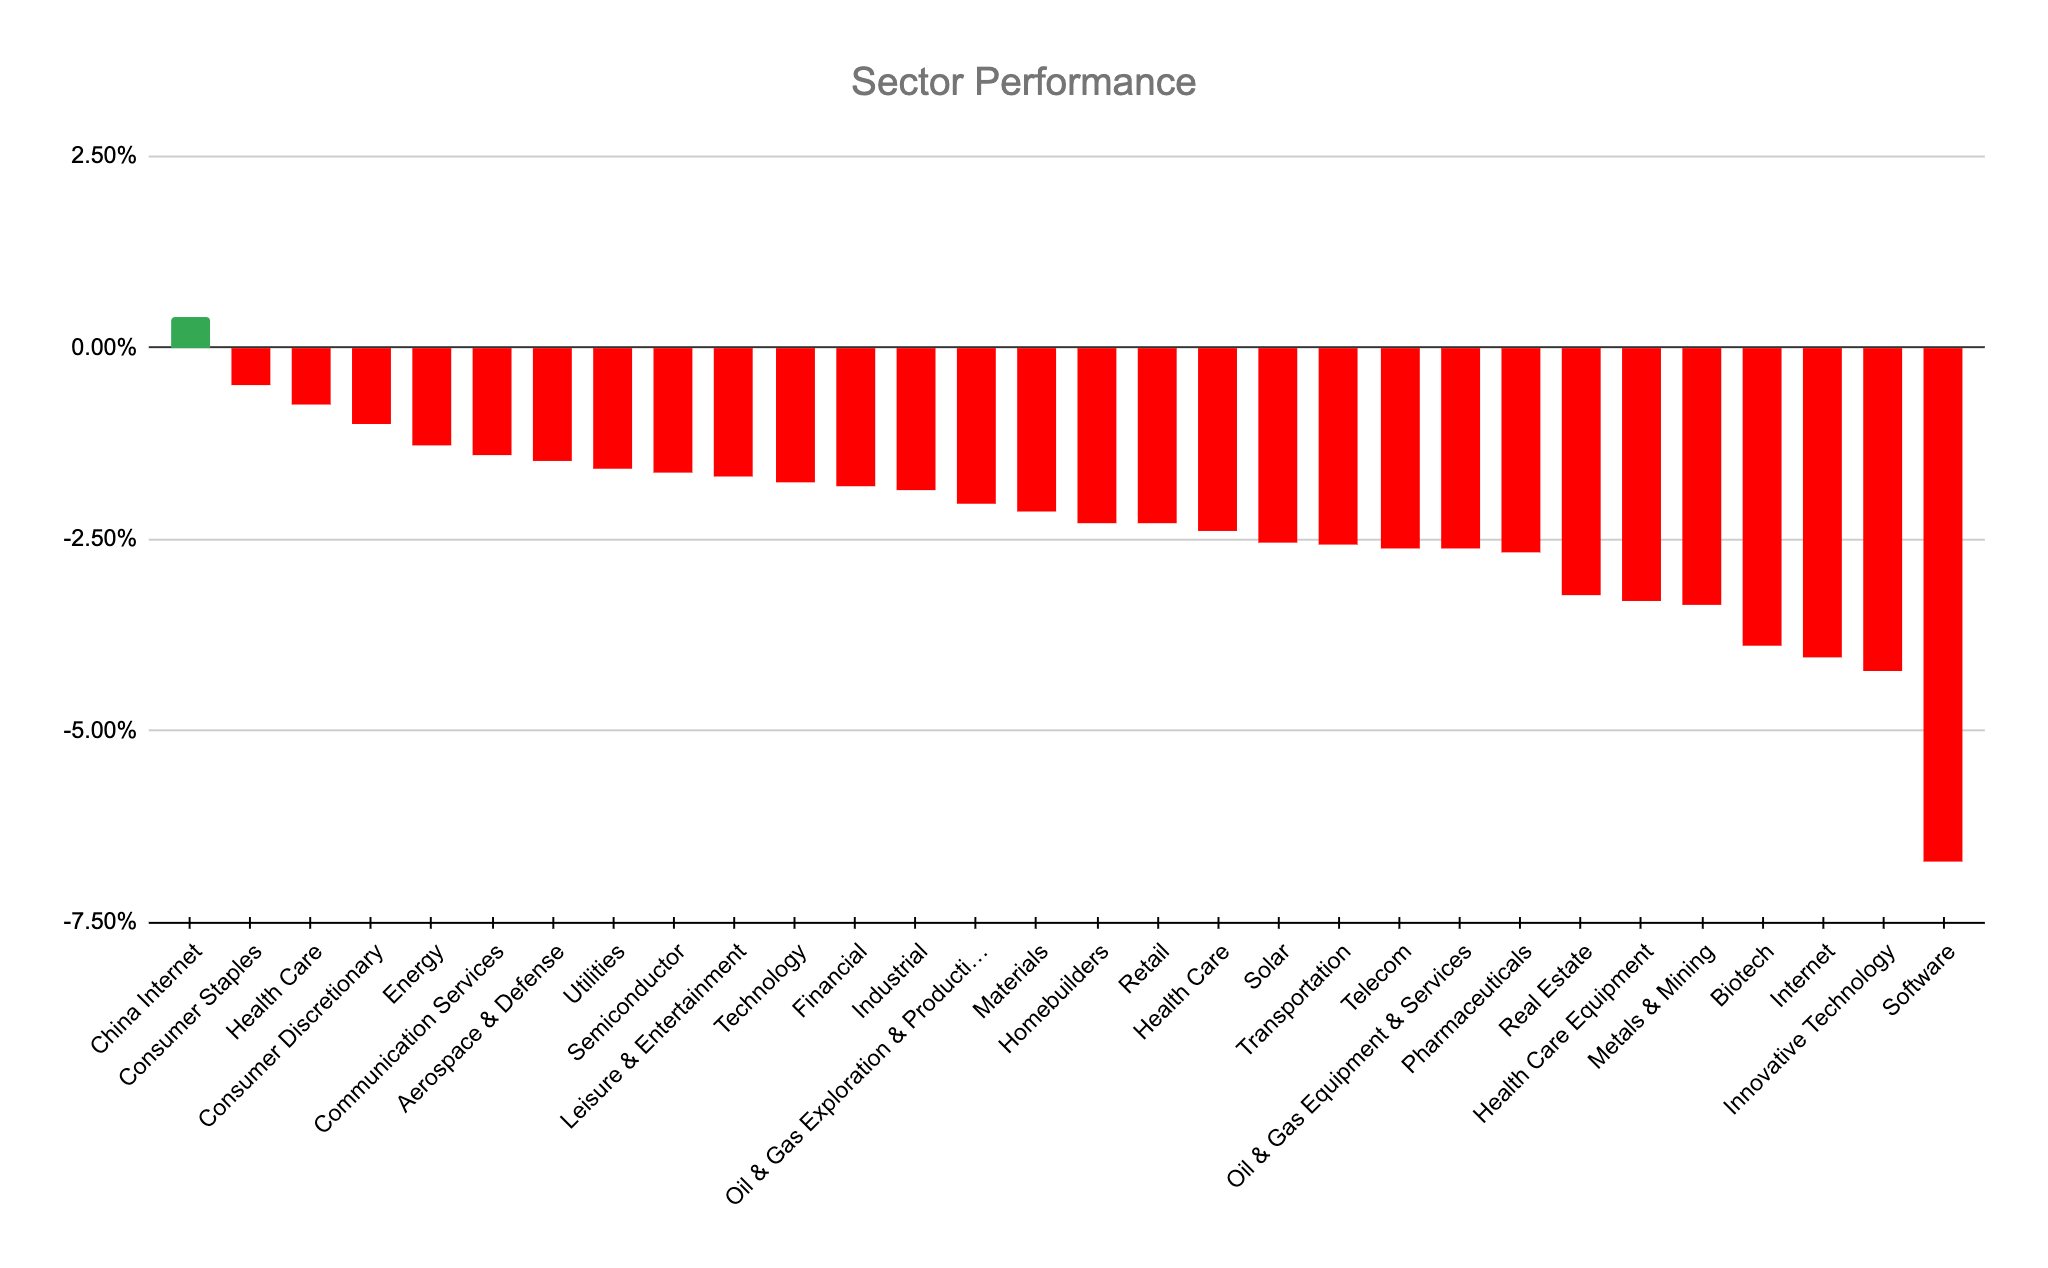
I am linking the sectors watchlist in tradingview for your convenience, here
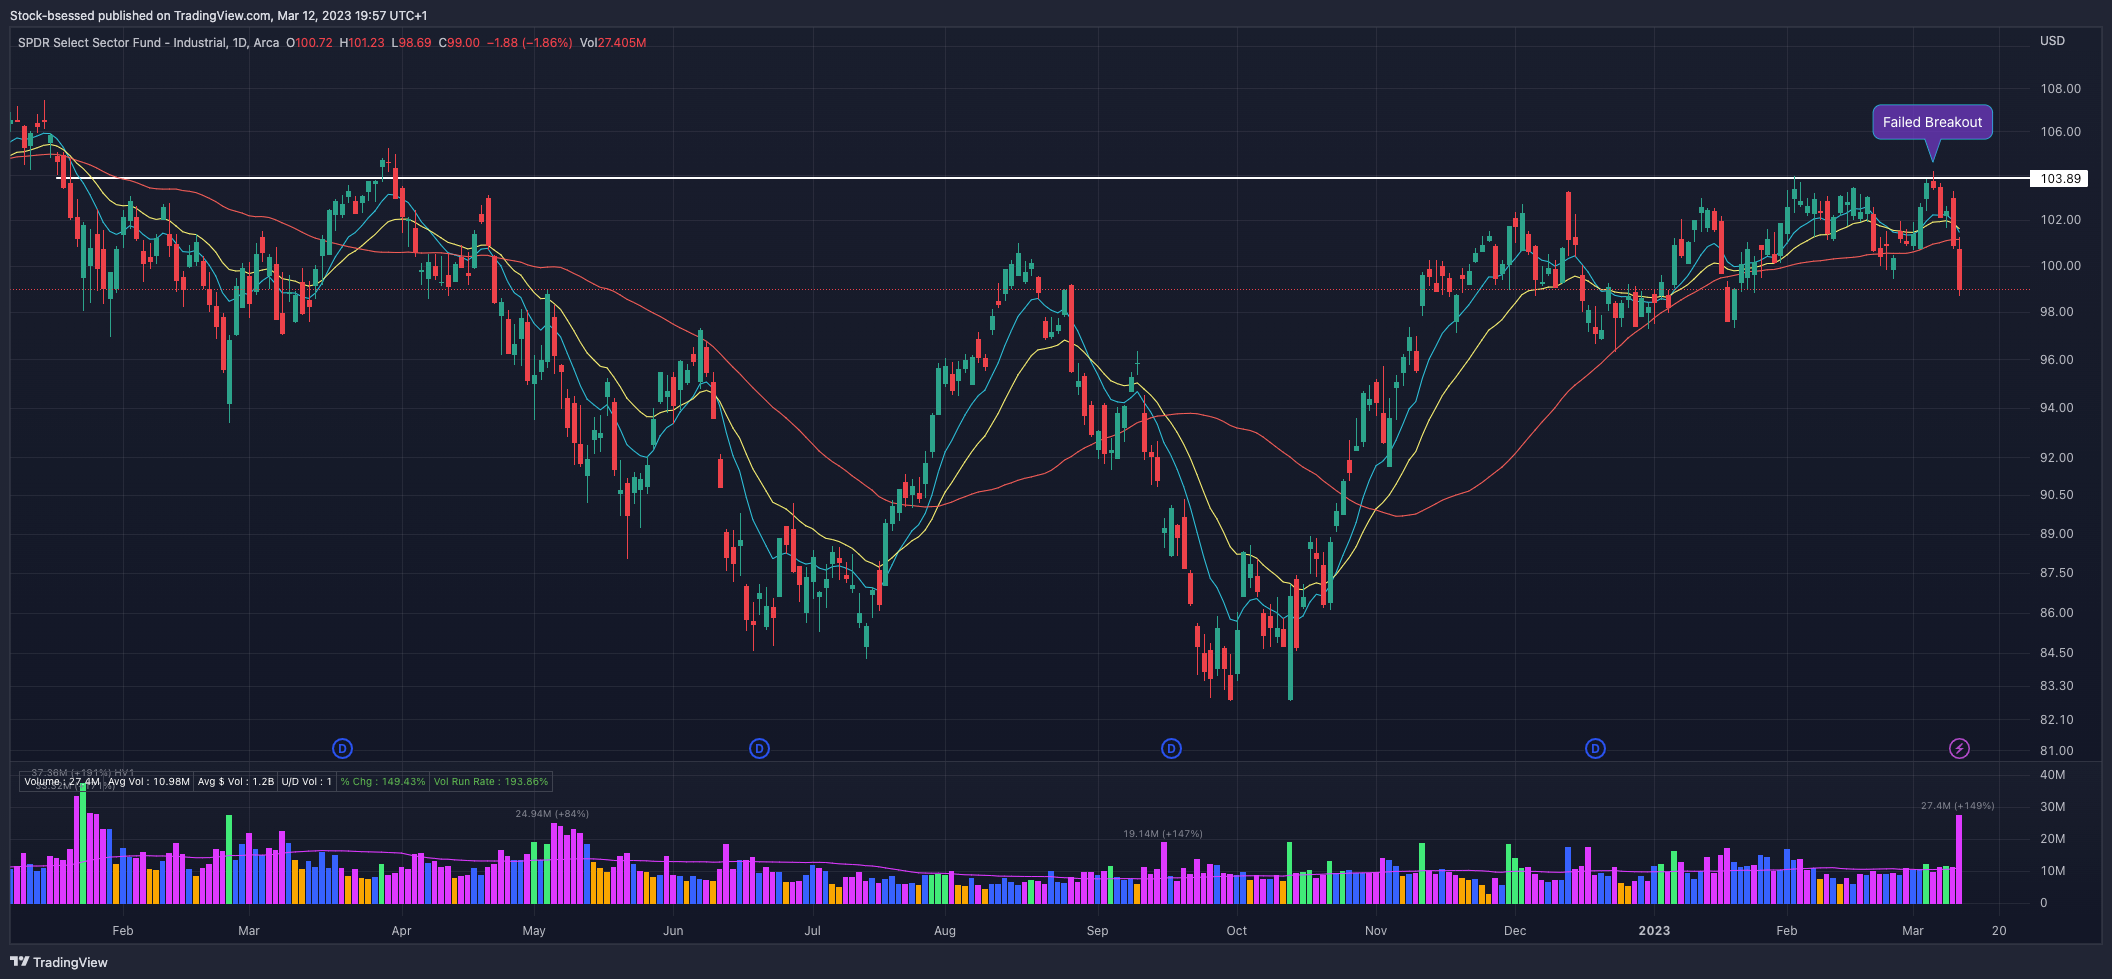
XLI 0.00%↑ Industrials with a crystal clear failed breakout:

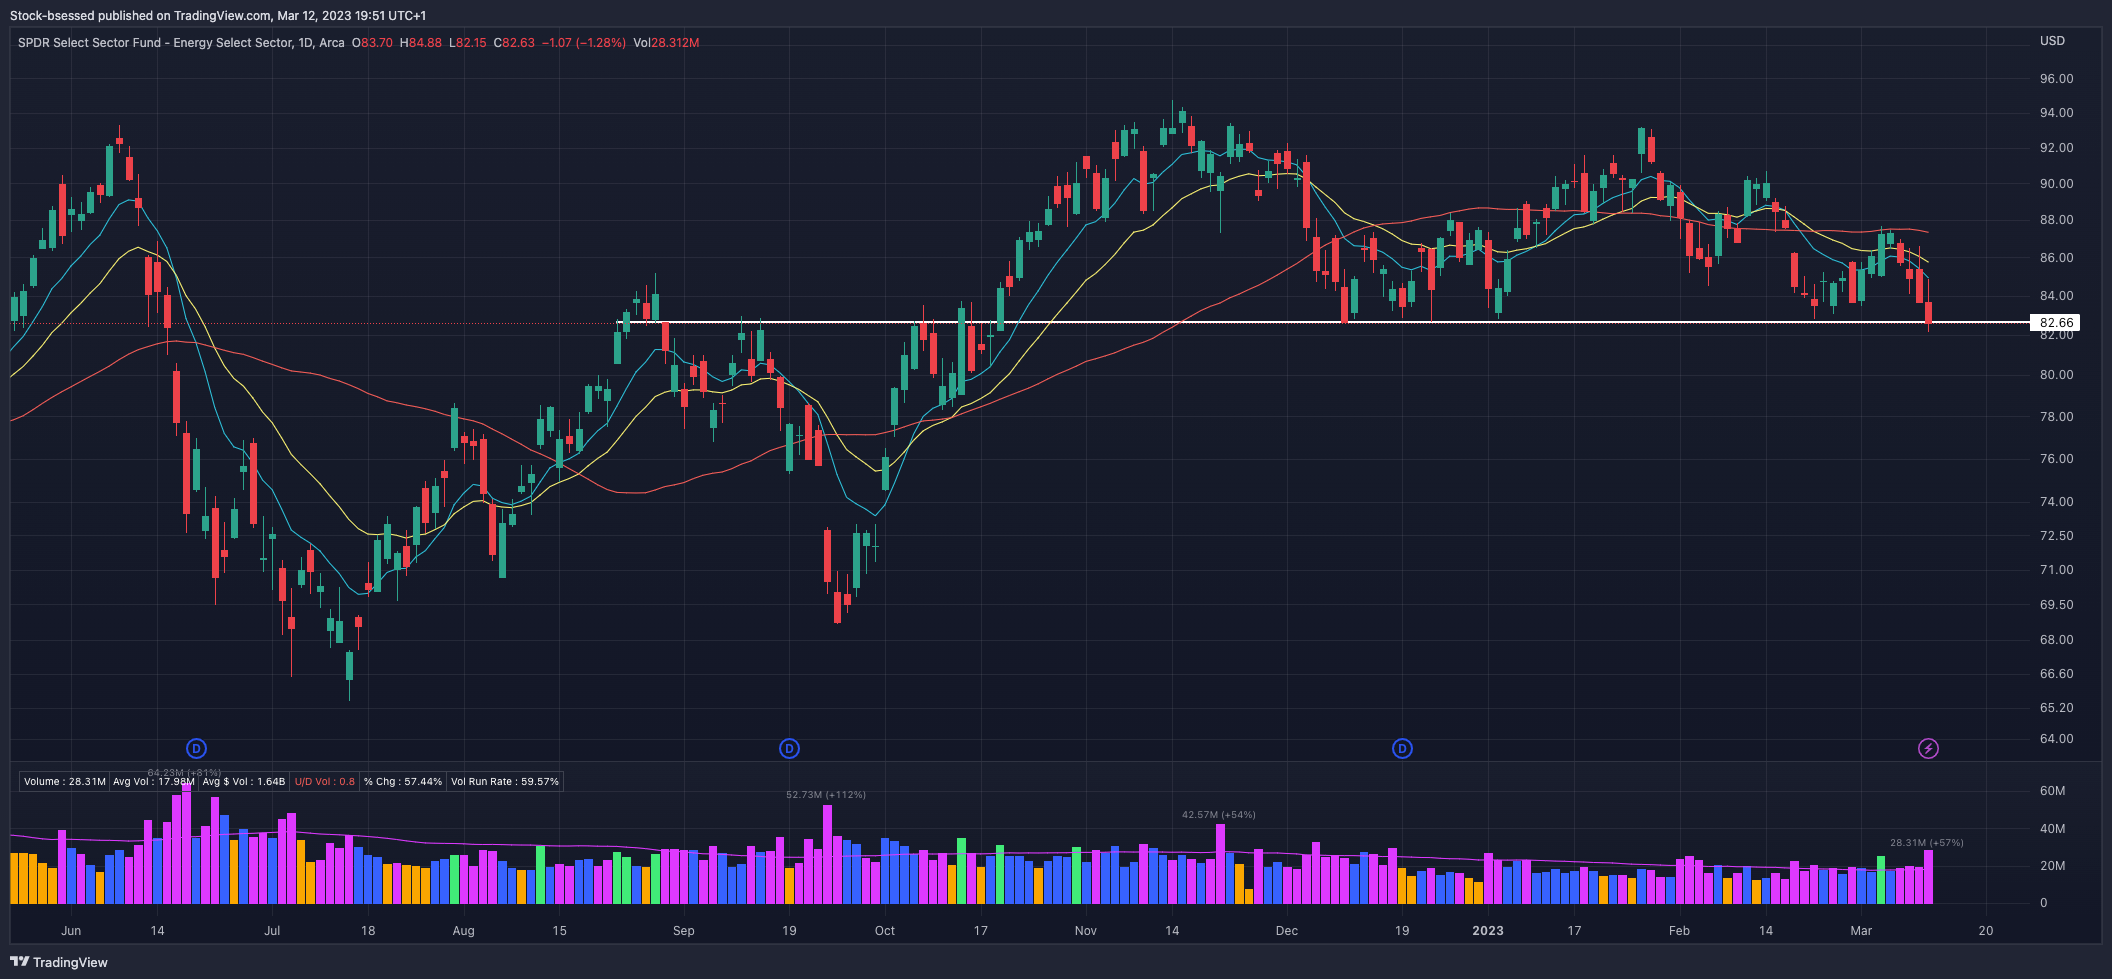
XLE 0.00%↑ At a key area as it retests the previous base pivot and an area of proven support, losing last session's low may indicate further weakness ahead:
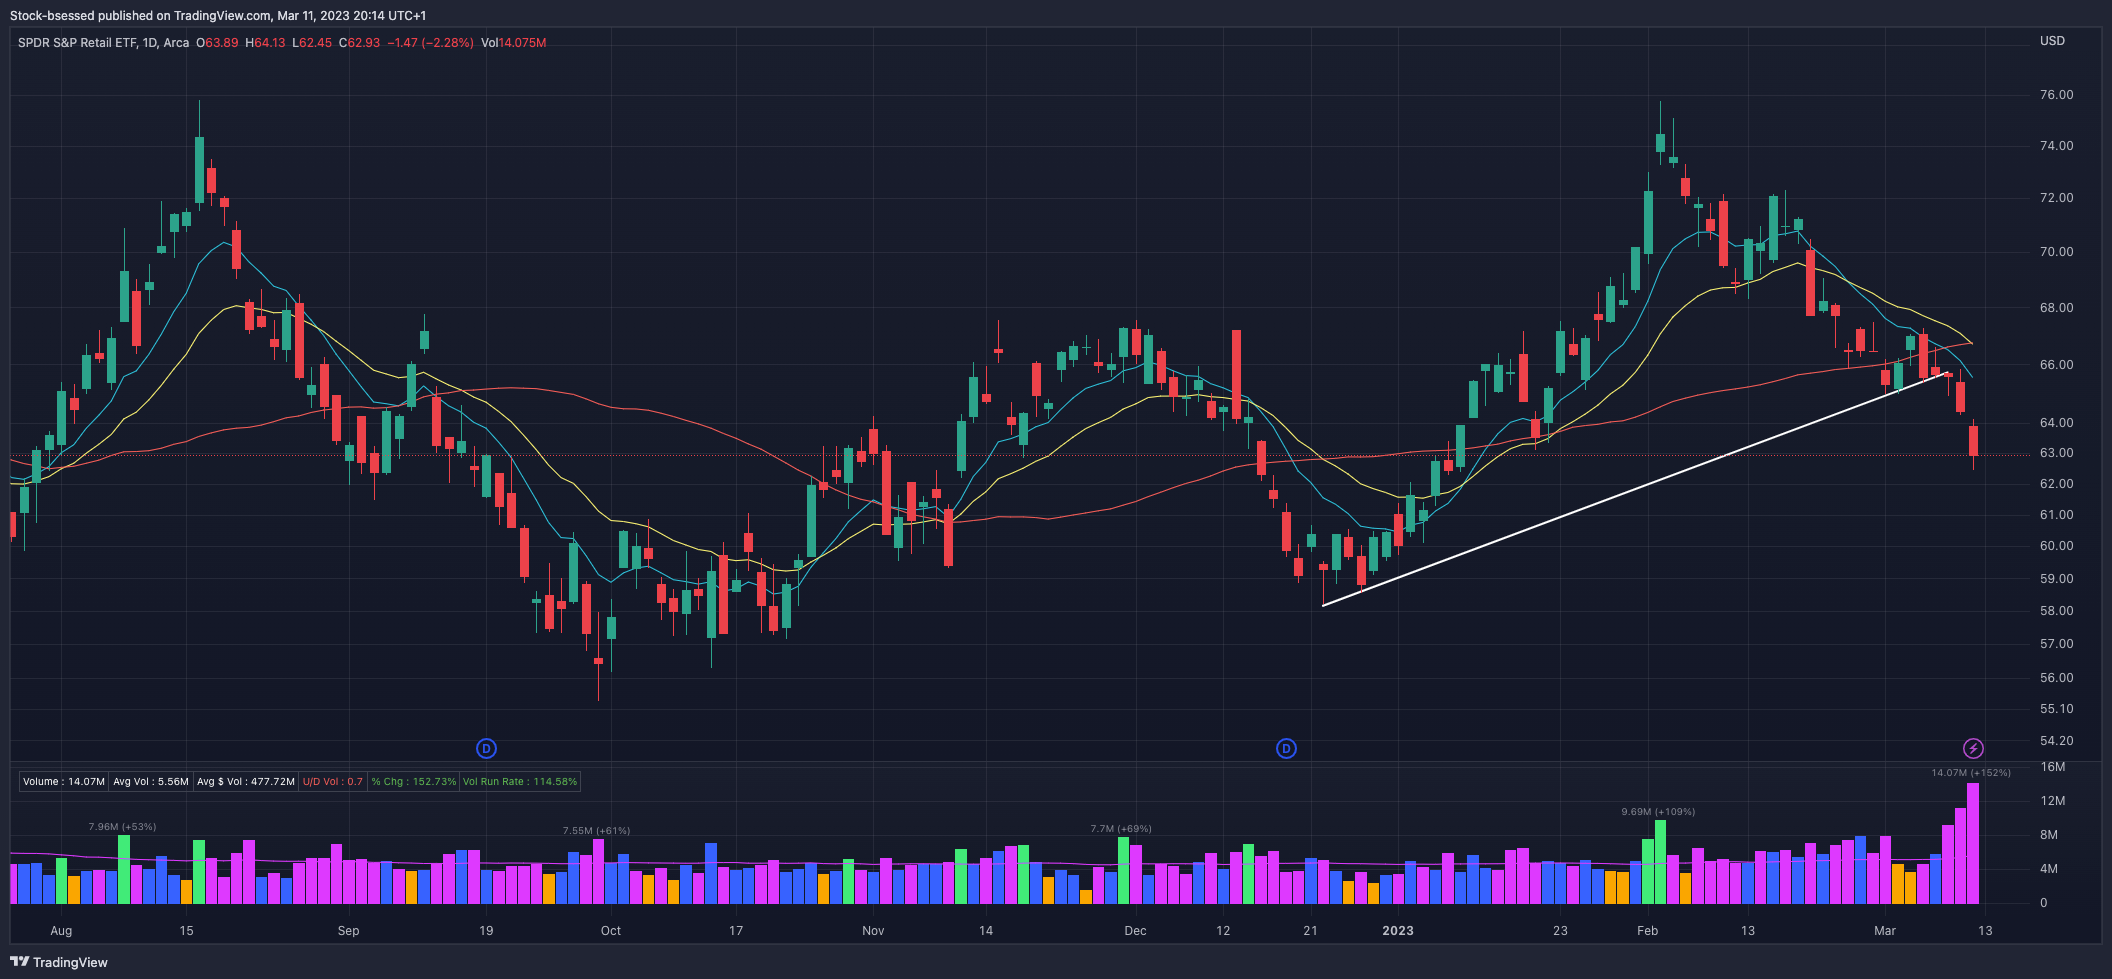
XRT 0.00%↑ Follows through on this trend line break that I highlighted recently and saw further selling from there:
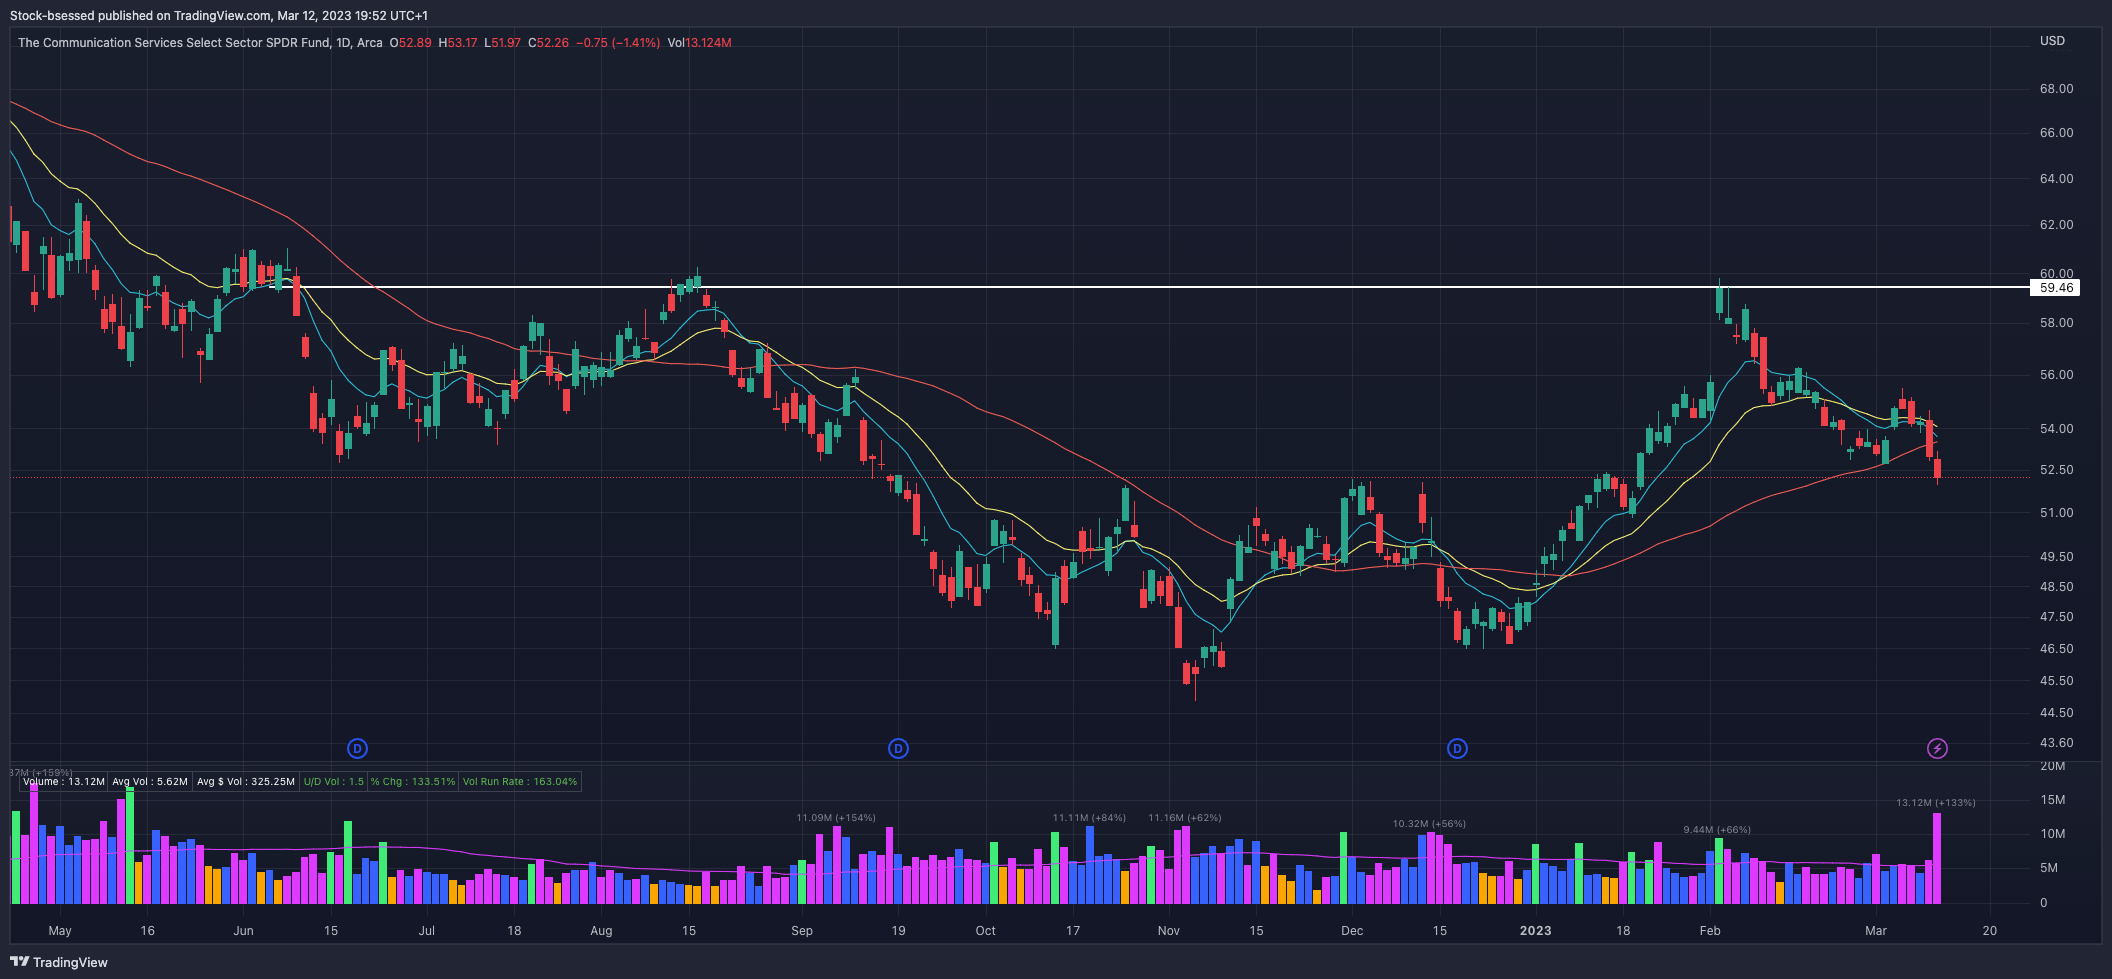
XLC 0.00%↑ Was showing strength but has pulled back hard since struggling with prior resistance:
XAR 0.00%↑ Had been showing clear relative strength as of late but was only a matter of time until the overall market weakness caught up:

Week:
SMH 0.00%↑ Quite choppy on the daily but the weekly shows a nicely trending pattern as it holds above the 10WMA:

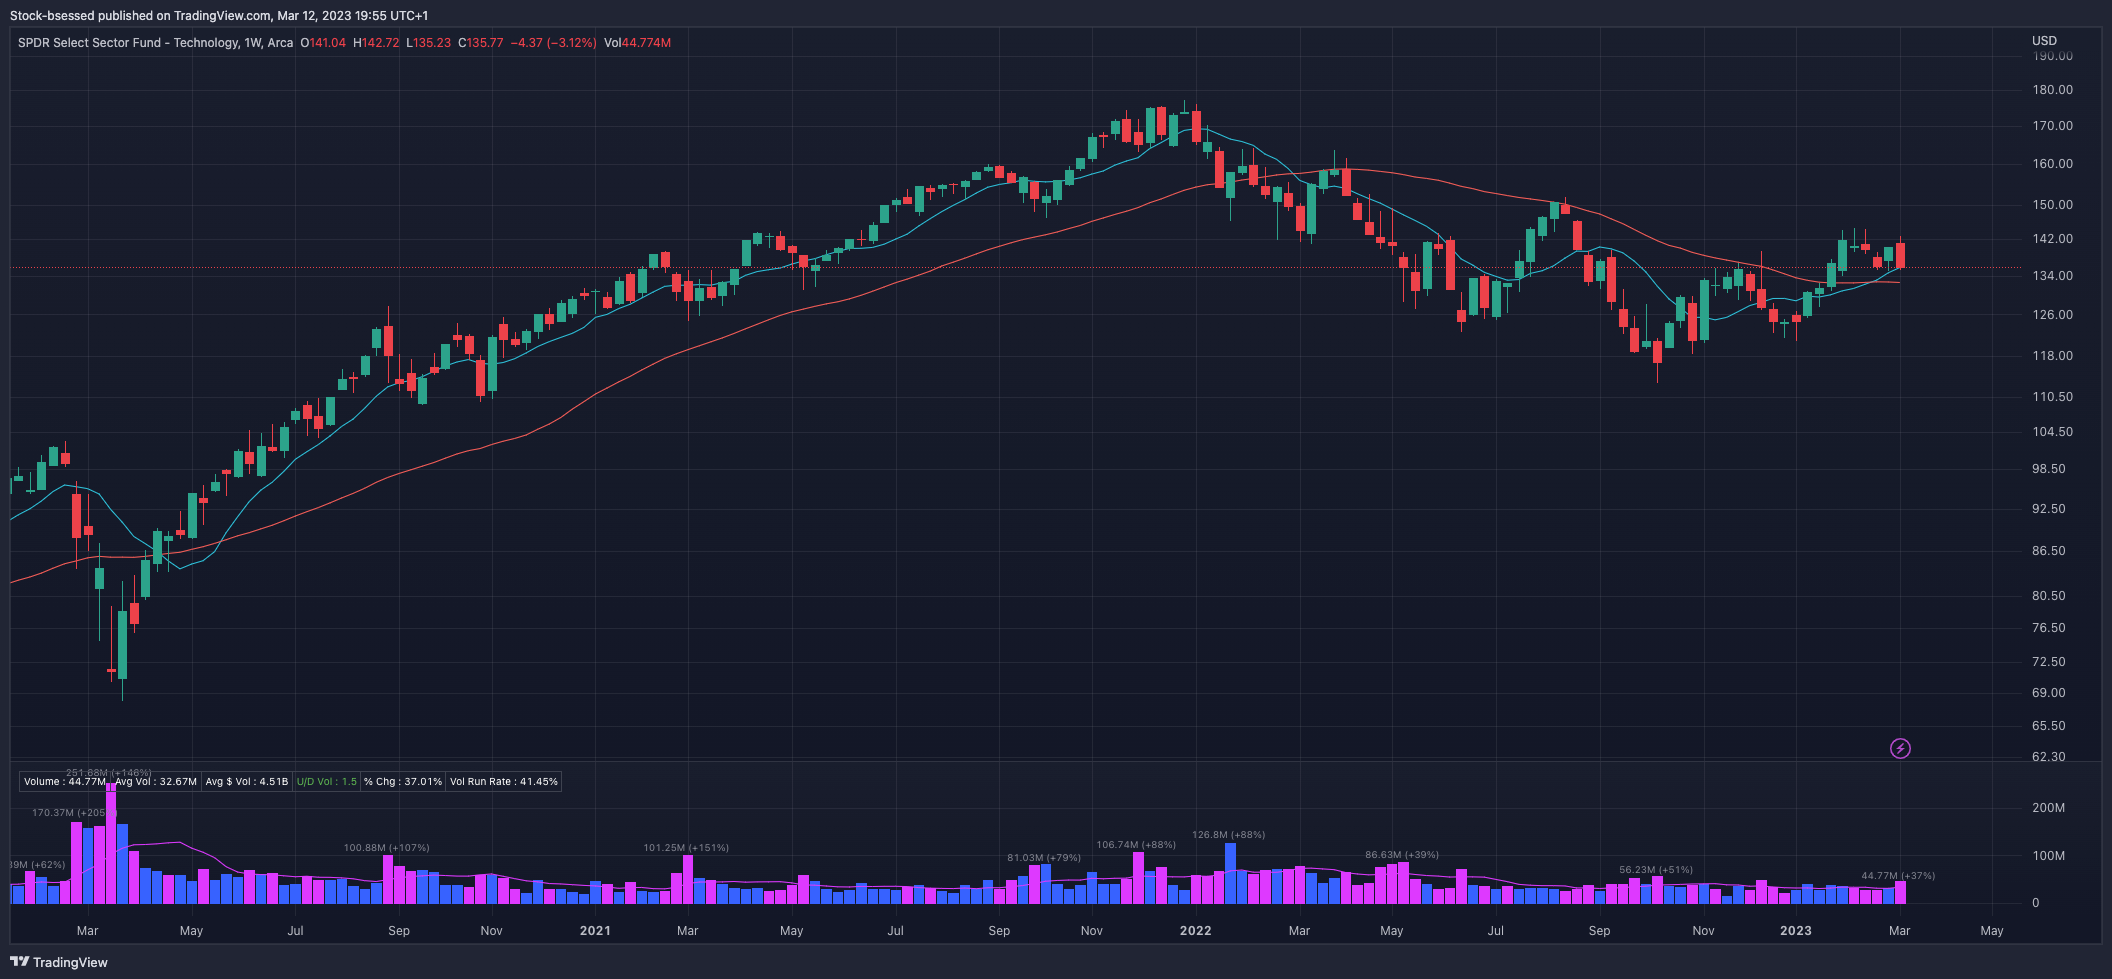
XLK 0.00%↑ Technology right at the 10WMA and will be watching to see how it reacts to this level on any further weakness:
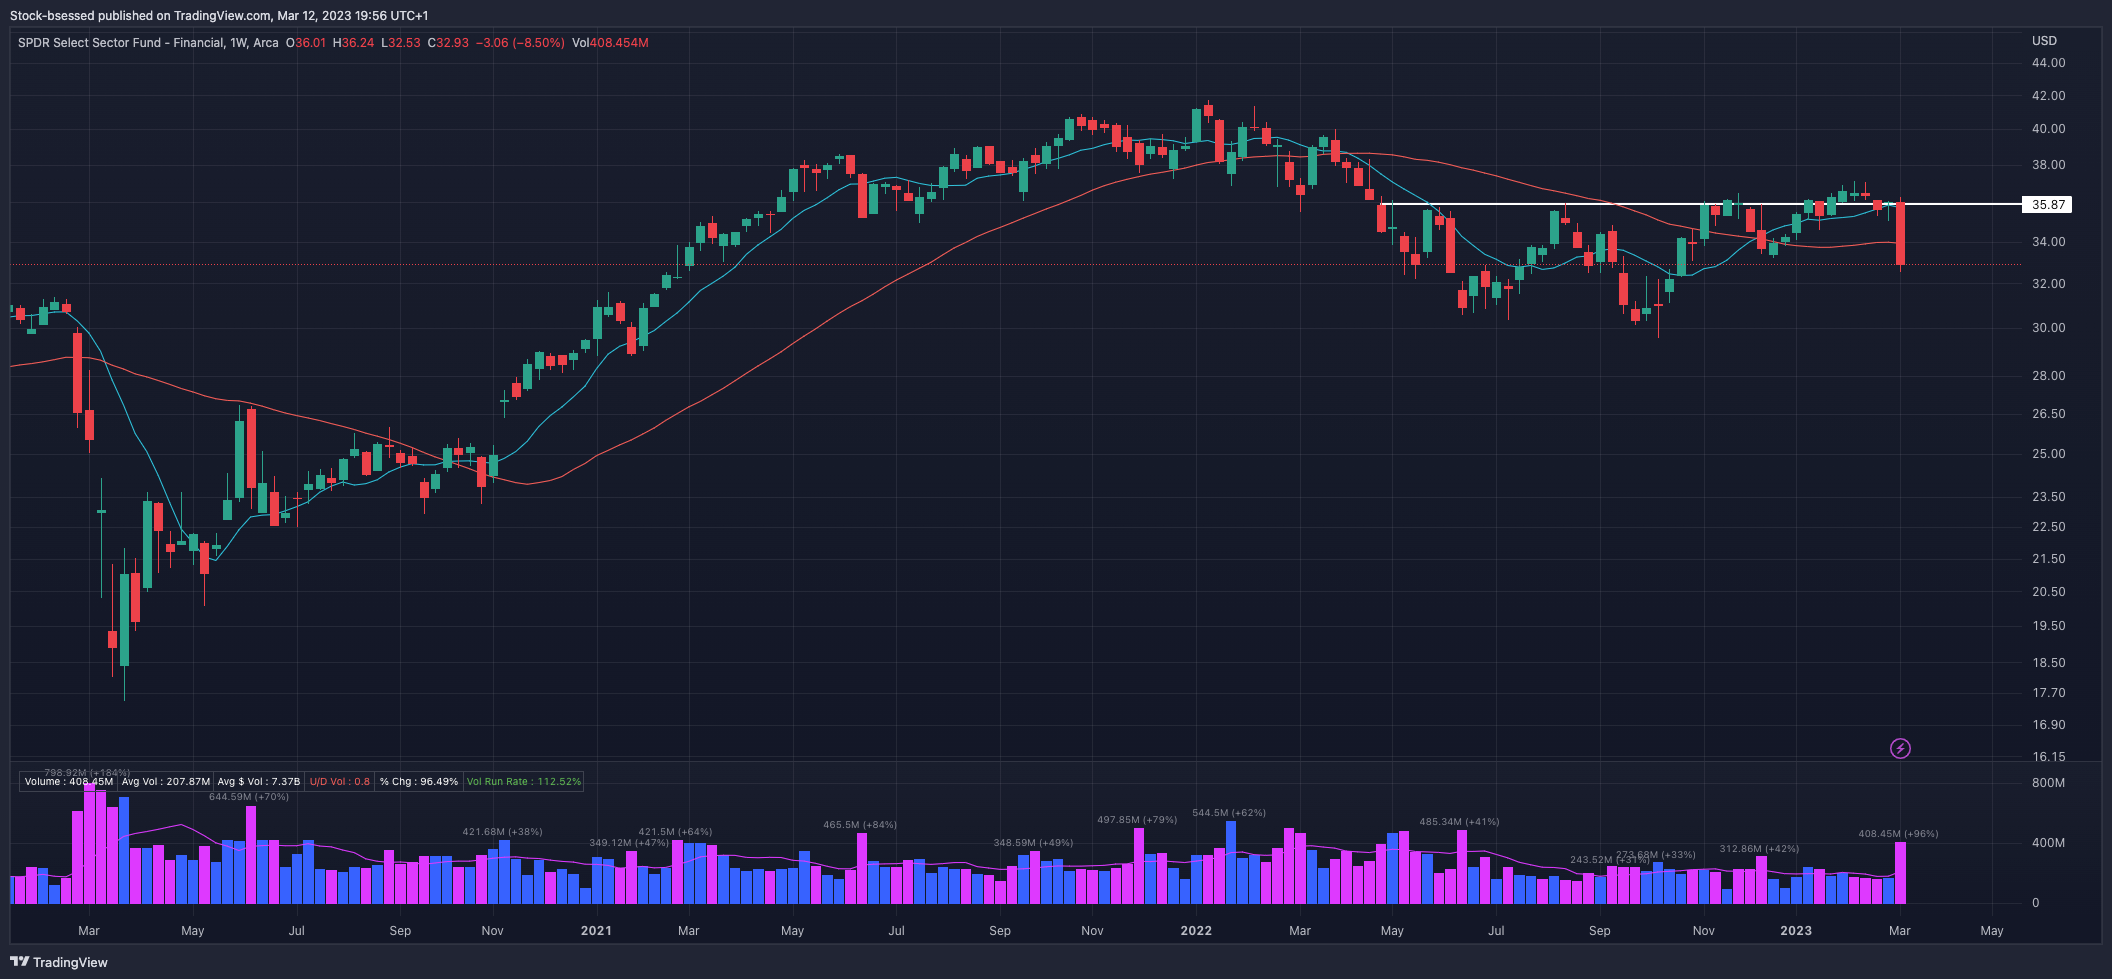
XLF 0.00%↑ Financials took a big hit this week on the whole SIVB 0.00%↑ situation:
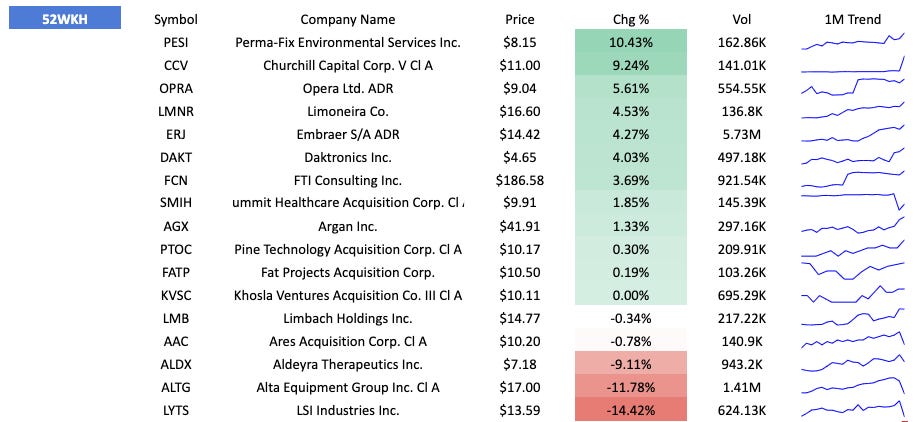
Scans
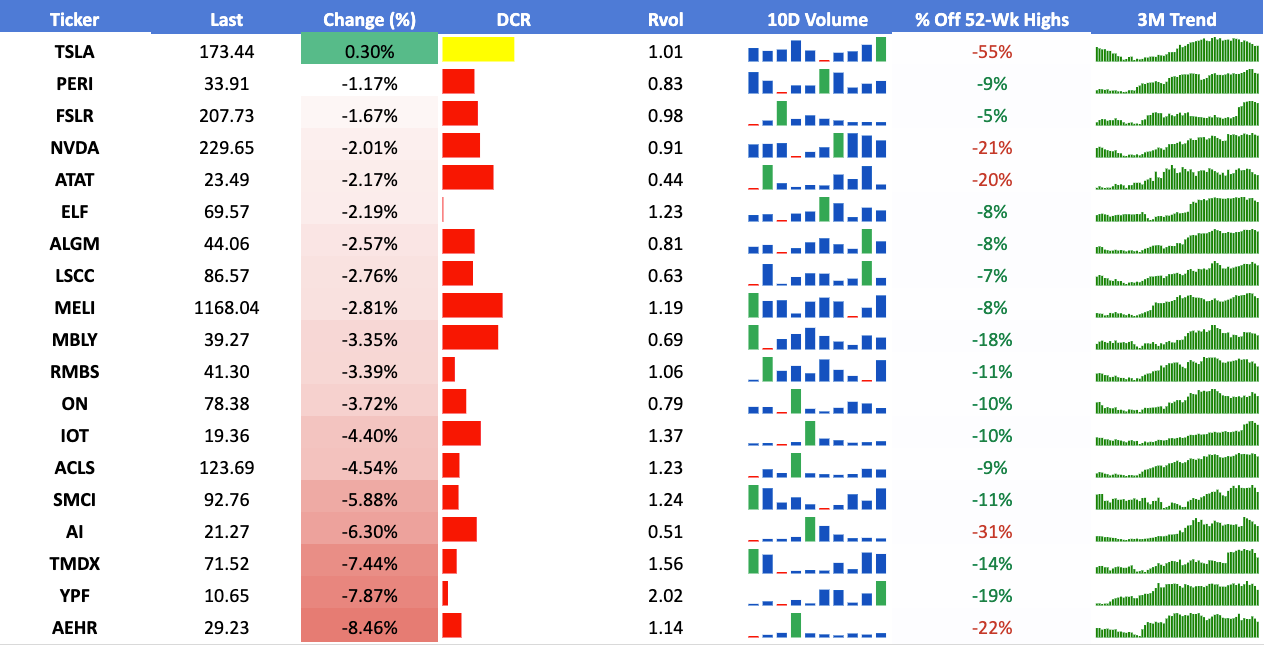
52 Week highs
9 Million breakout
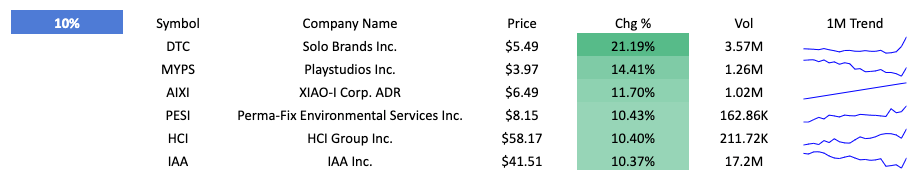
+10% Breakout
Upcoming Earnings For This Week

Watch List
Reminder to NOT force anything in this kind of environment and rather wait for your edge to show up clearly!
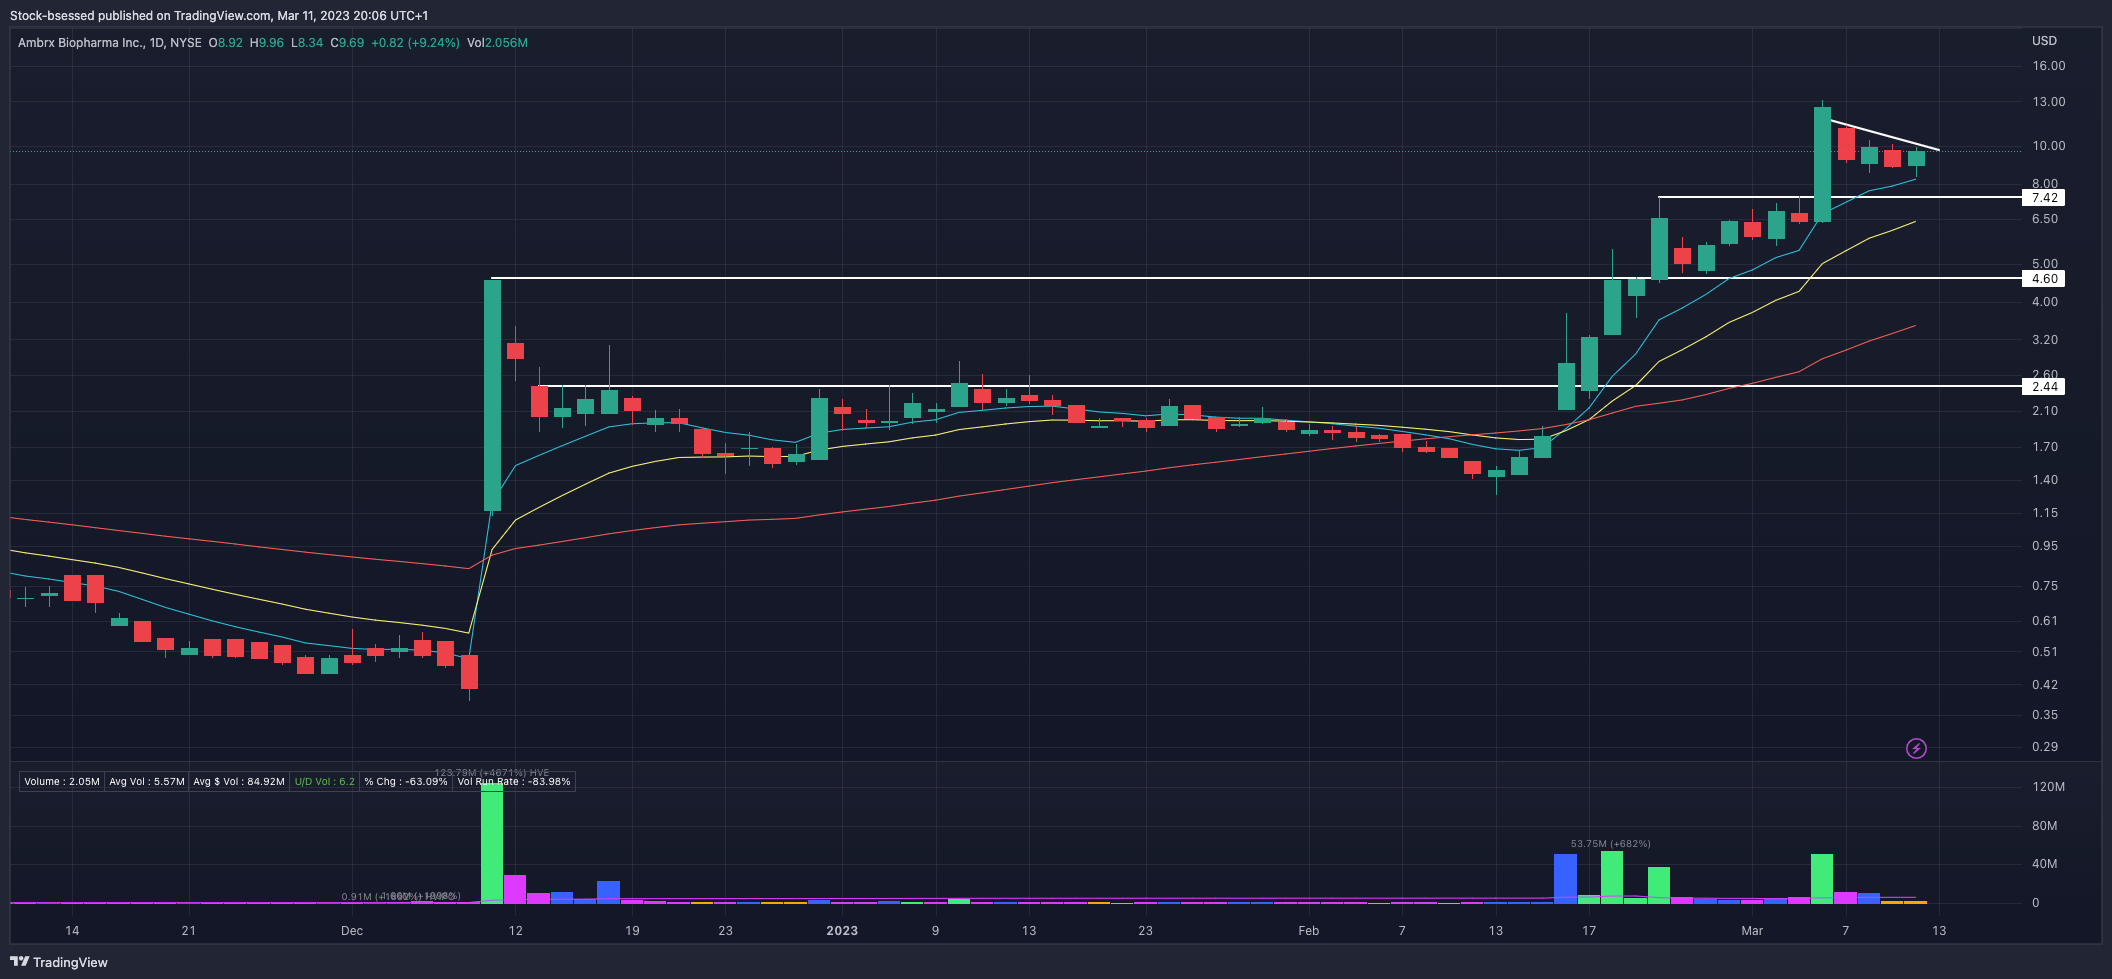
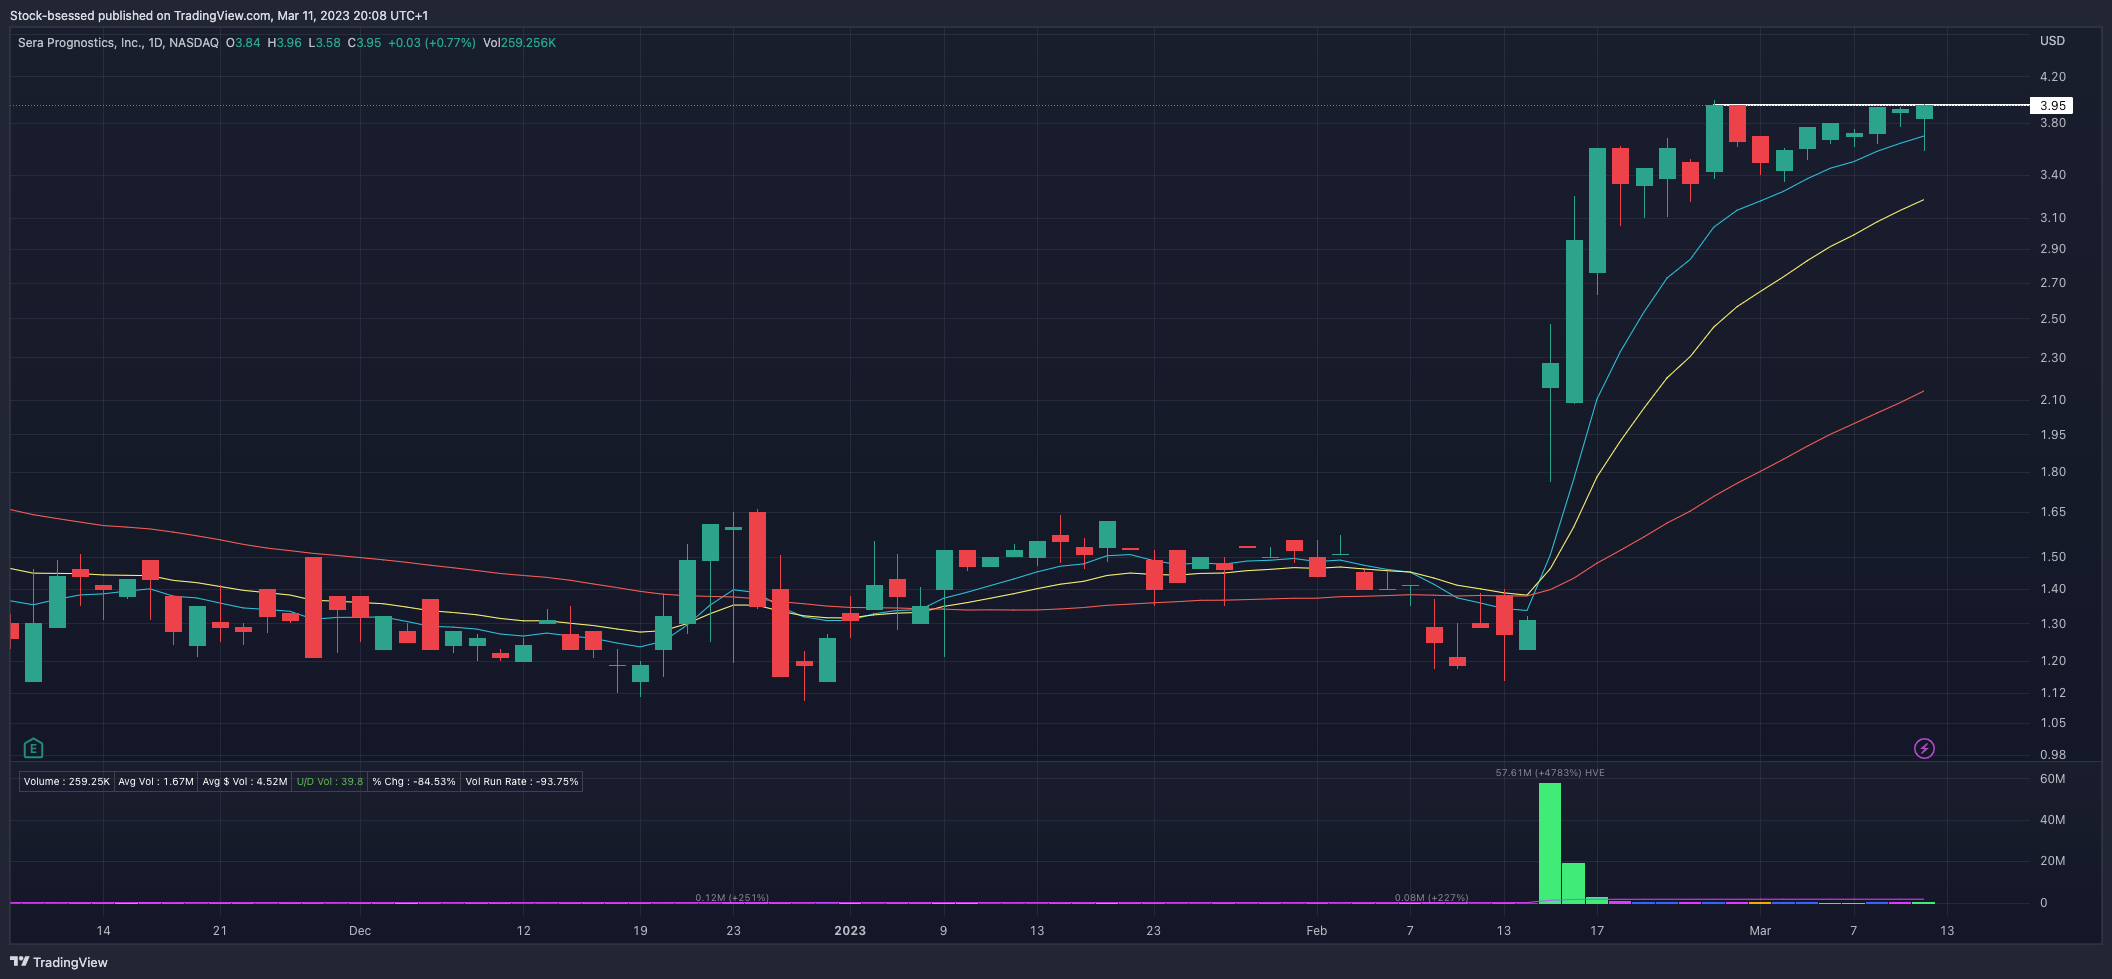
AMAM 0.00%↑ Liking how this is tightening up nicely below this DTL after a massive +900% move since mid-February!
ATAT 0.00%↑ - One which I was previously stalking for an entry on the long side may now be looking vulnerable to further weakness if it were to break down below this line of support:
Others I am watching:
Have a great week all!