

Weekly Review & Focus List For Week of 17th April
Weekly Review & Focus List For Week of 17th April
Longer Time Frames Show Supportive Action

Hi all! 👋
In this article I will cover:
General Market Overview
The action displayed by leading stocks with TML potential
Individual Sector Analysis - Which groups are breaking down vs showing relative strength
4 Helpful Scans to get potential leaders on our radar
Links to TradingView watchlists
Personal Portfolio Update
Stocks currently on my focus list with actionable trade ideas
Stockbsessed is neither an investment or financial advisor. Stockbsessed does not provide financial advice and none of the information being provided is to be seen as such.
General Market Overview
Session

Week

Despite the wild daily swings with real difficulty to certify a sustained trend in either direction, the market continues to show some encouraging signs within the context of this very mixed market environment as all of the above indexes managed to close positive on the week.
It is very important not to allow ourselves to get too biased in either direction, continue to follow the setups the market offers and adjust your overall exposure progressively based on the action of open positions. The key is to zoom out to longer timeframes such as the weekly and try block out the noise we expose ourselves to with these shorter timeframes.
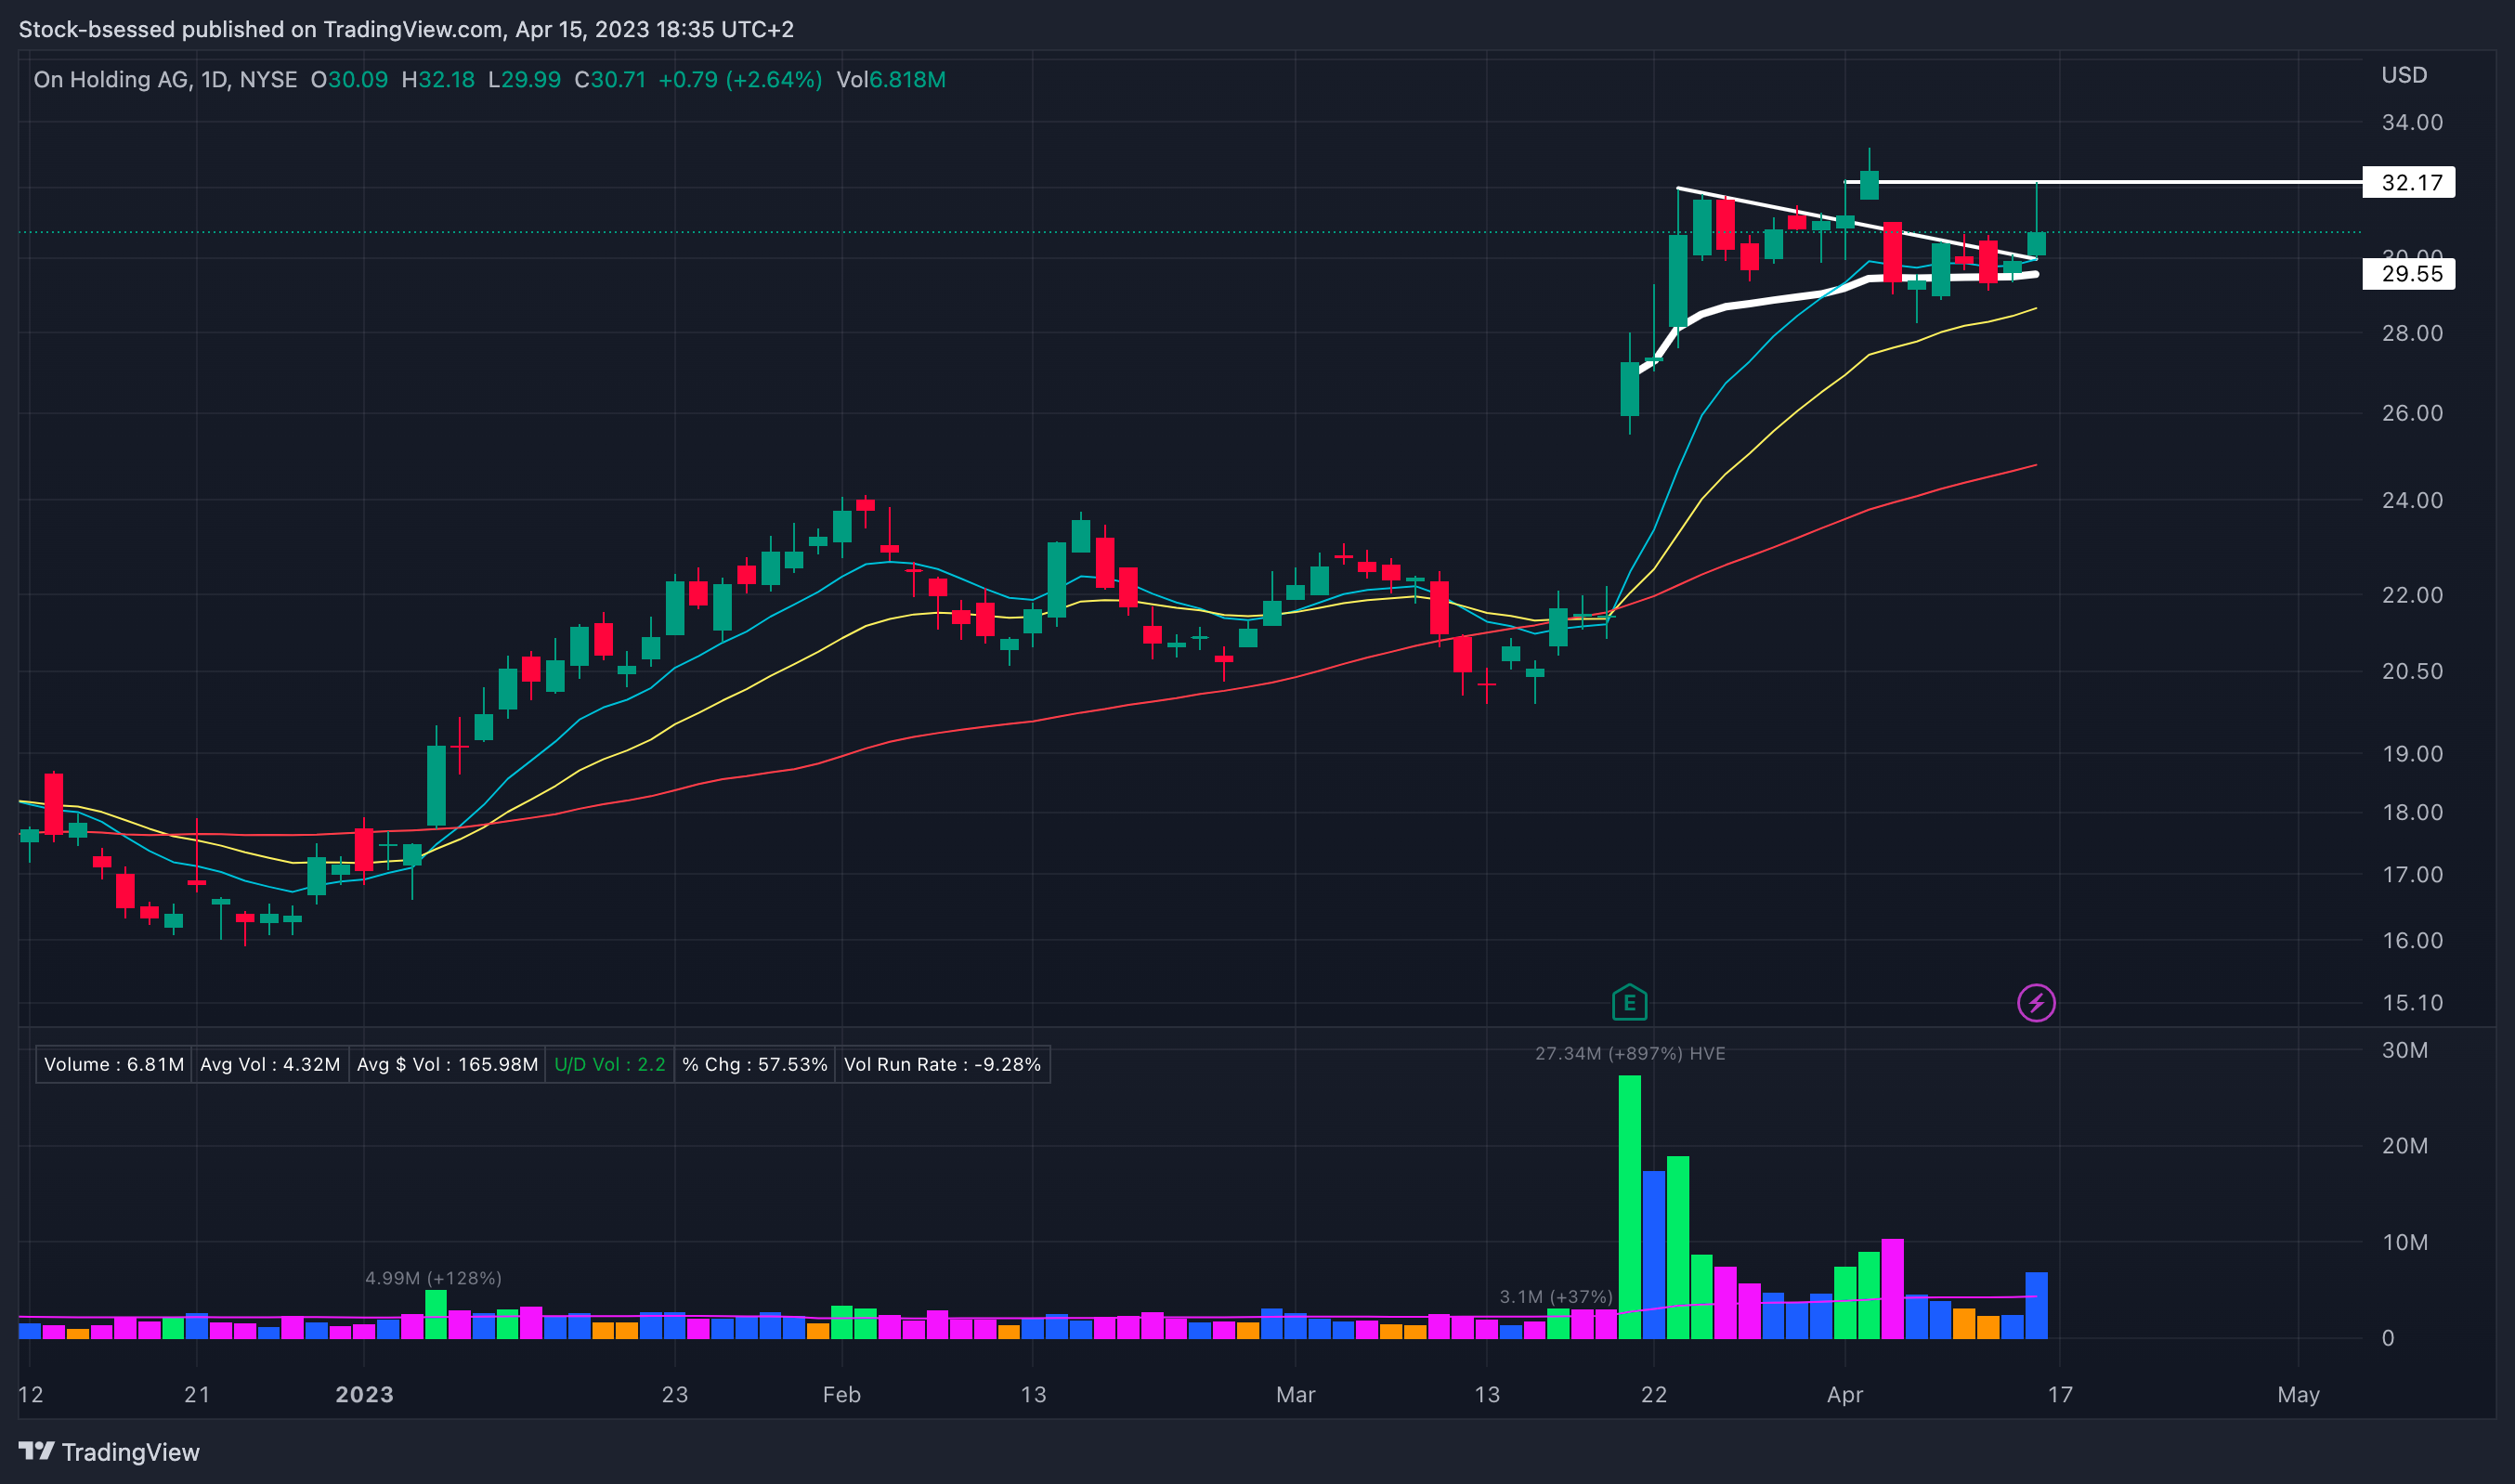
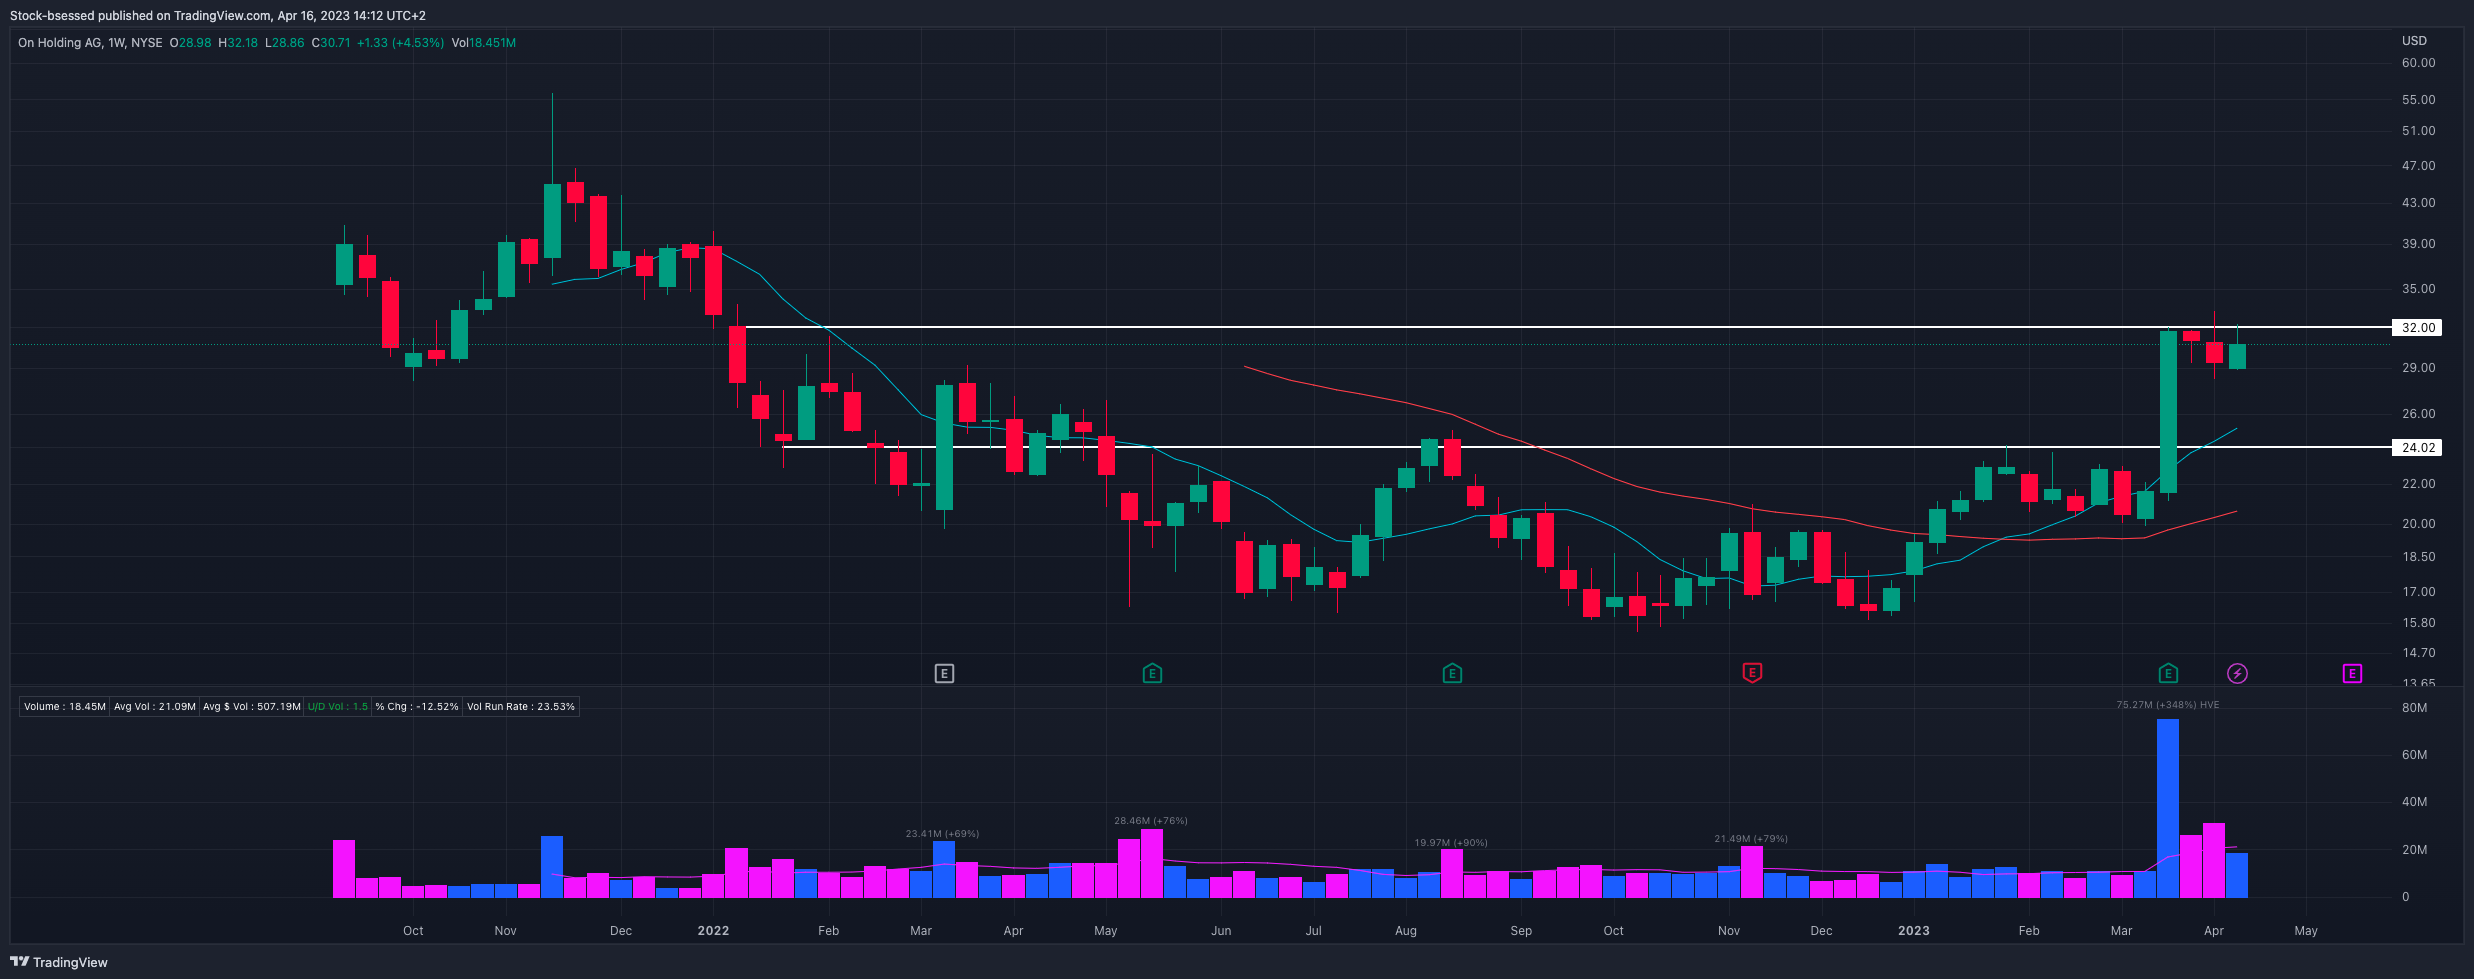
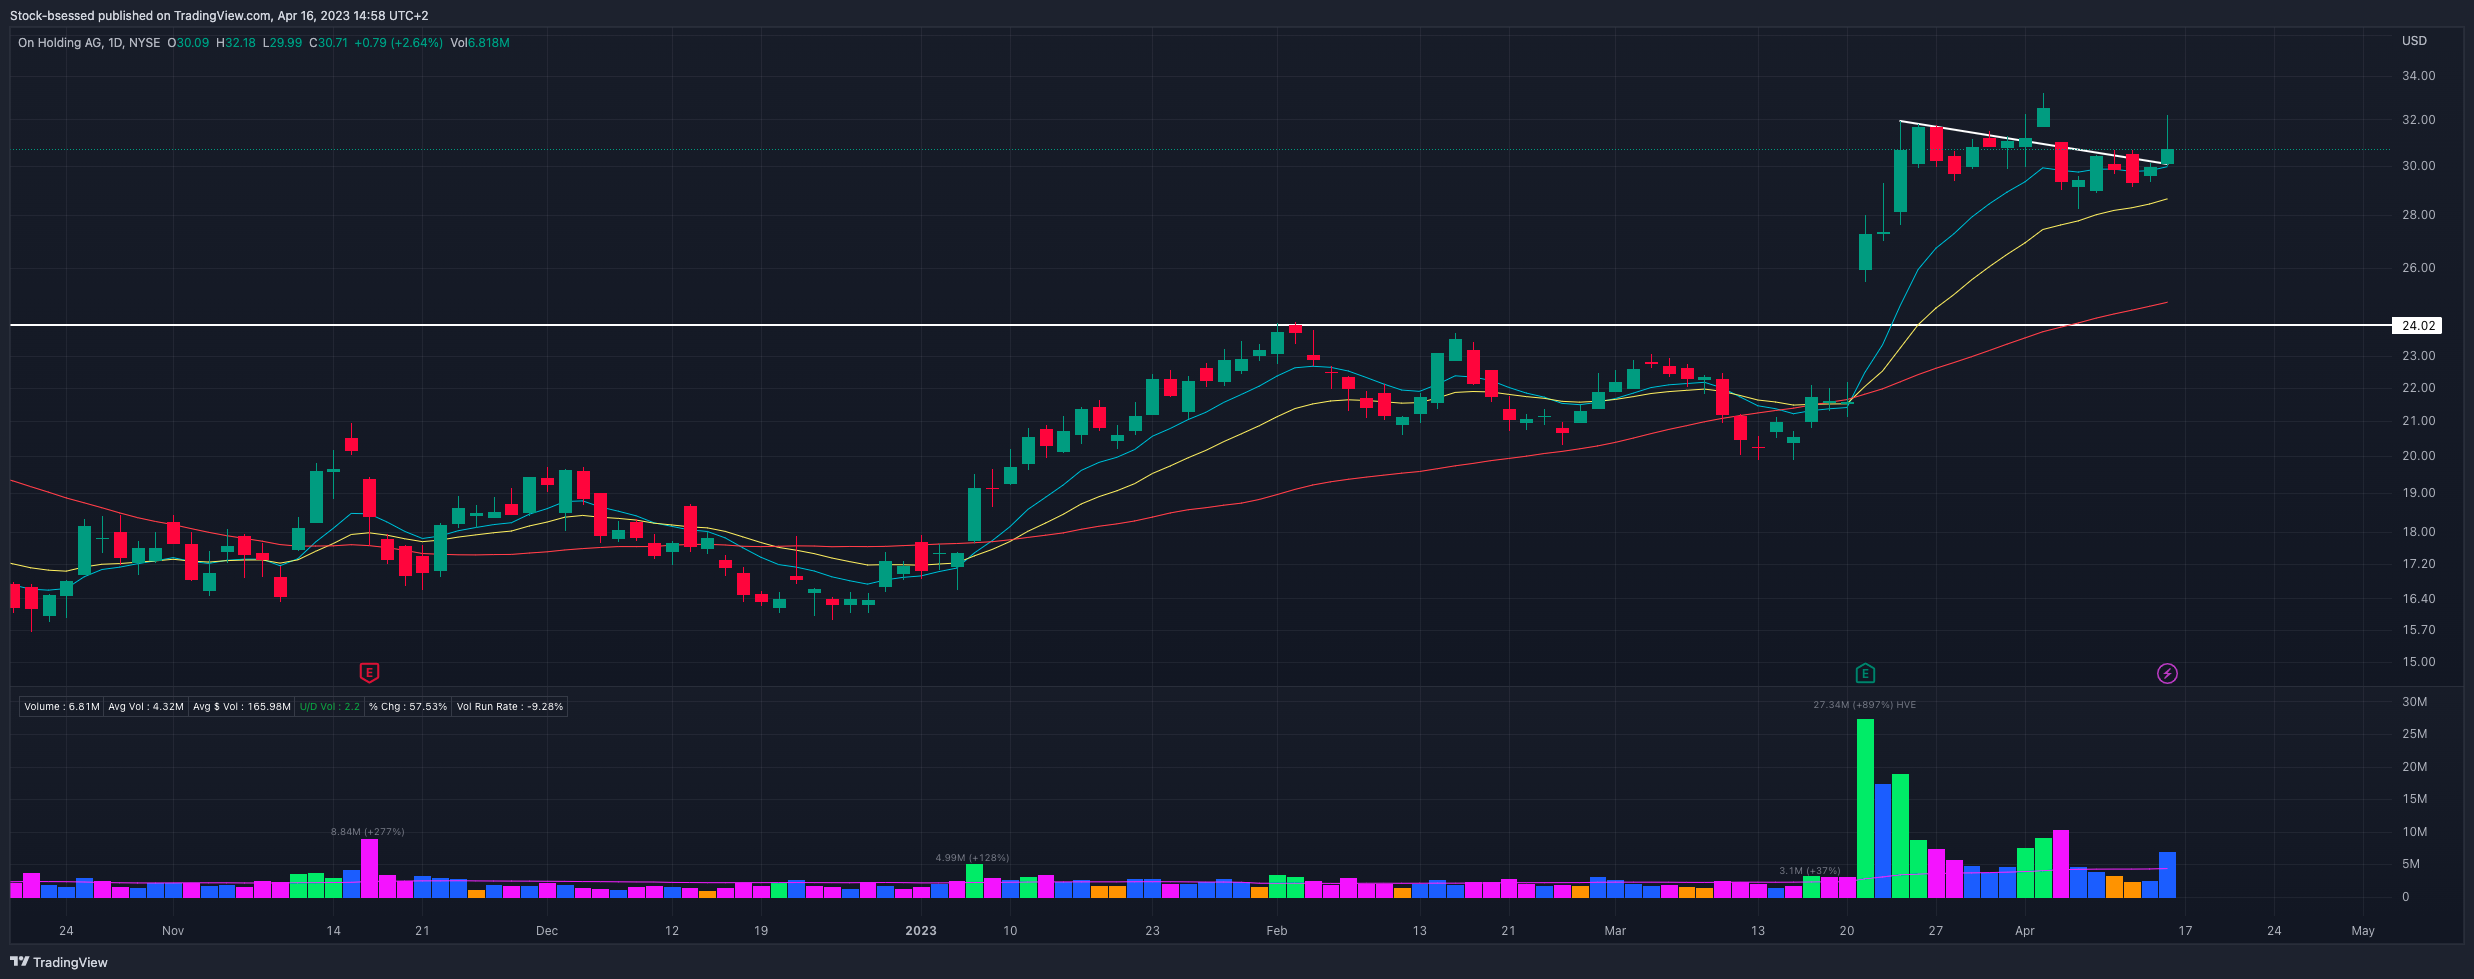
In yesterday’s session - I took this descending trend line setup in ONON 0.00%↑ which worked very well initially - quickly pushing to +5% profit, however, the market quickly gave some valuable feedback as sellers came in strong at an important prior level to push this back down hard along with the general market - volatility, choppy action and lack of follow through are still very prominent features of this market - I am still often seeing positions go from respectable profits to then reversing and stopping me out at breakeven like this one did.
No need to take any of these trades personally and get all negative about how your trades are going - this is the nature of a choppy market environment and it will benefit you greatly if you are able to switch your mentality into seeing such trades more positively as valuable feedback from the market to keep your exposure down as certain setups would not be ready to go just yet.
Still running this Easter discount with -20% OFF until TODAY:
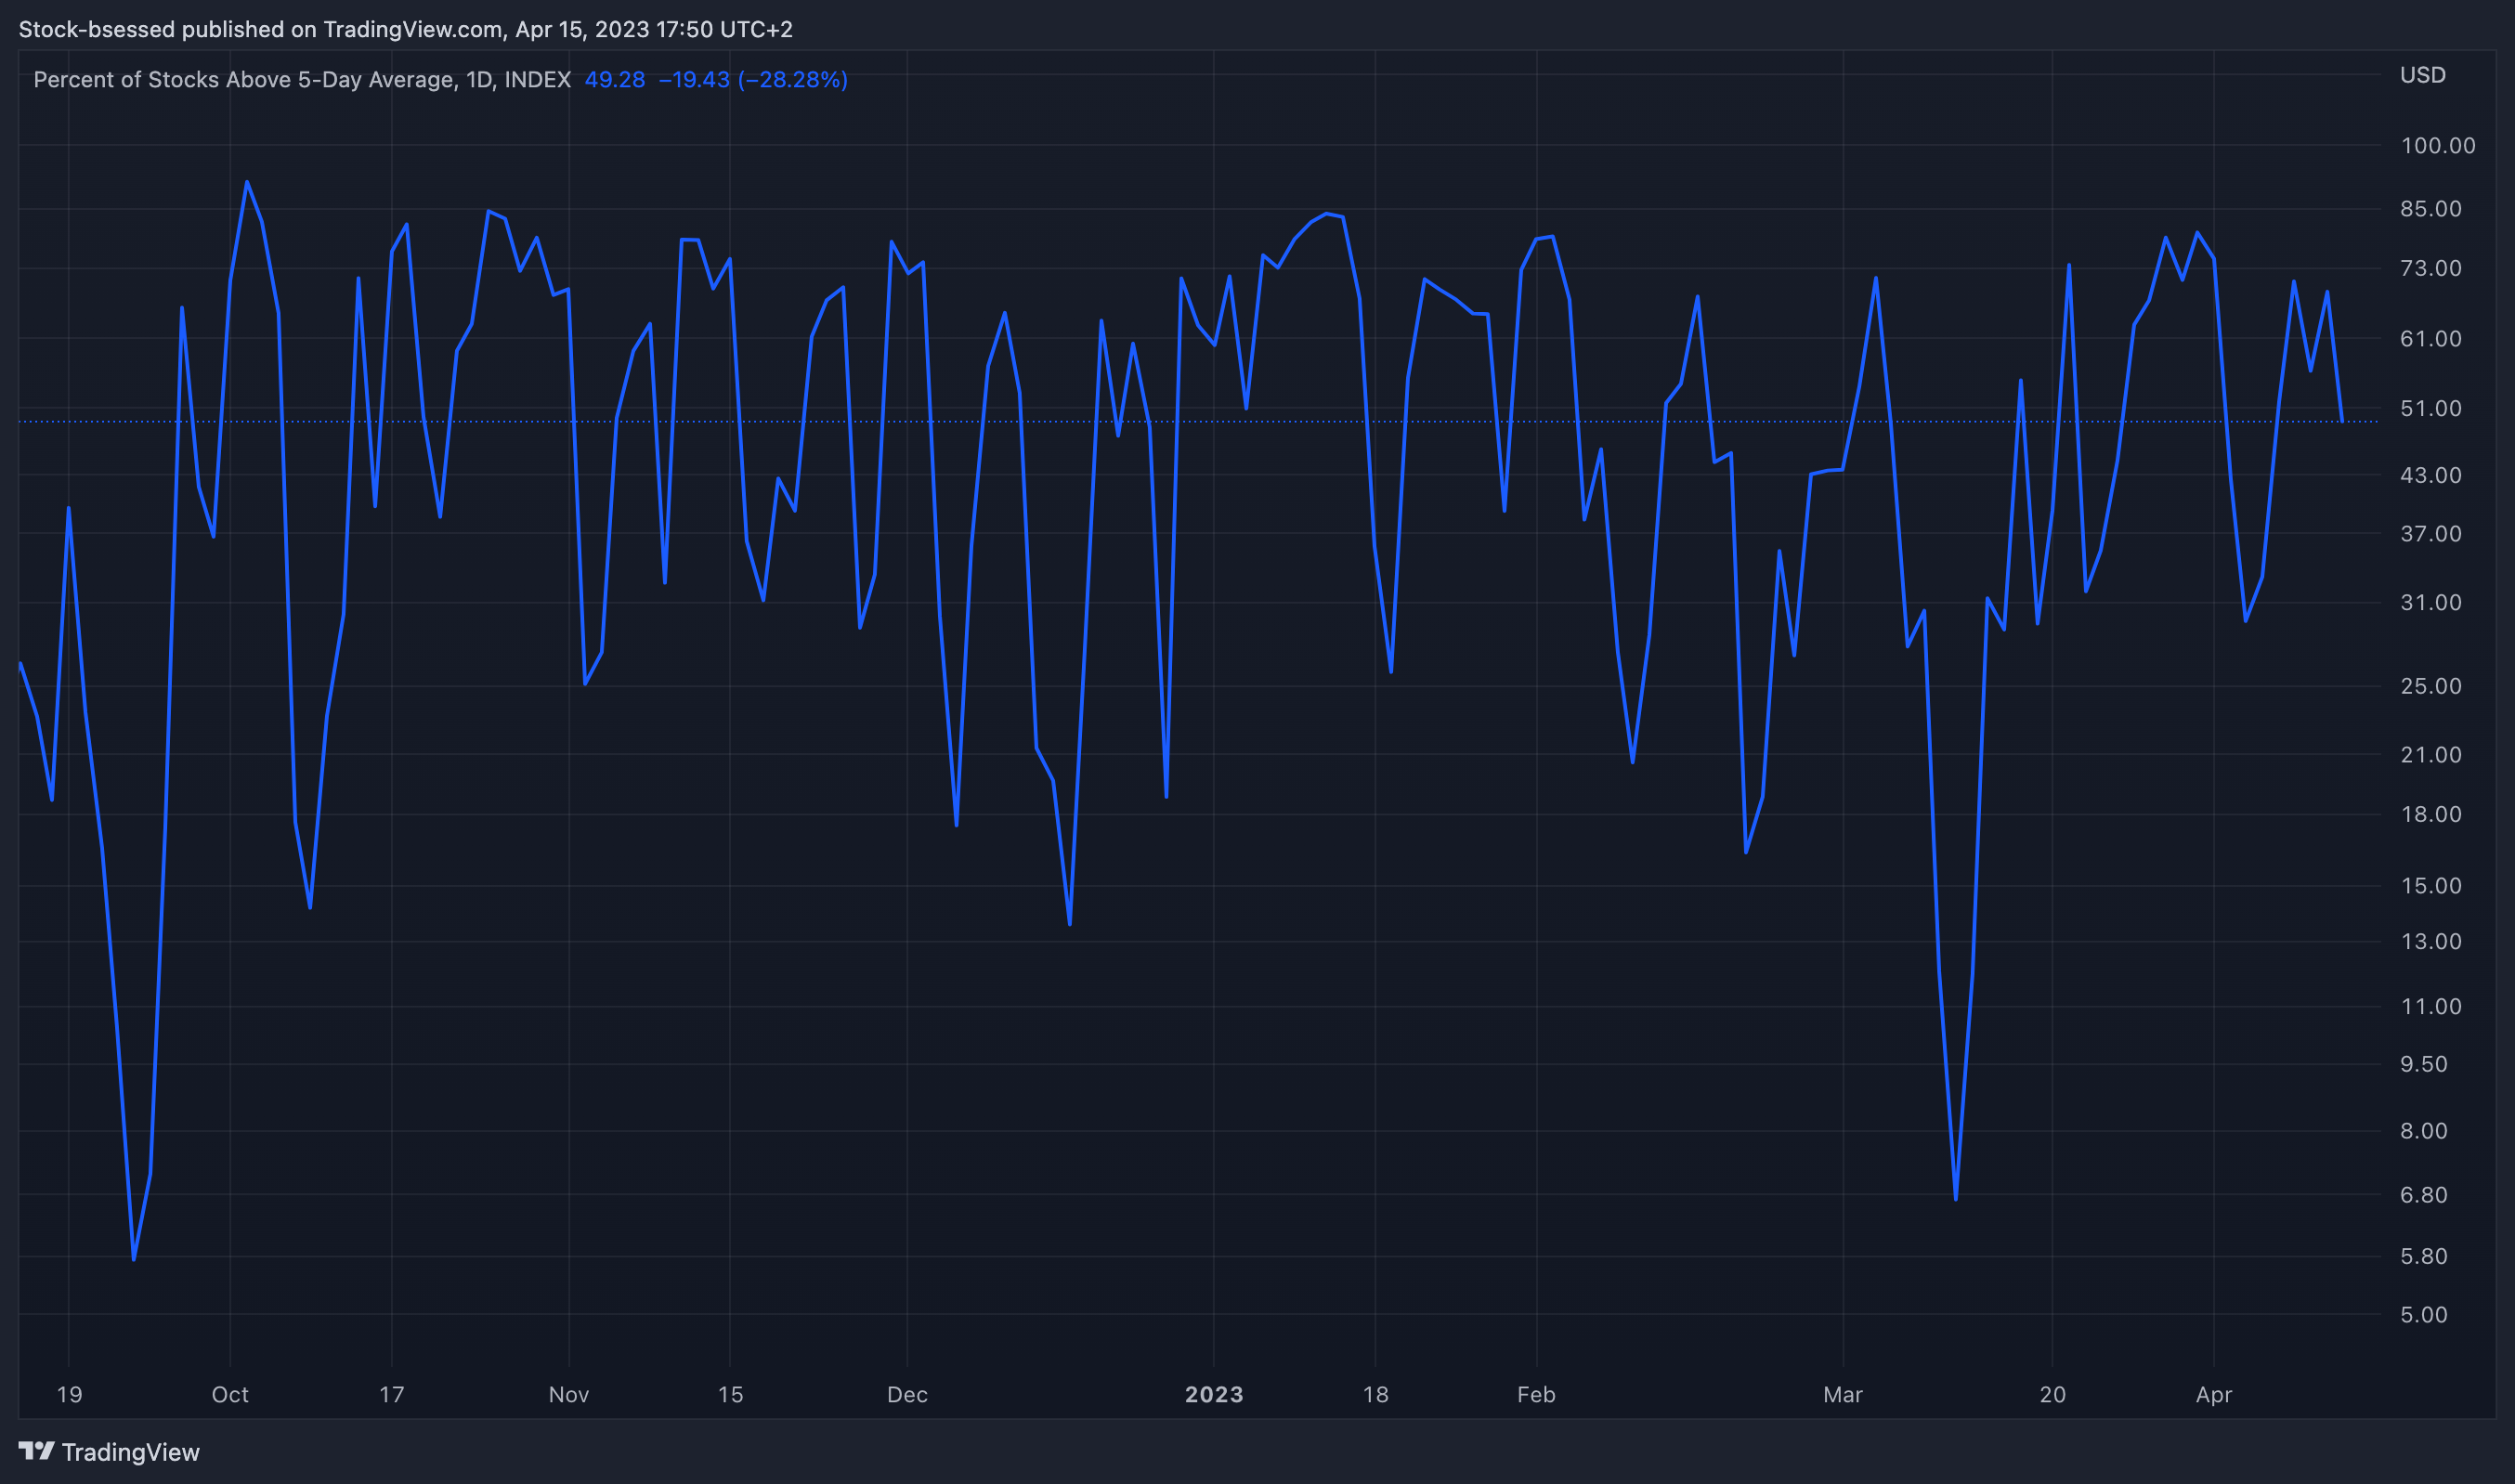
MMFD - Percent of Stocks Above 5-Day Average
MMFI - Percent of Stocks Above 50-Day Average

$NASI

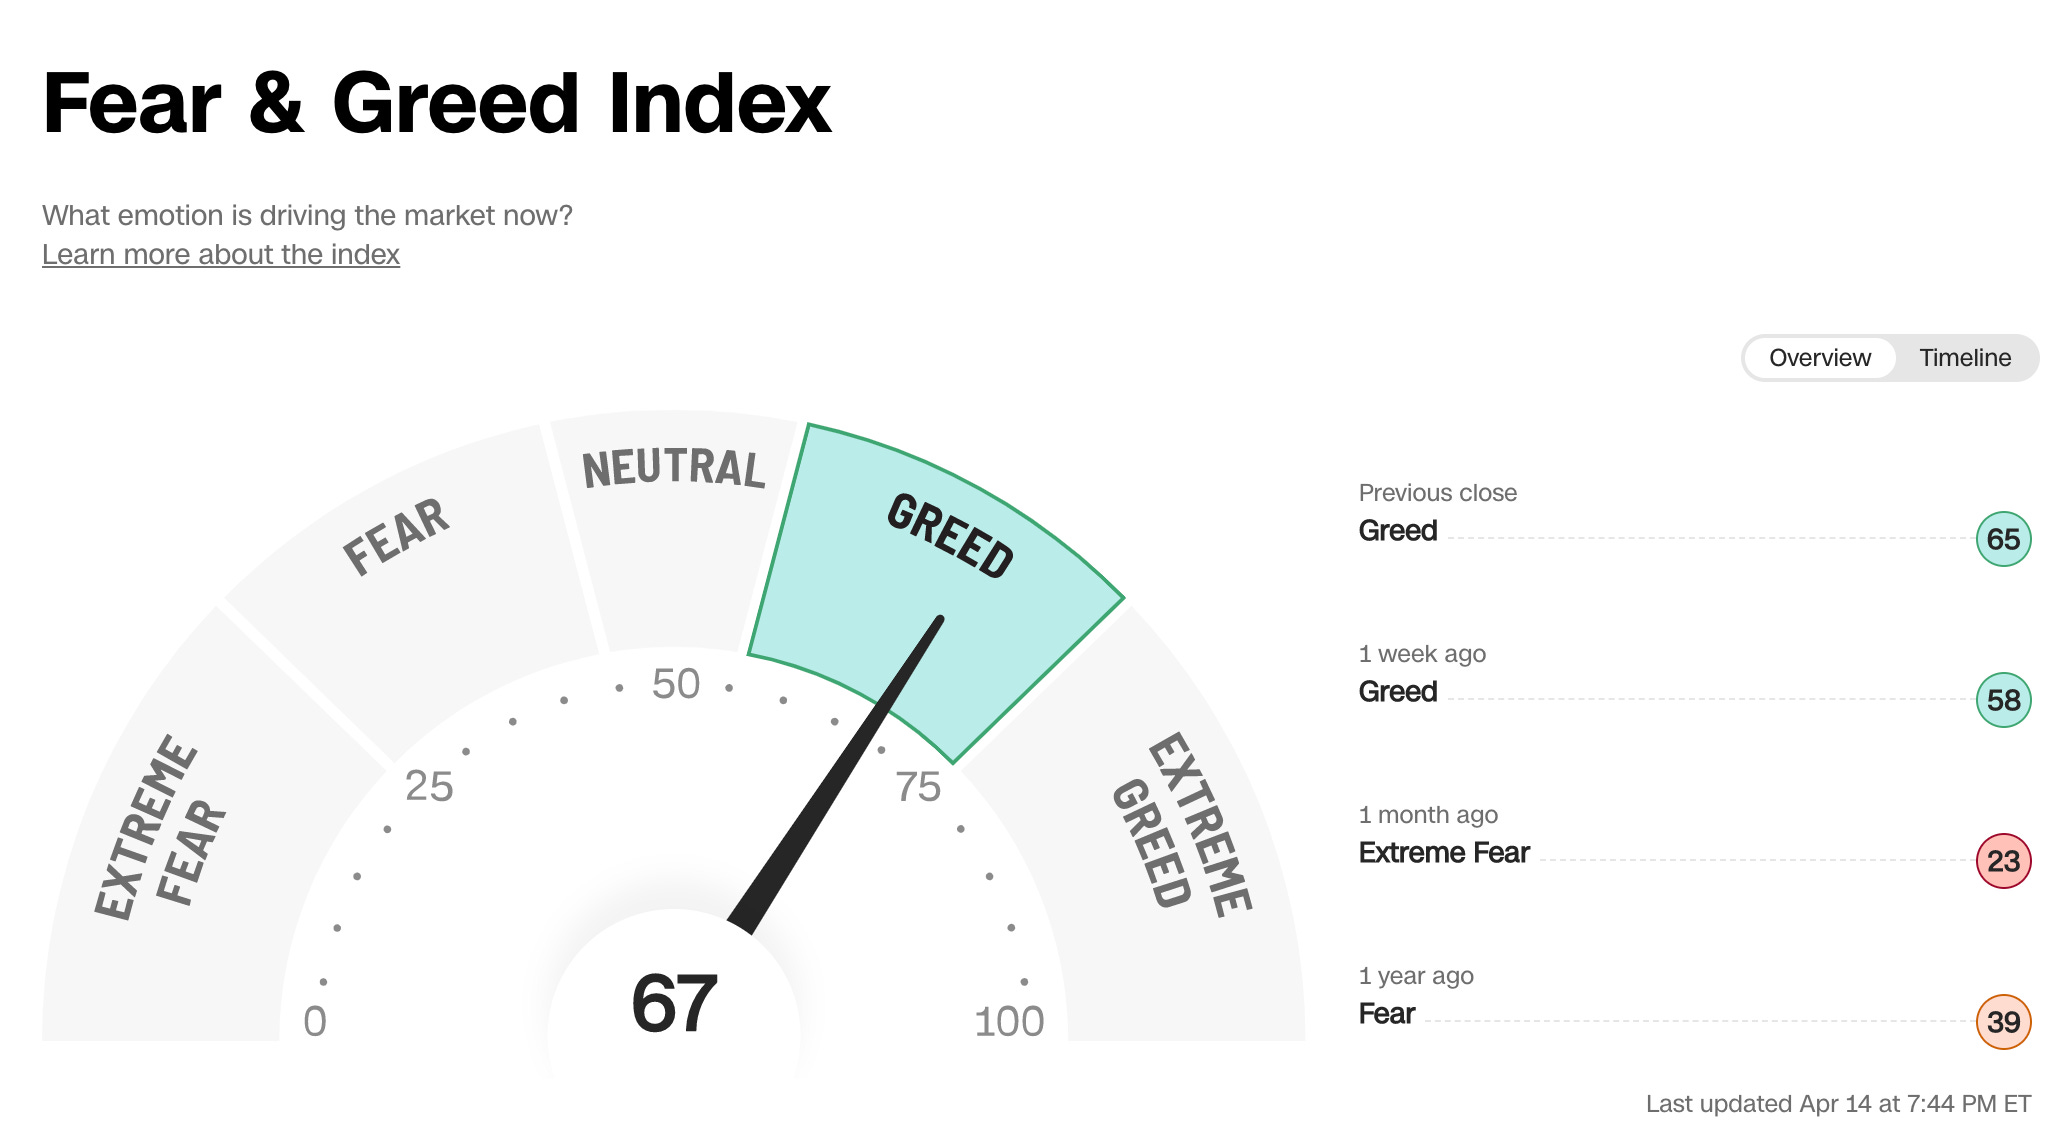
Fear & Greed Index
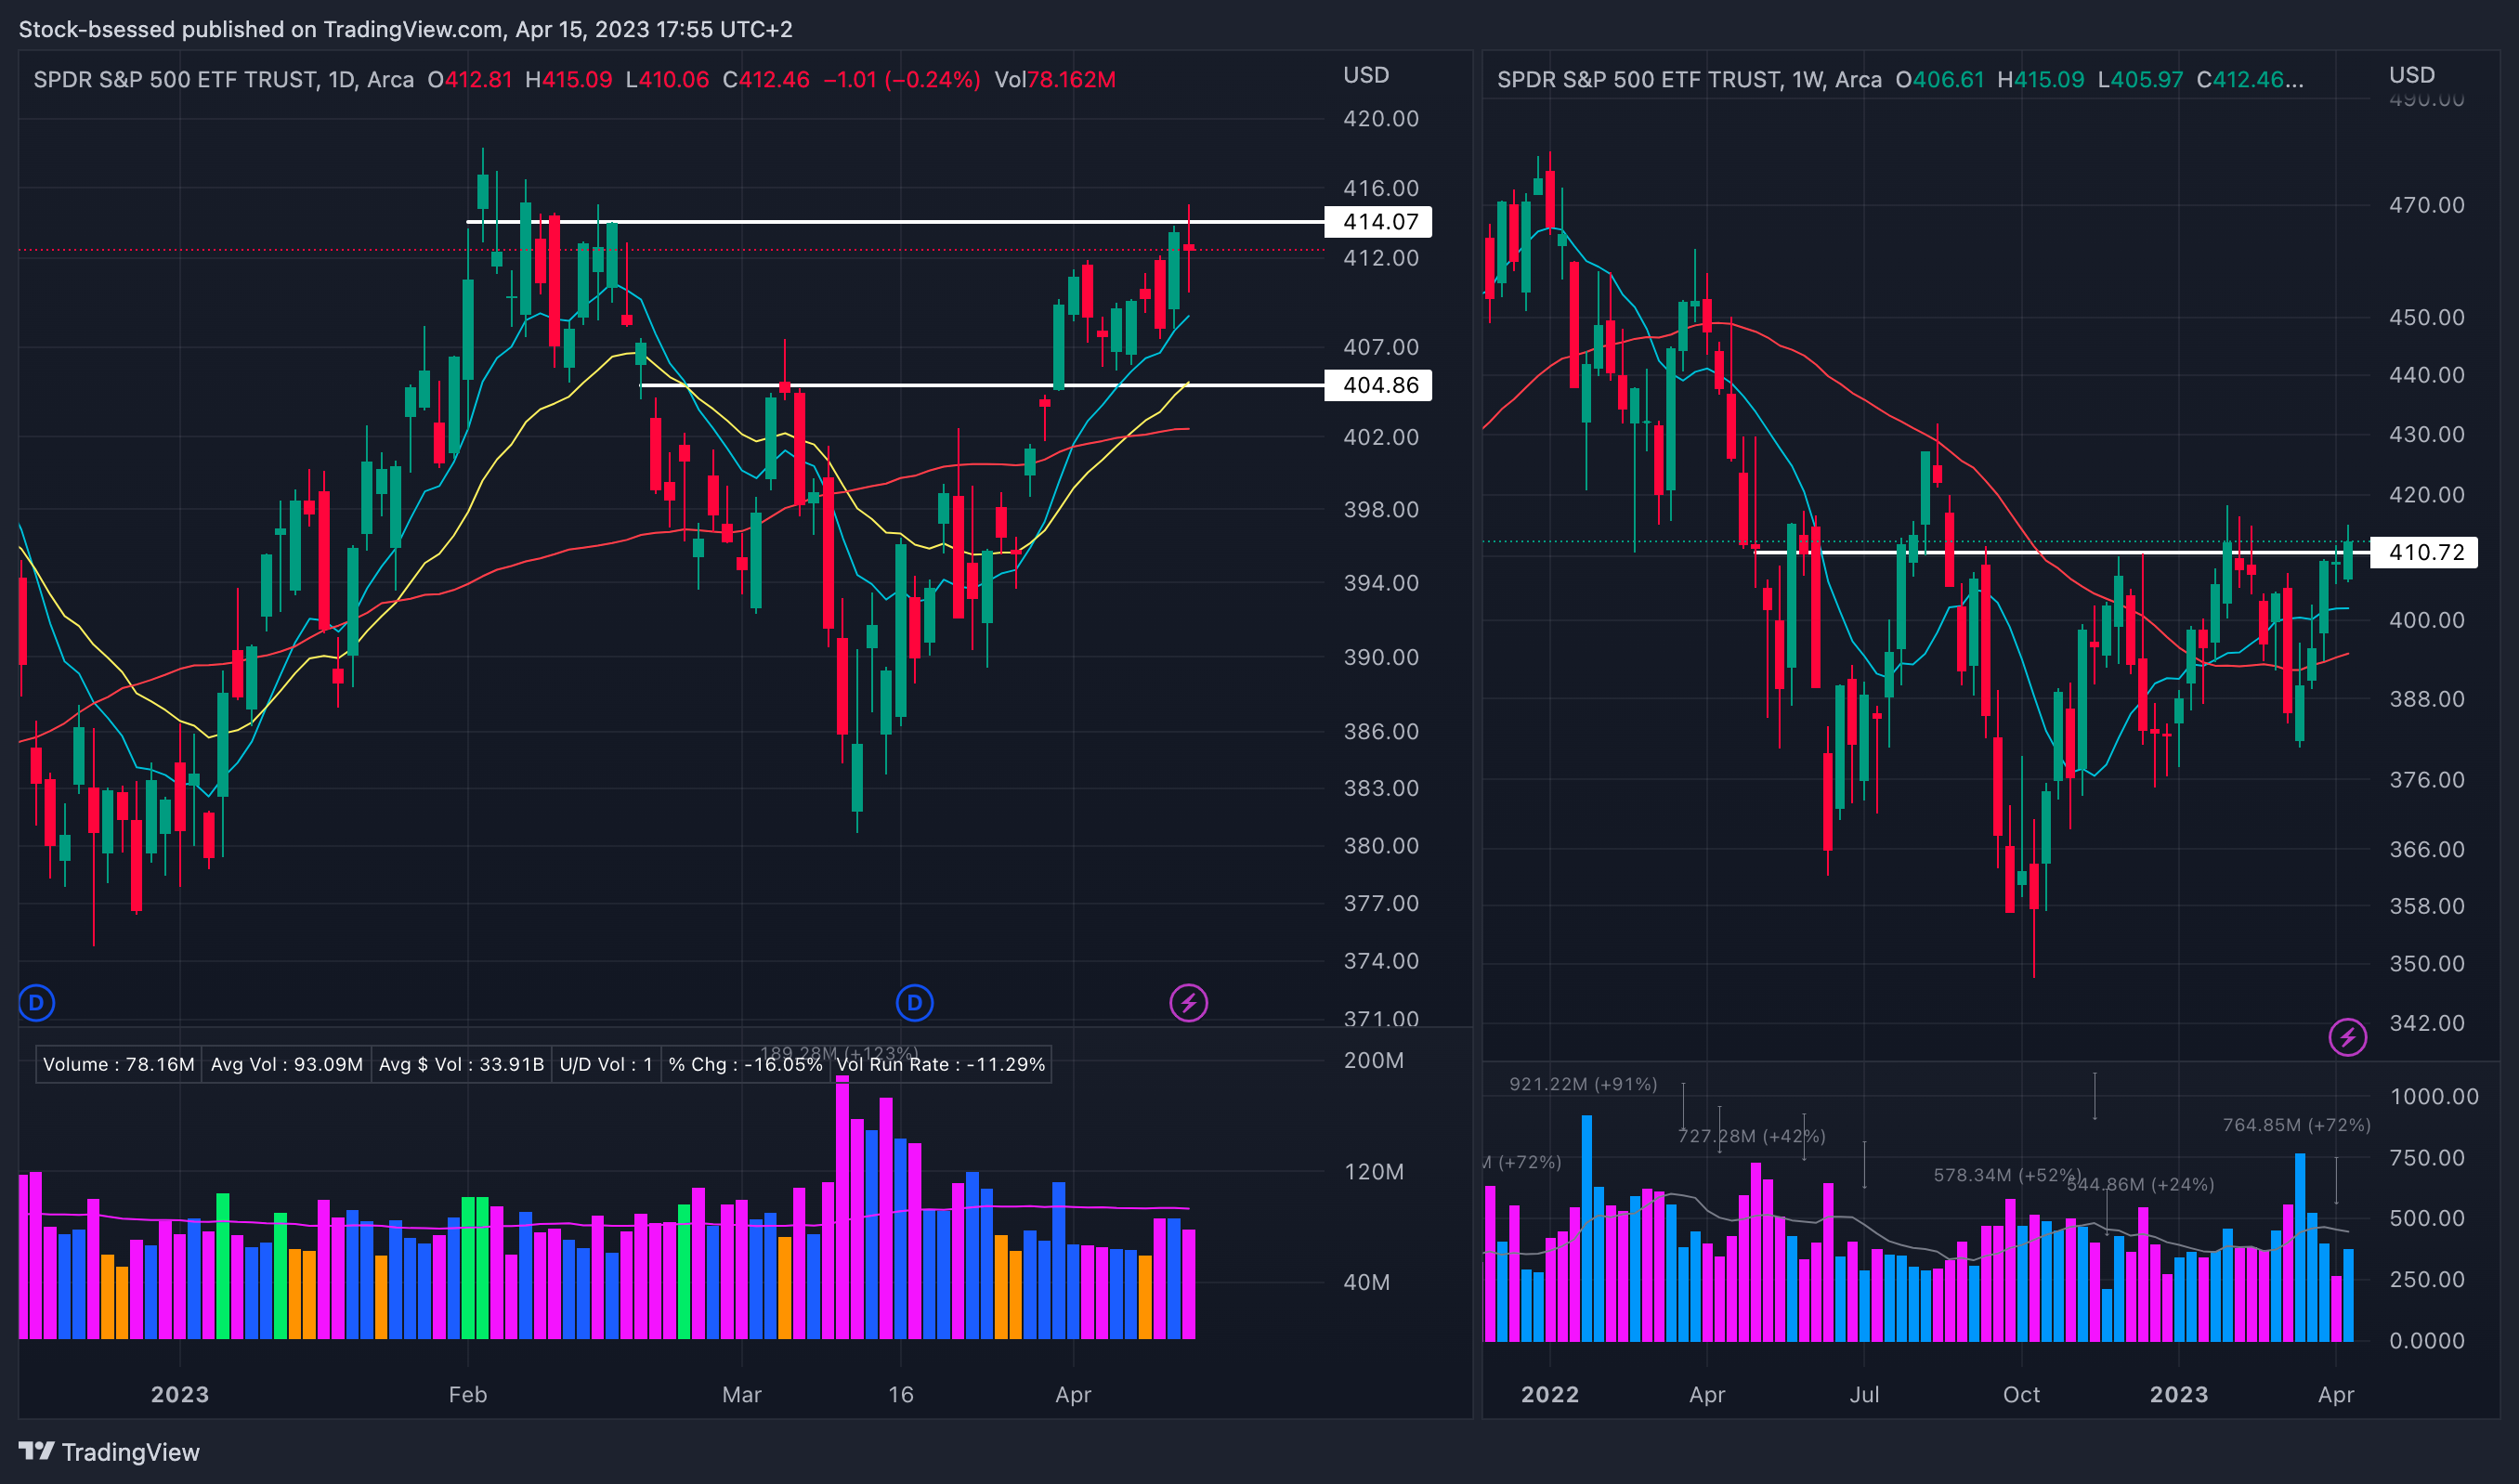
SPY 0.00%↑ Around +8% since the mid-March swing low and tried to push through this key 414 area in yesterday's session but got slightly ahead of itself to reverse and close -0.24% on the session. Key moving averages still trending upwards nicely:
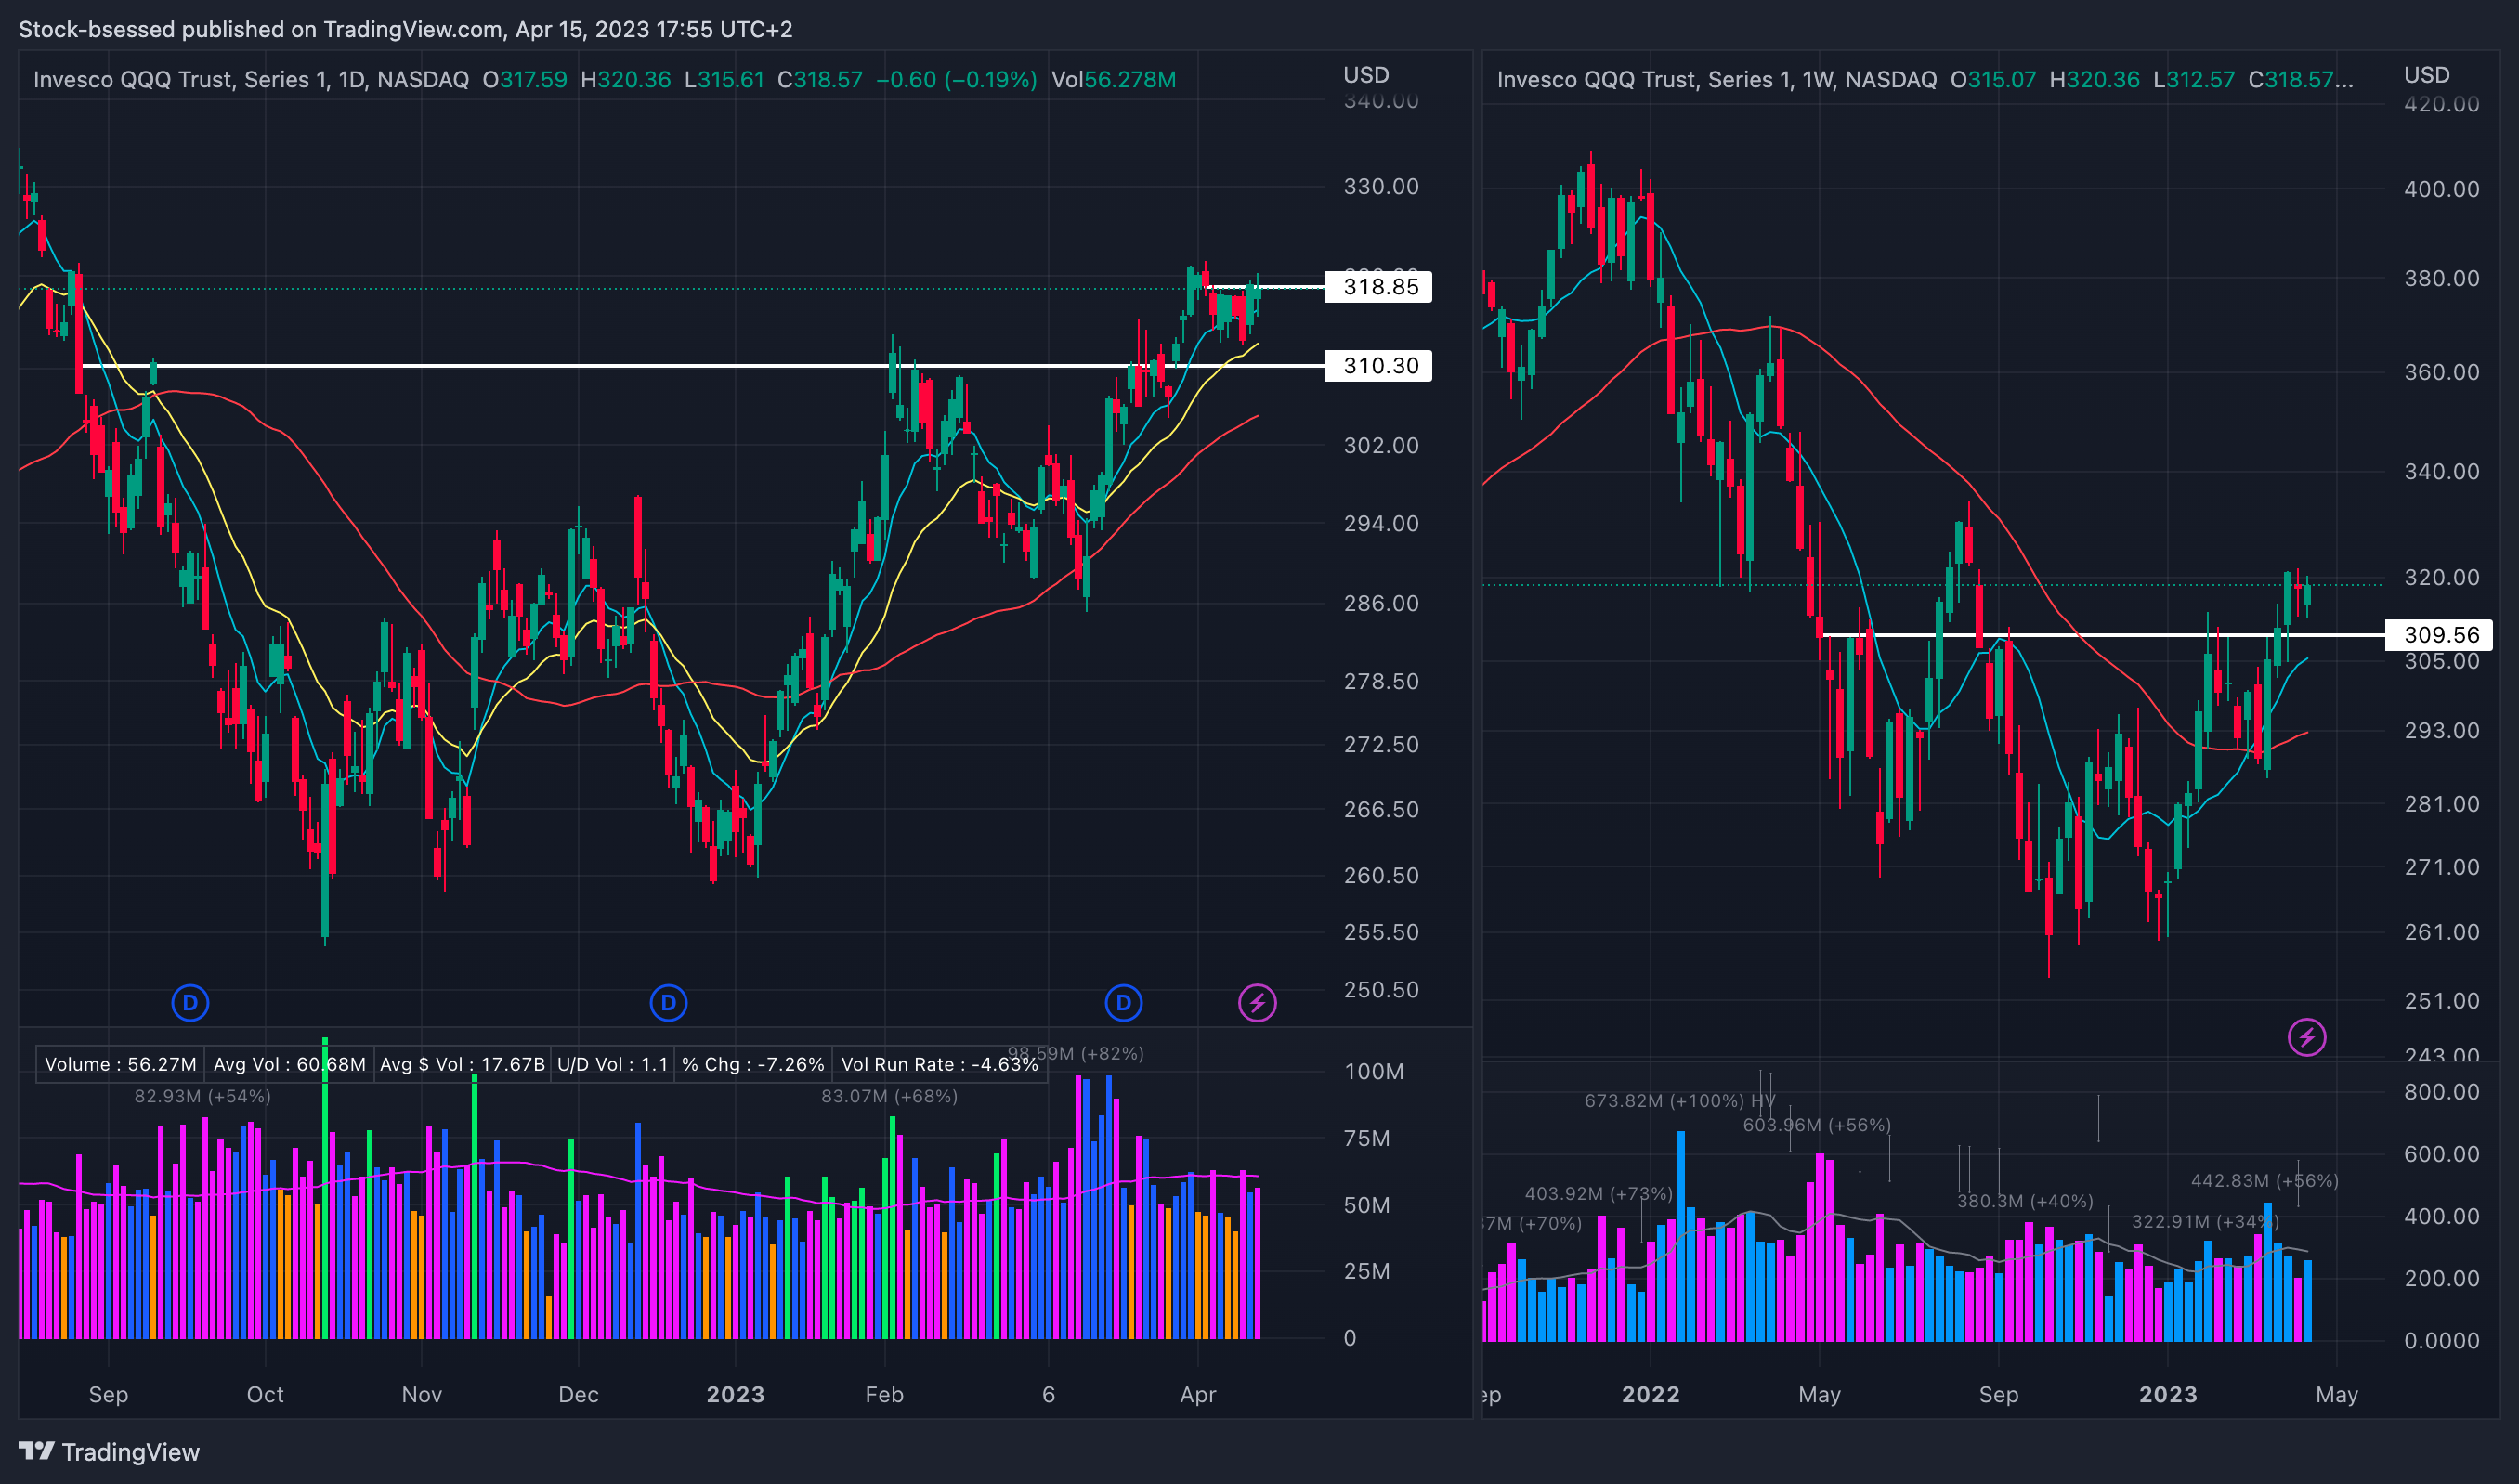
QQQ 0.00%↑ Has been acting very well lately and I like how it is attempting to tighten up right under this 319 level while buyers stepped in right around the 10EMA last session:
IWM 0.00%↑ Remains in this 171-179 consolidation and attempted to get going above the 179 area once more last session but sellers came in strong once again - may need more time before pushing through but encouraging that buyers are supporting this around the 10/20 EMA:

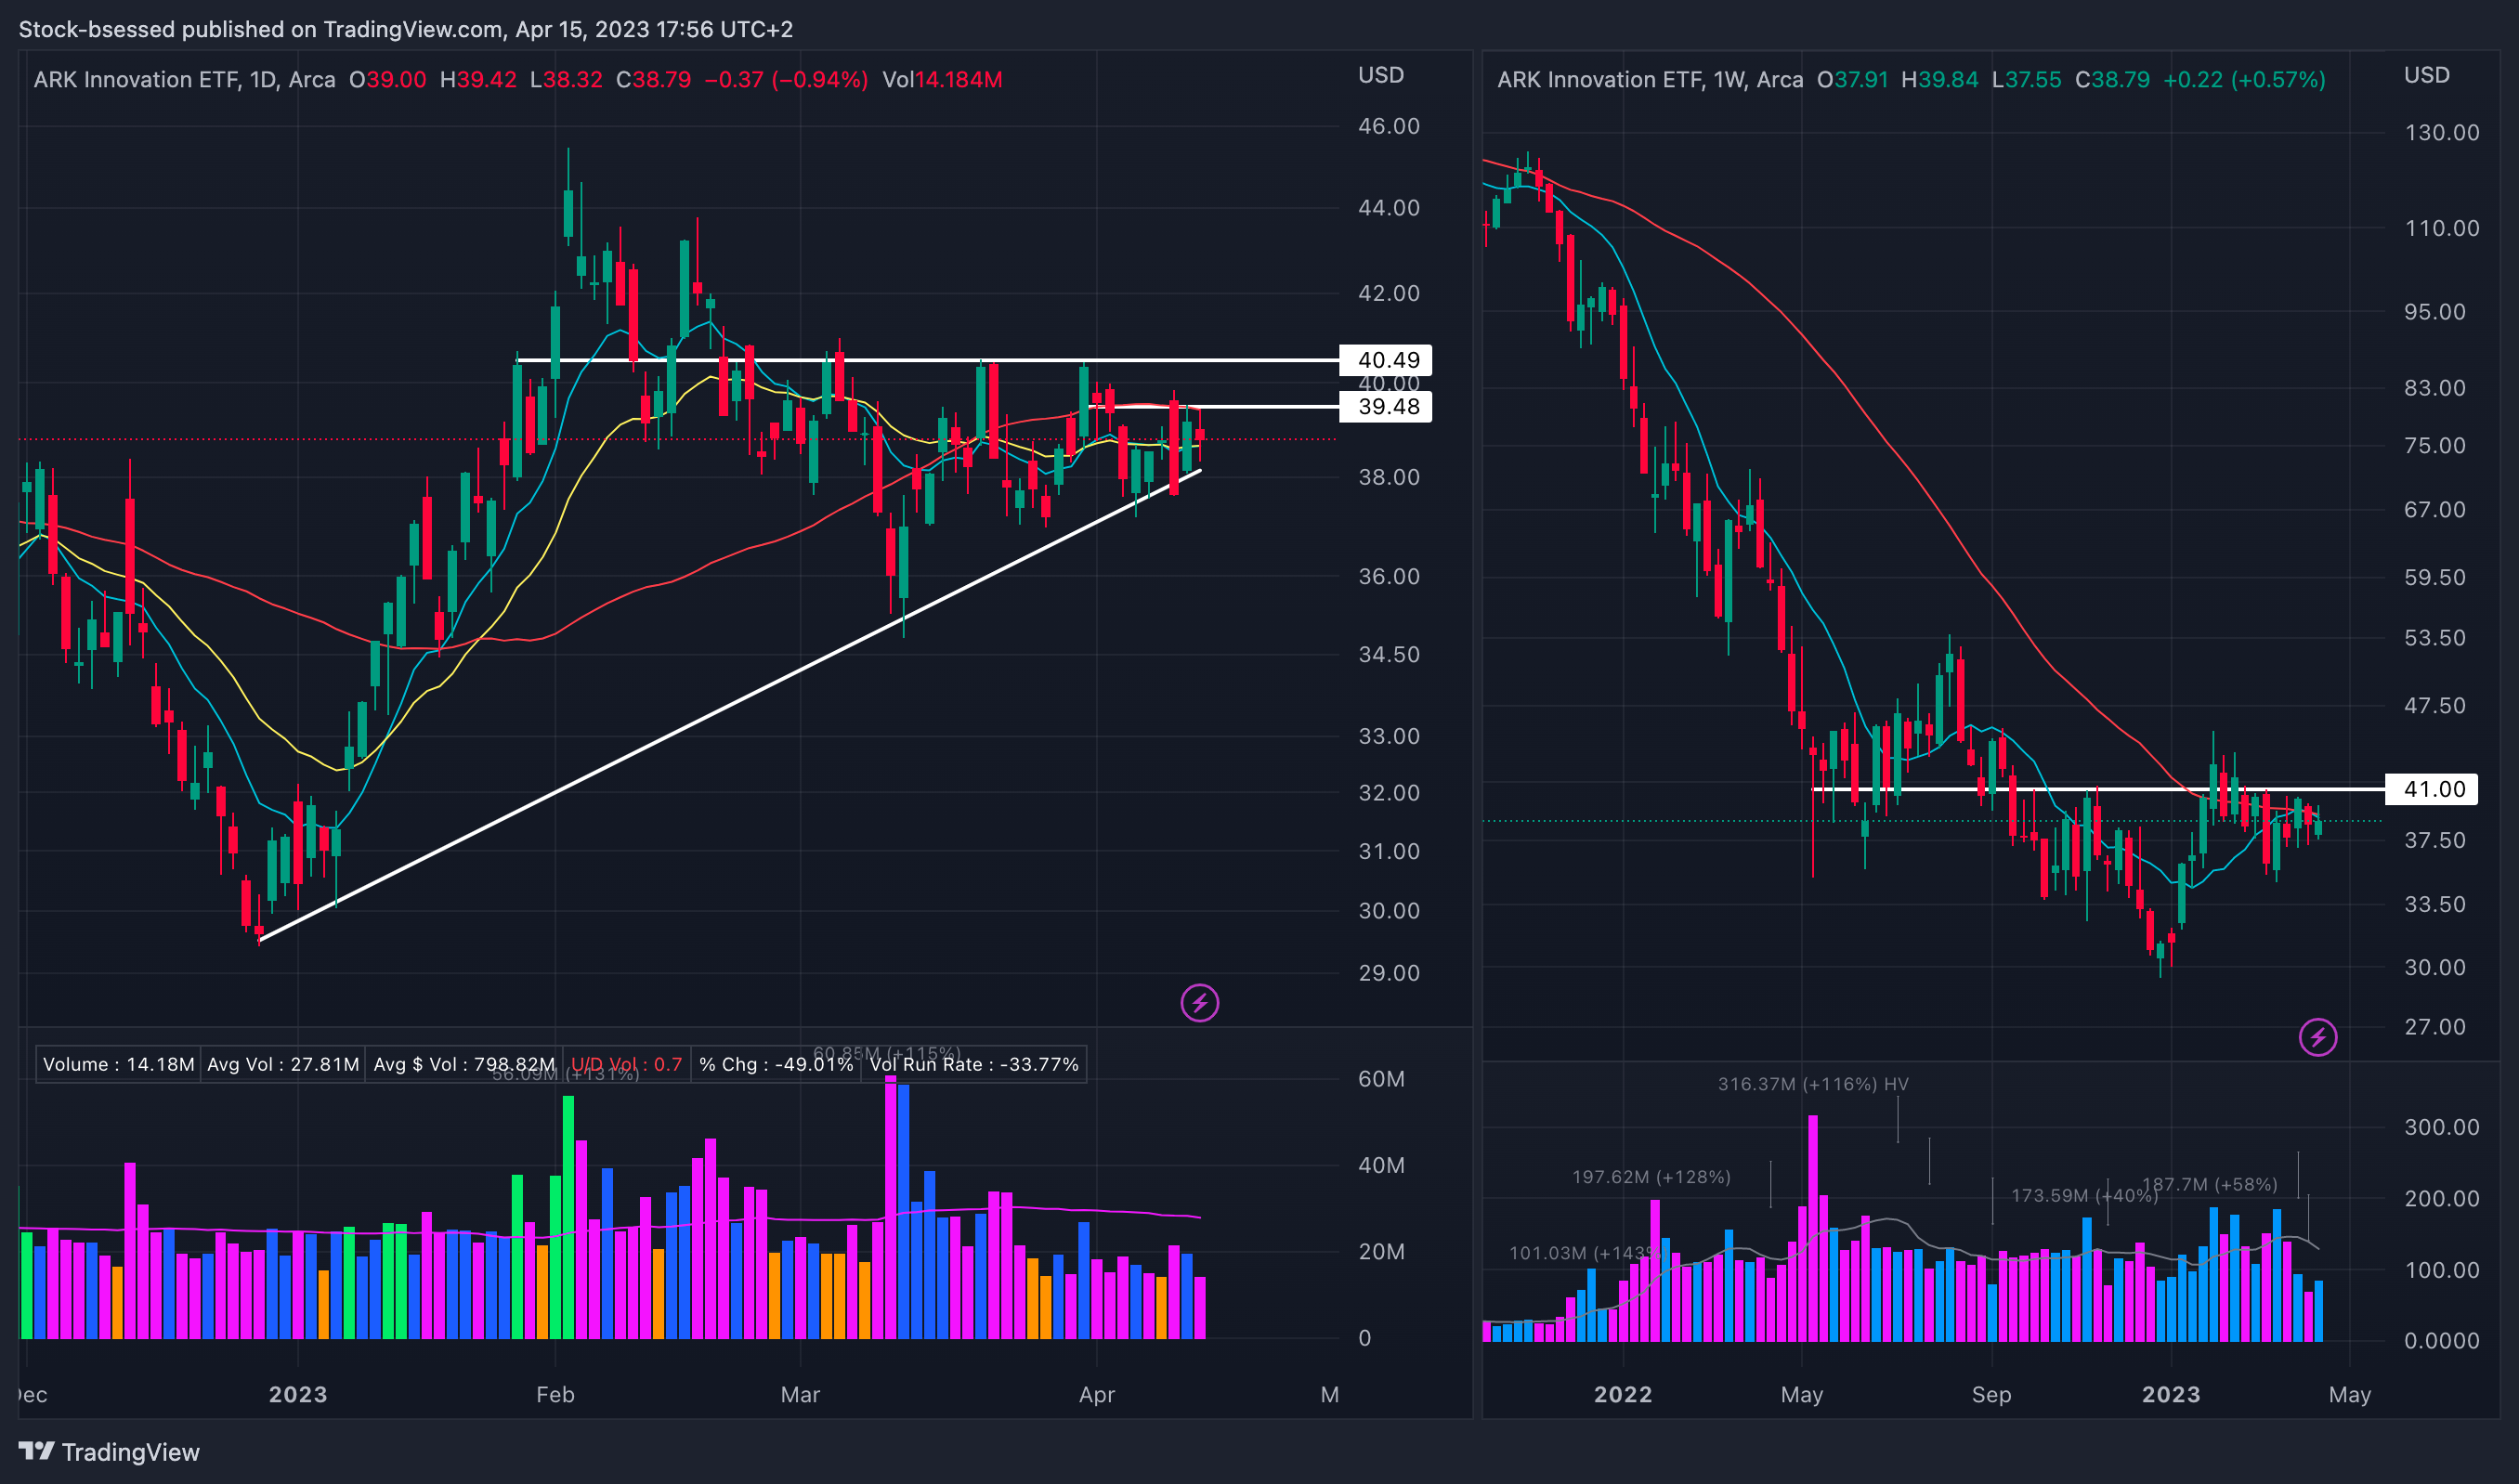
ARKK 0.00%↑ Continues building out higher lows and closed last session right between the 50-day moving average up above and a cluster of the 10 & 20 EMAs right below. Some key levels I am watching include ~39.50, ~40.50 and 41:
IWO 0.00%↑ Overall appears to be tightening up with some resistance ~228.50 - good to see some support with buyers stepping in around the 10/20EMAs but still being pinned down by the 50-day moving average up above:

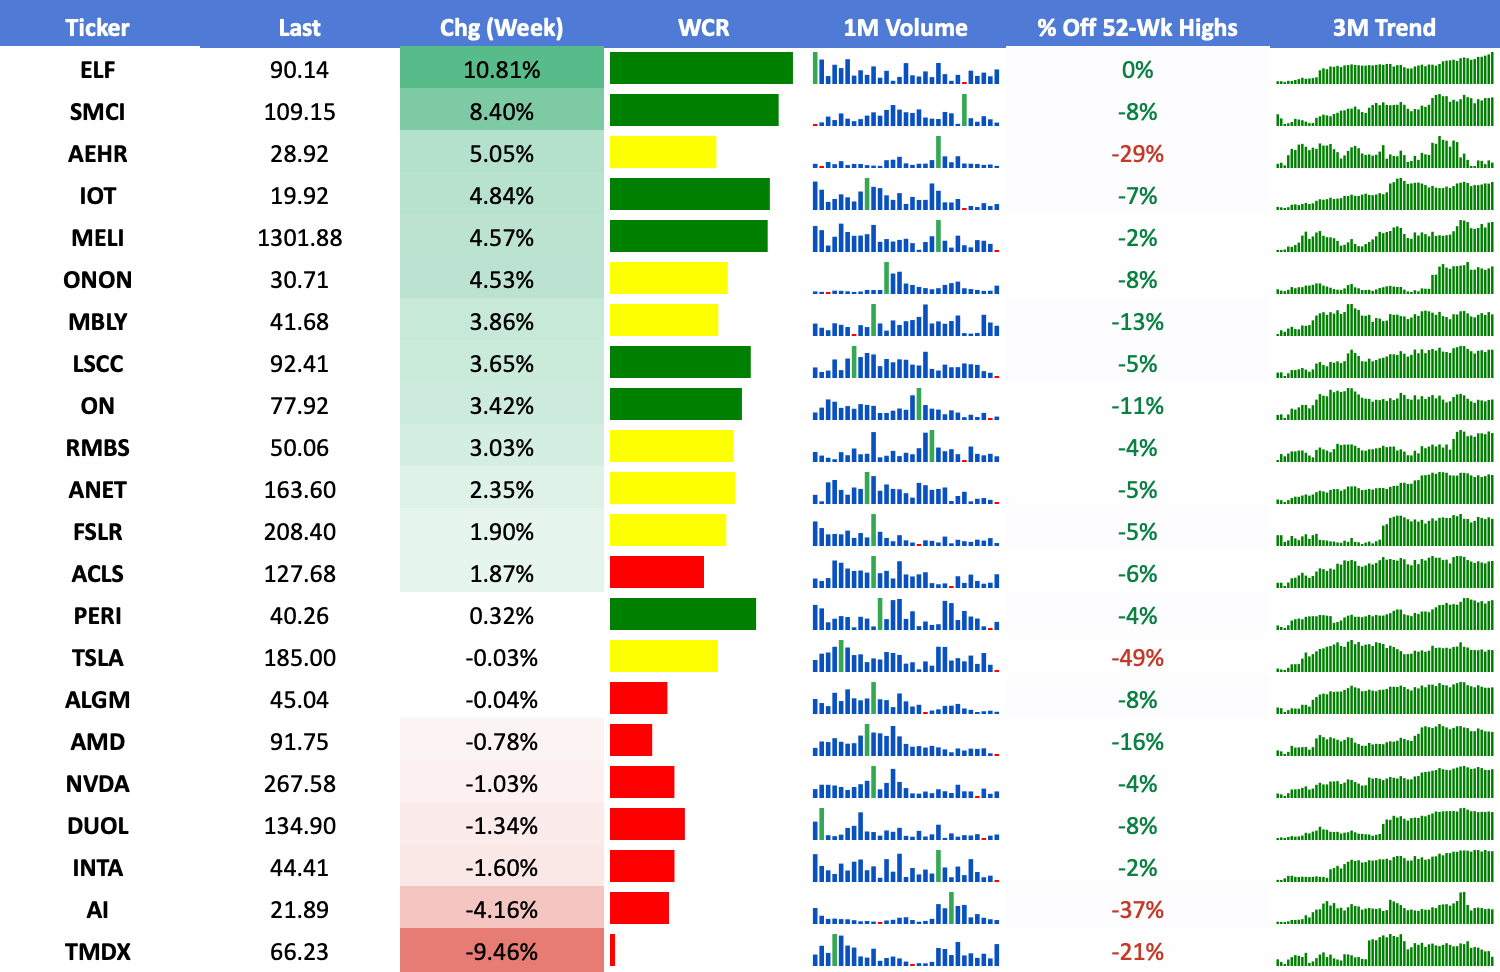
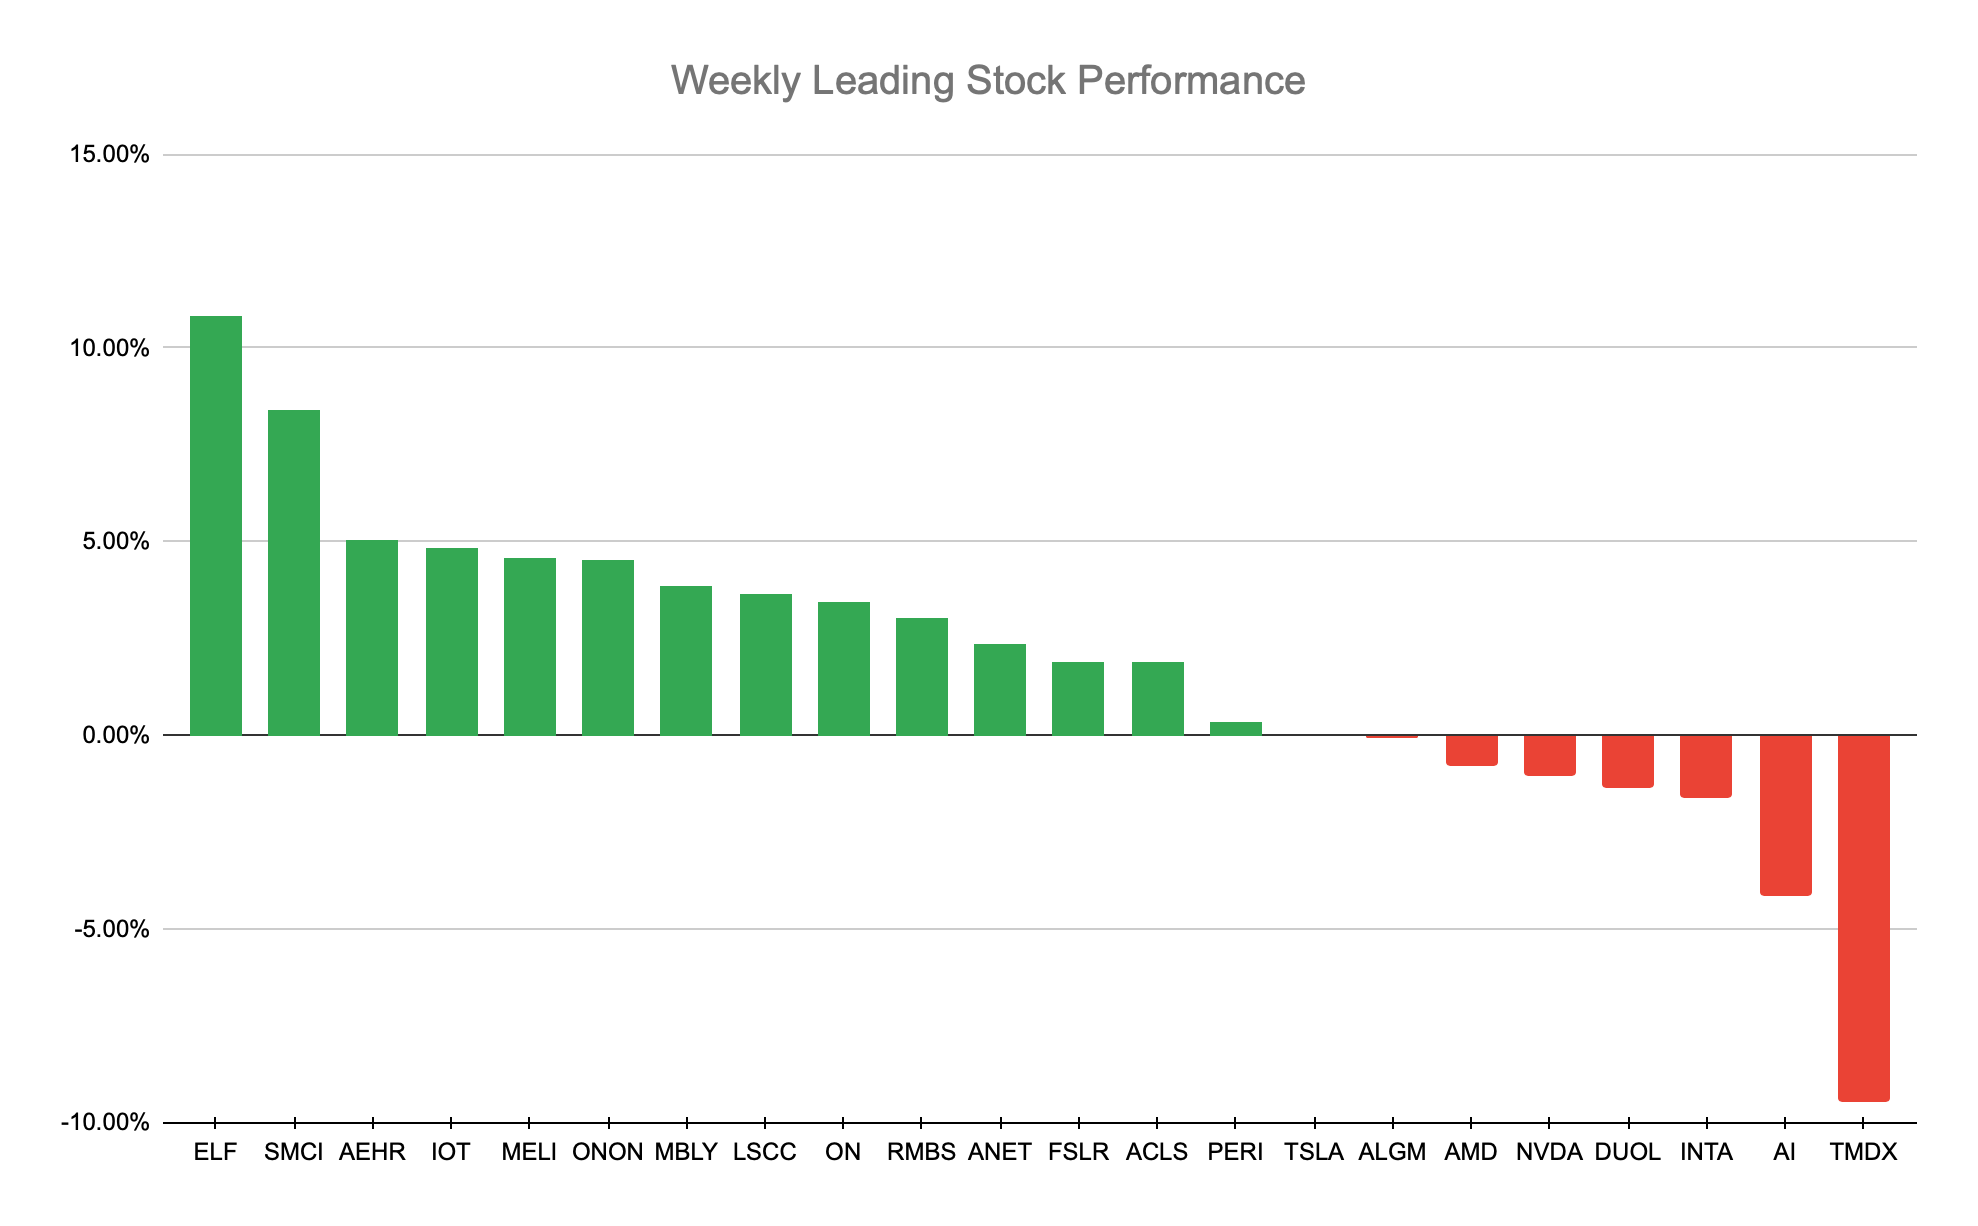
Leading Stocks Analysis
Session
I am linking the leaders watchlist in tradingview for your convenience, here
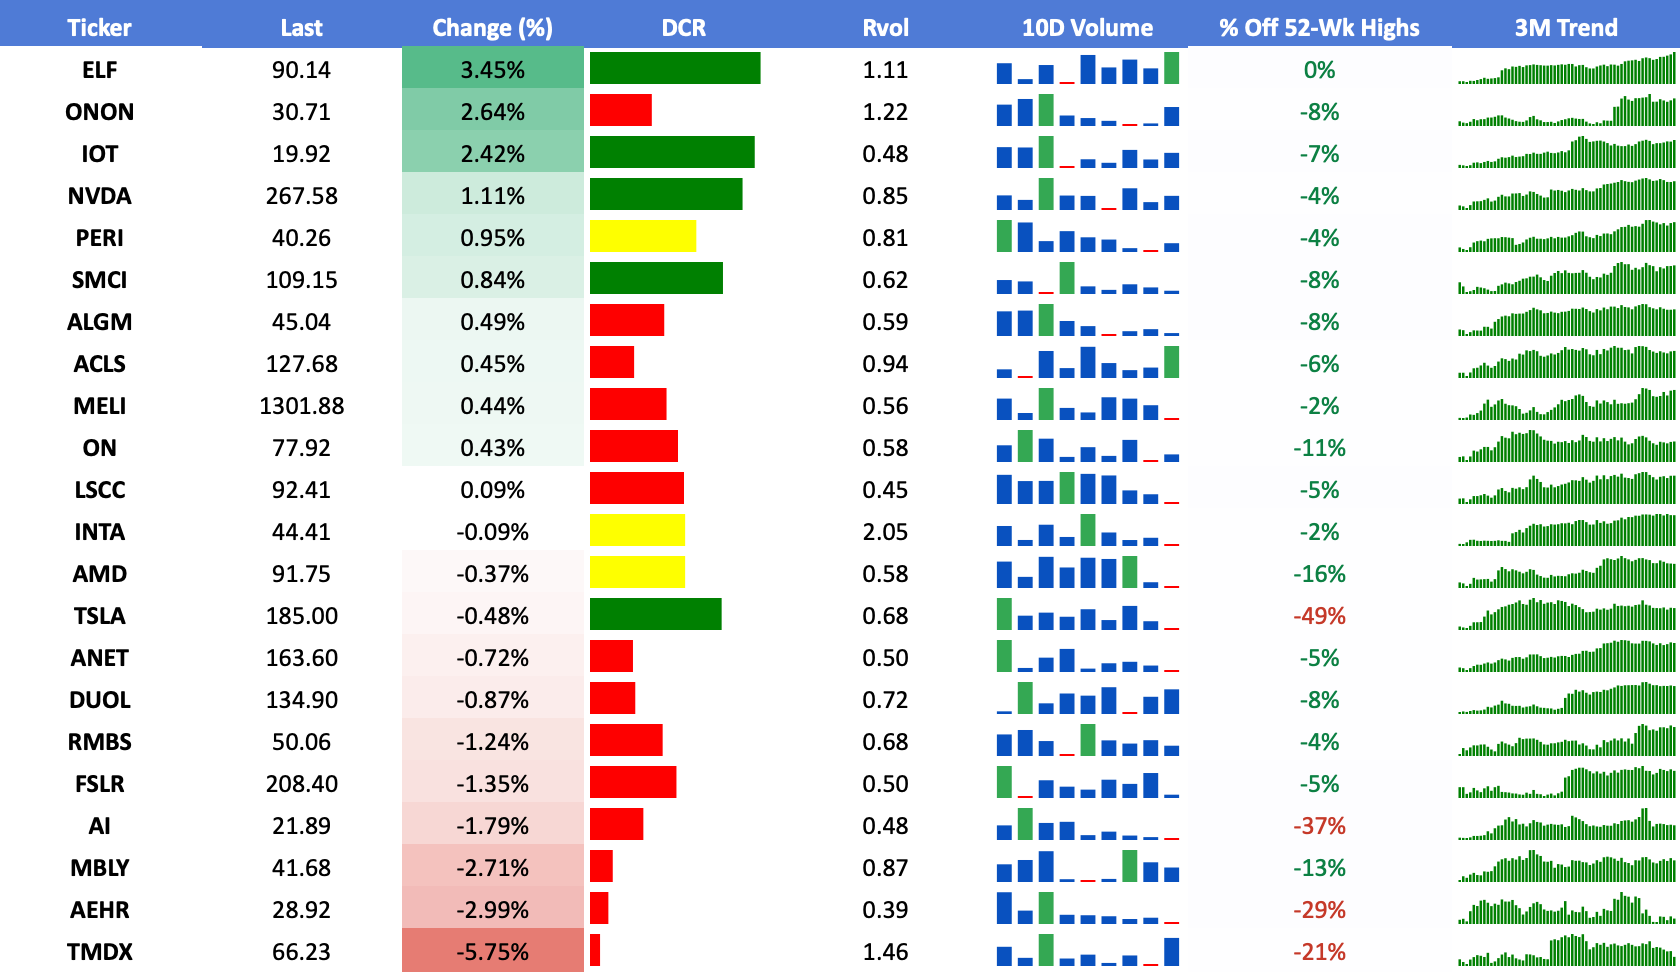
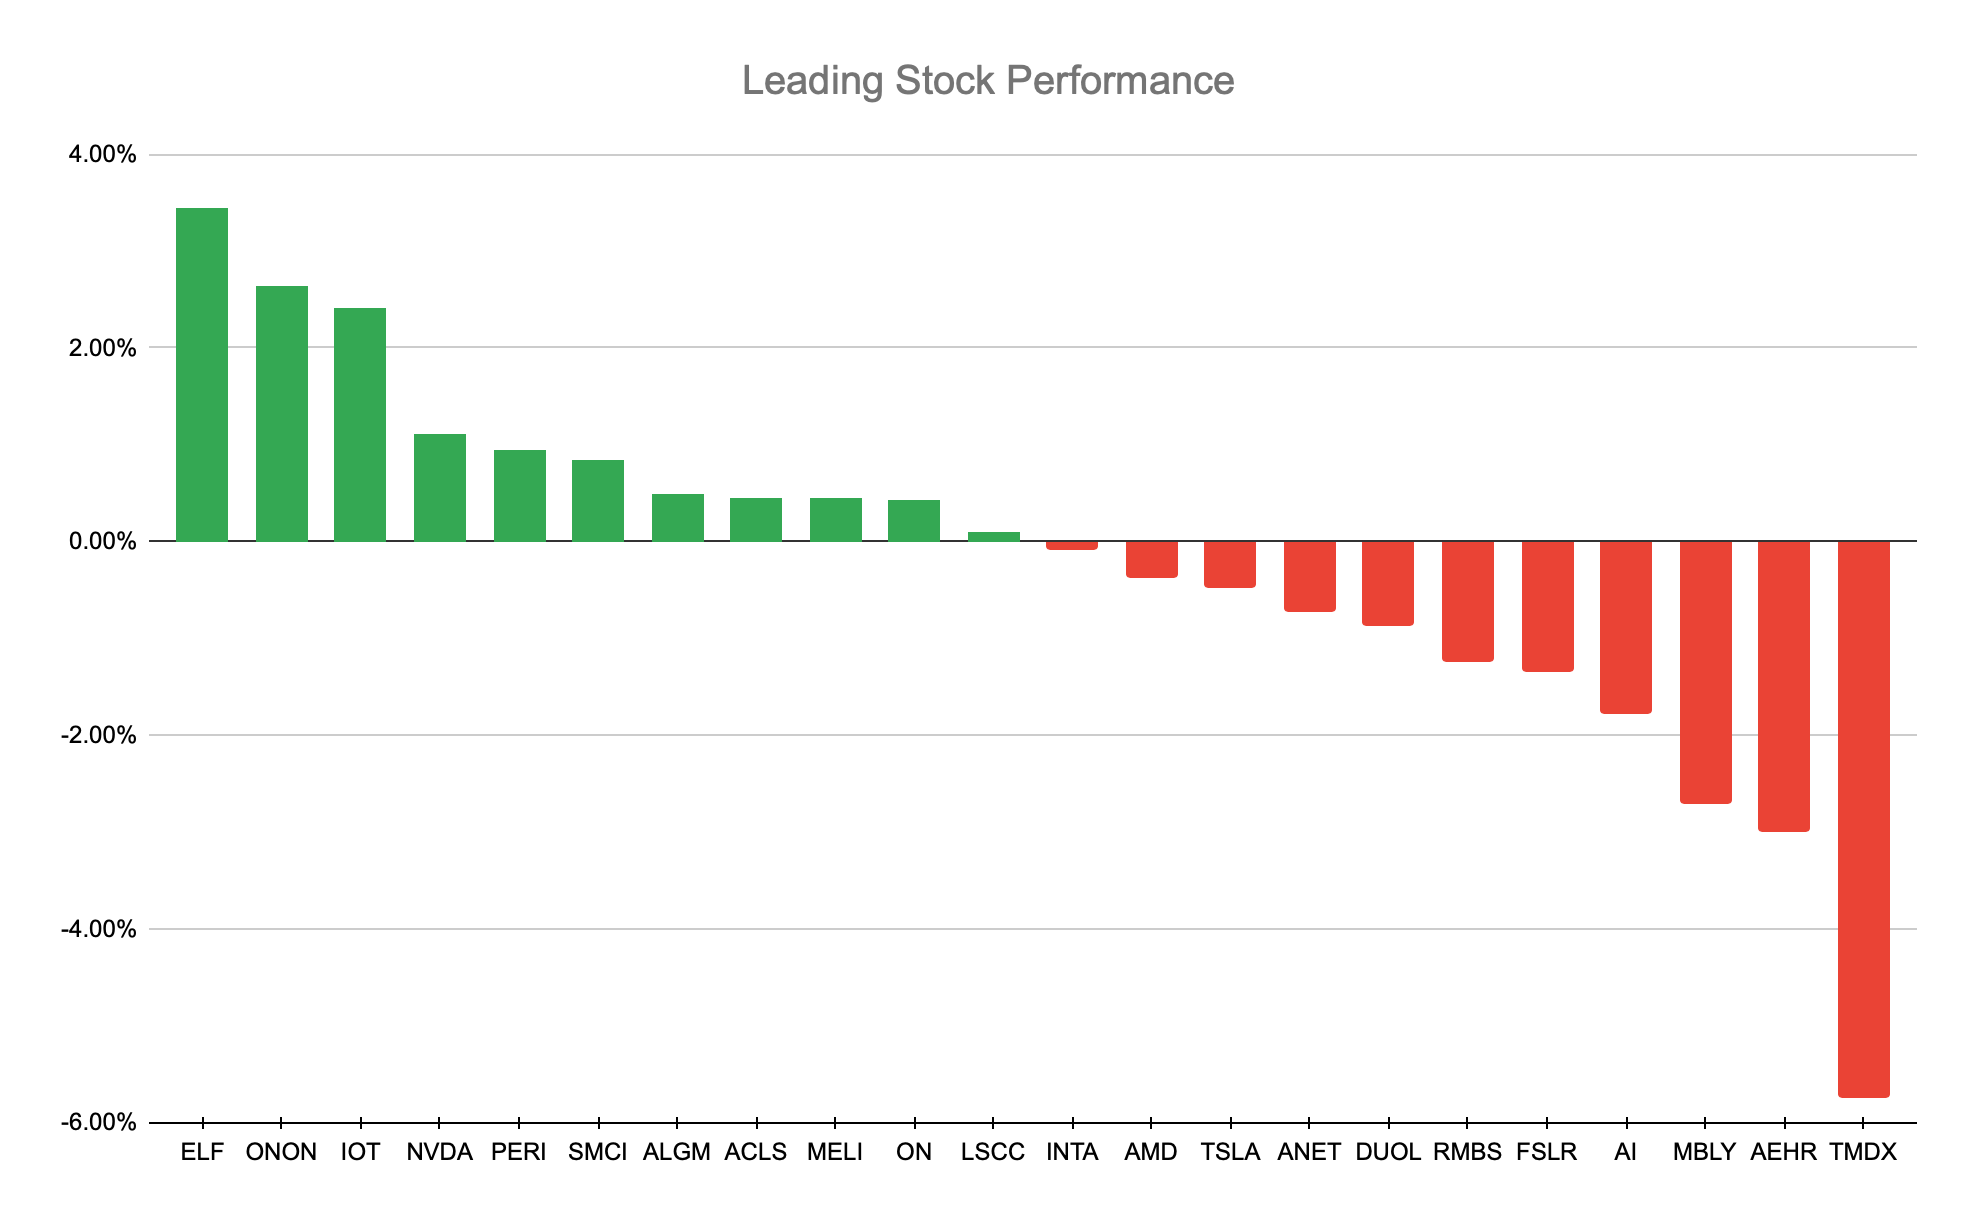
ELF 0.00%↑ Raw power since the recent base breakout above 76 and now +18% from there - getting slightly extended from KMAs with 6 up sessions in a row but encouraging to see such relative strength:

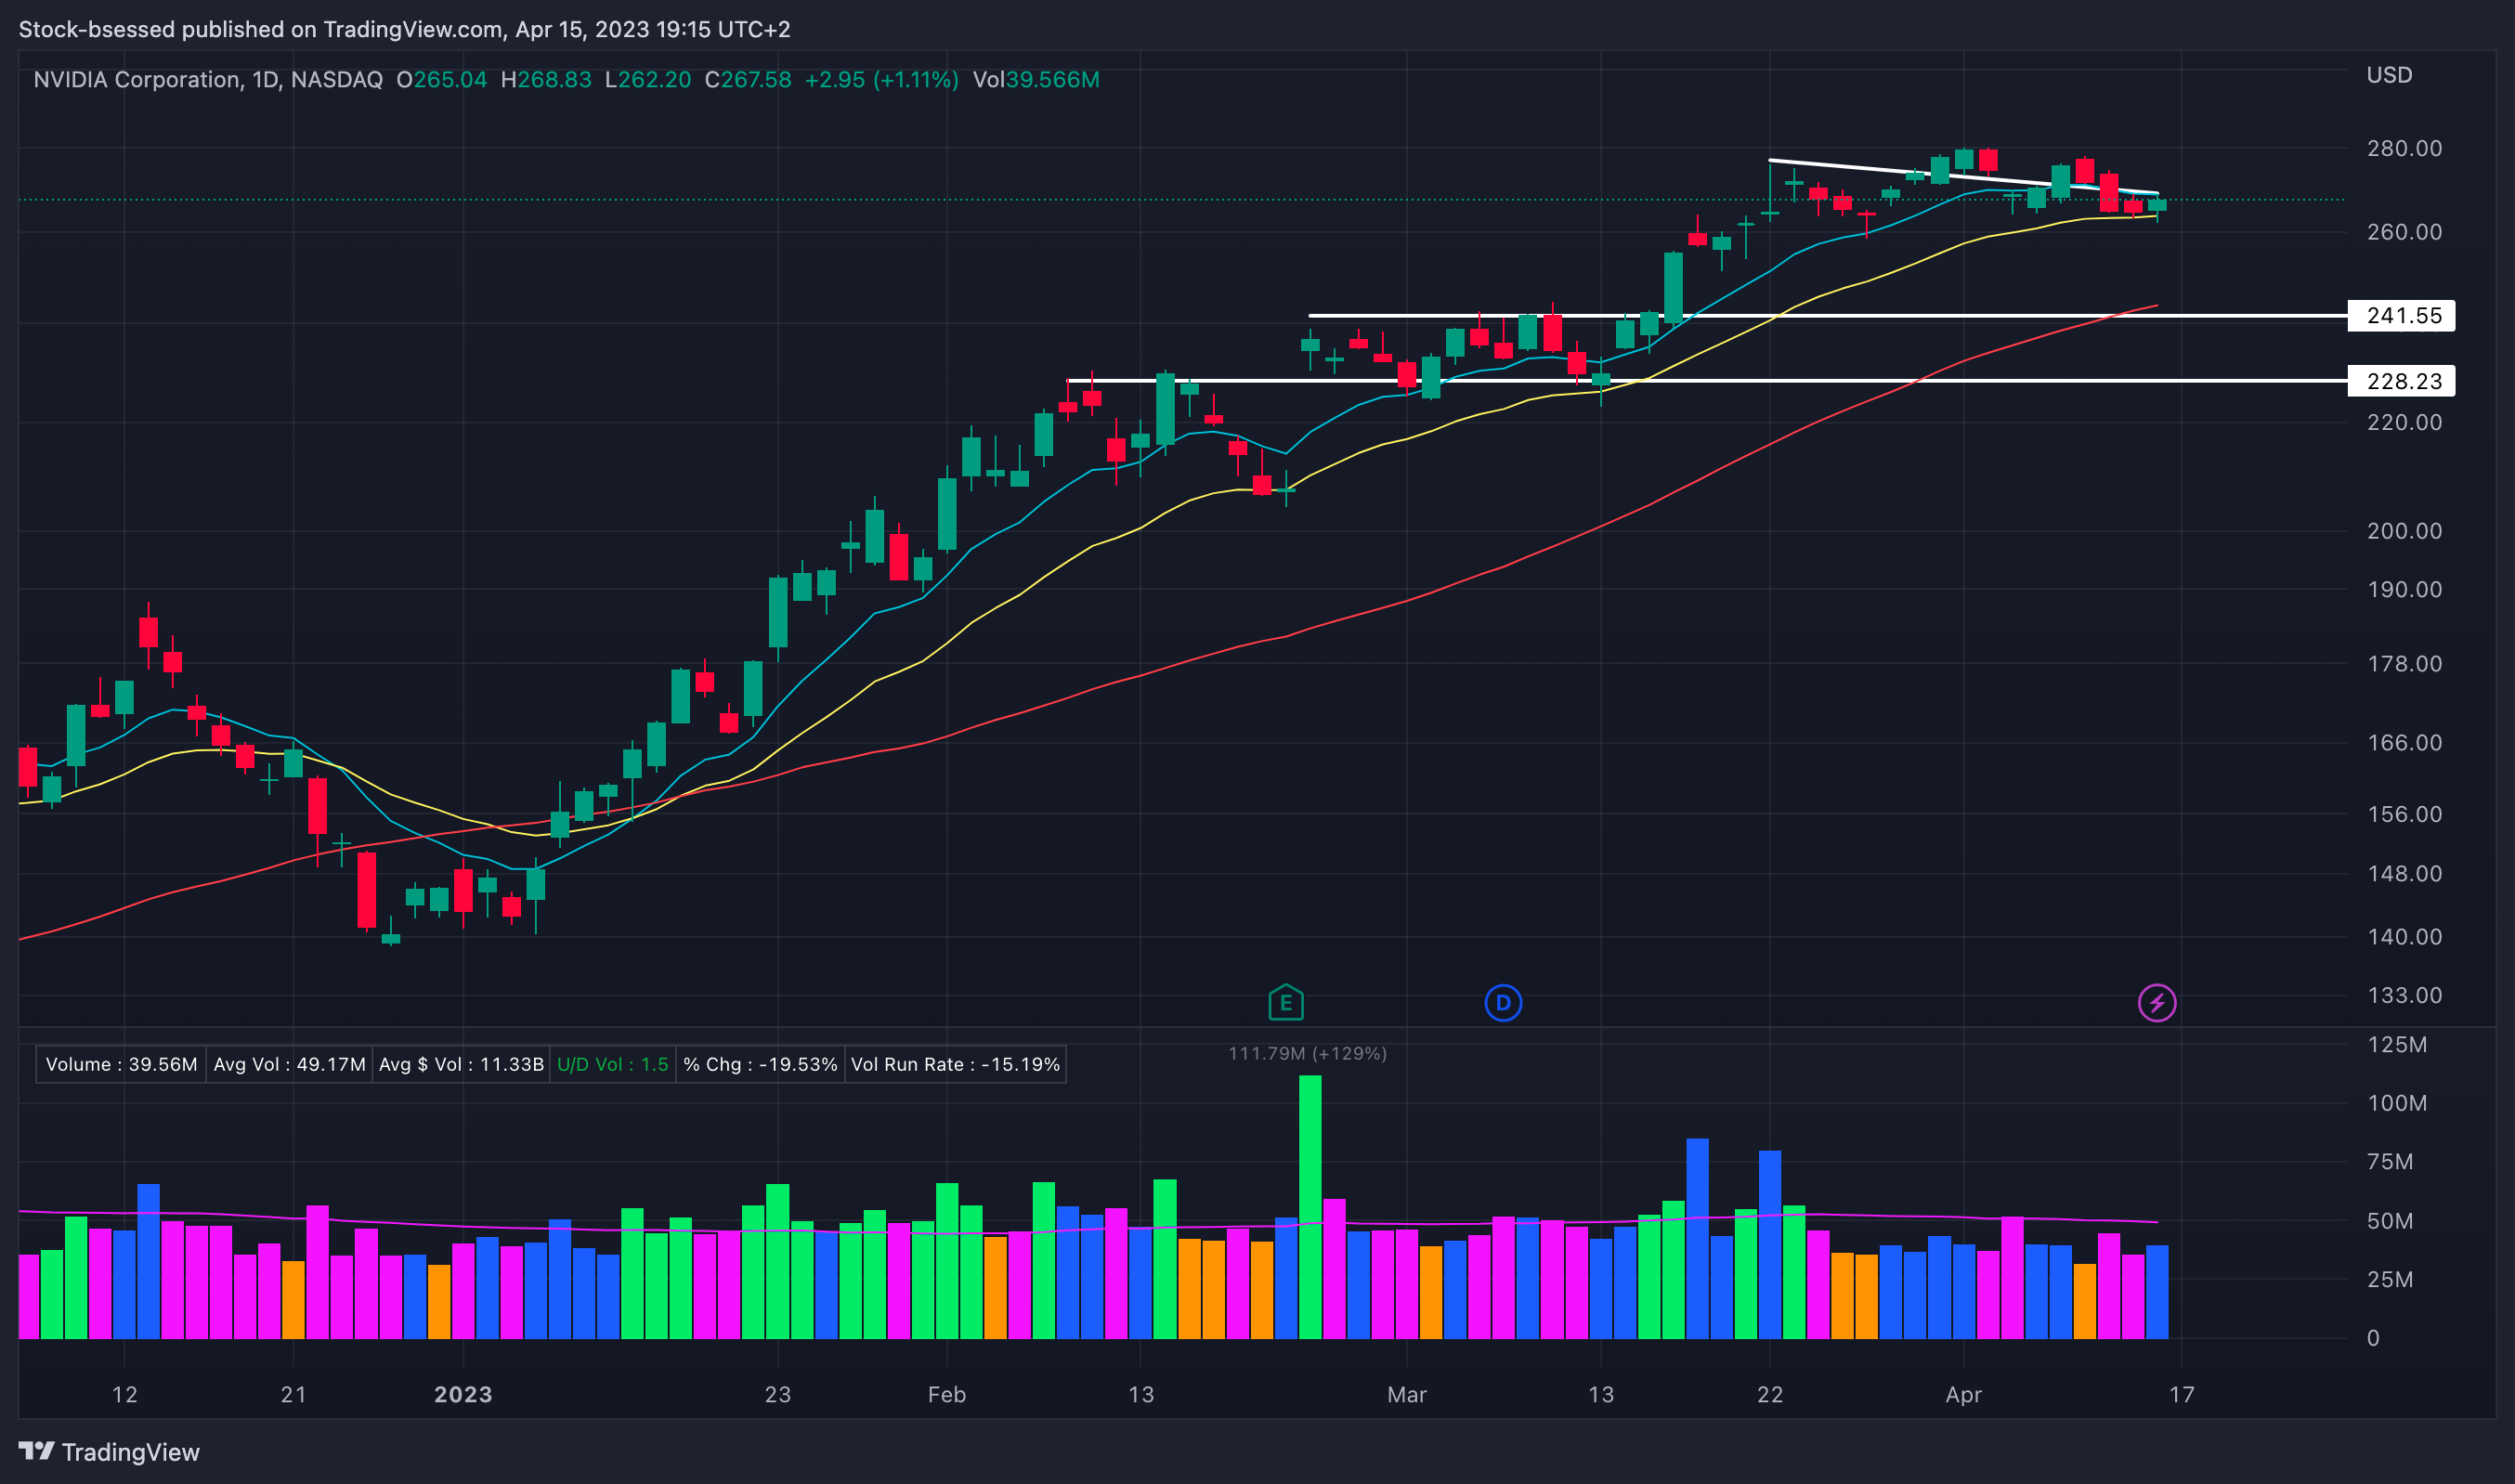
NVDA 0.00%↑ Held where it needed to around the 20EMA with a nice undercut and rally to close above and strong on the session. Now setting up under this descending trend line and will be monitoring action on a push above this ~269 area:
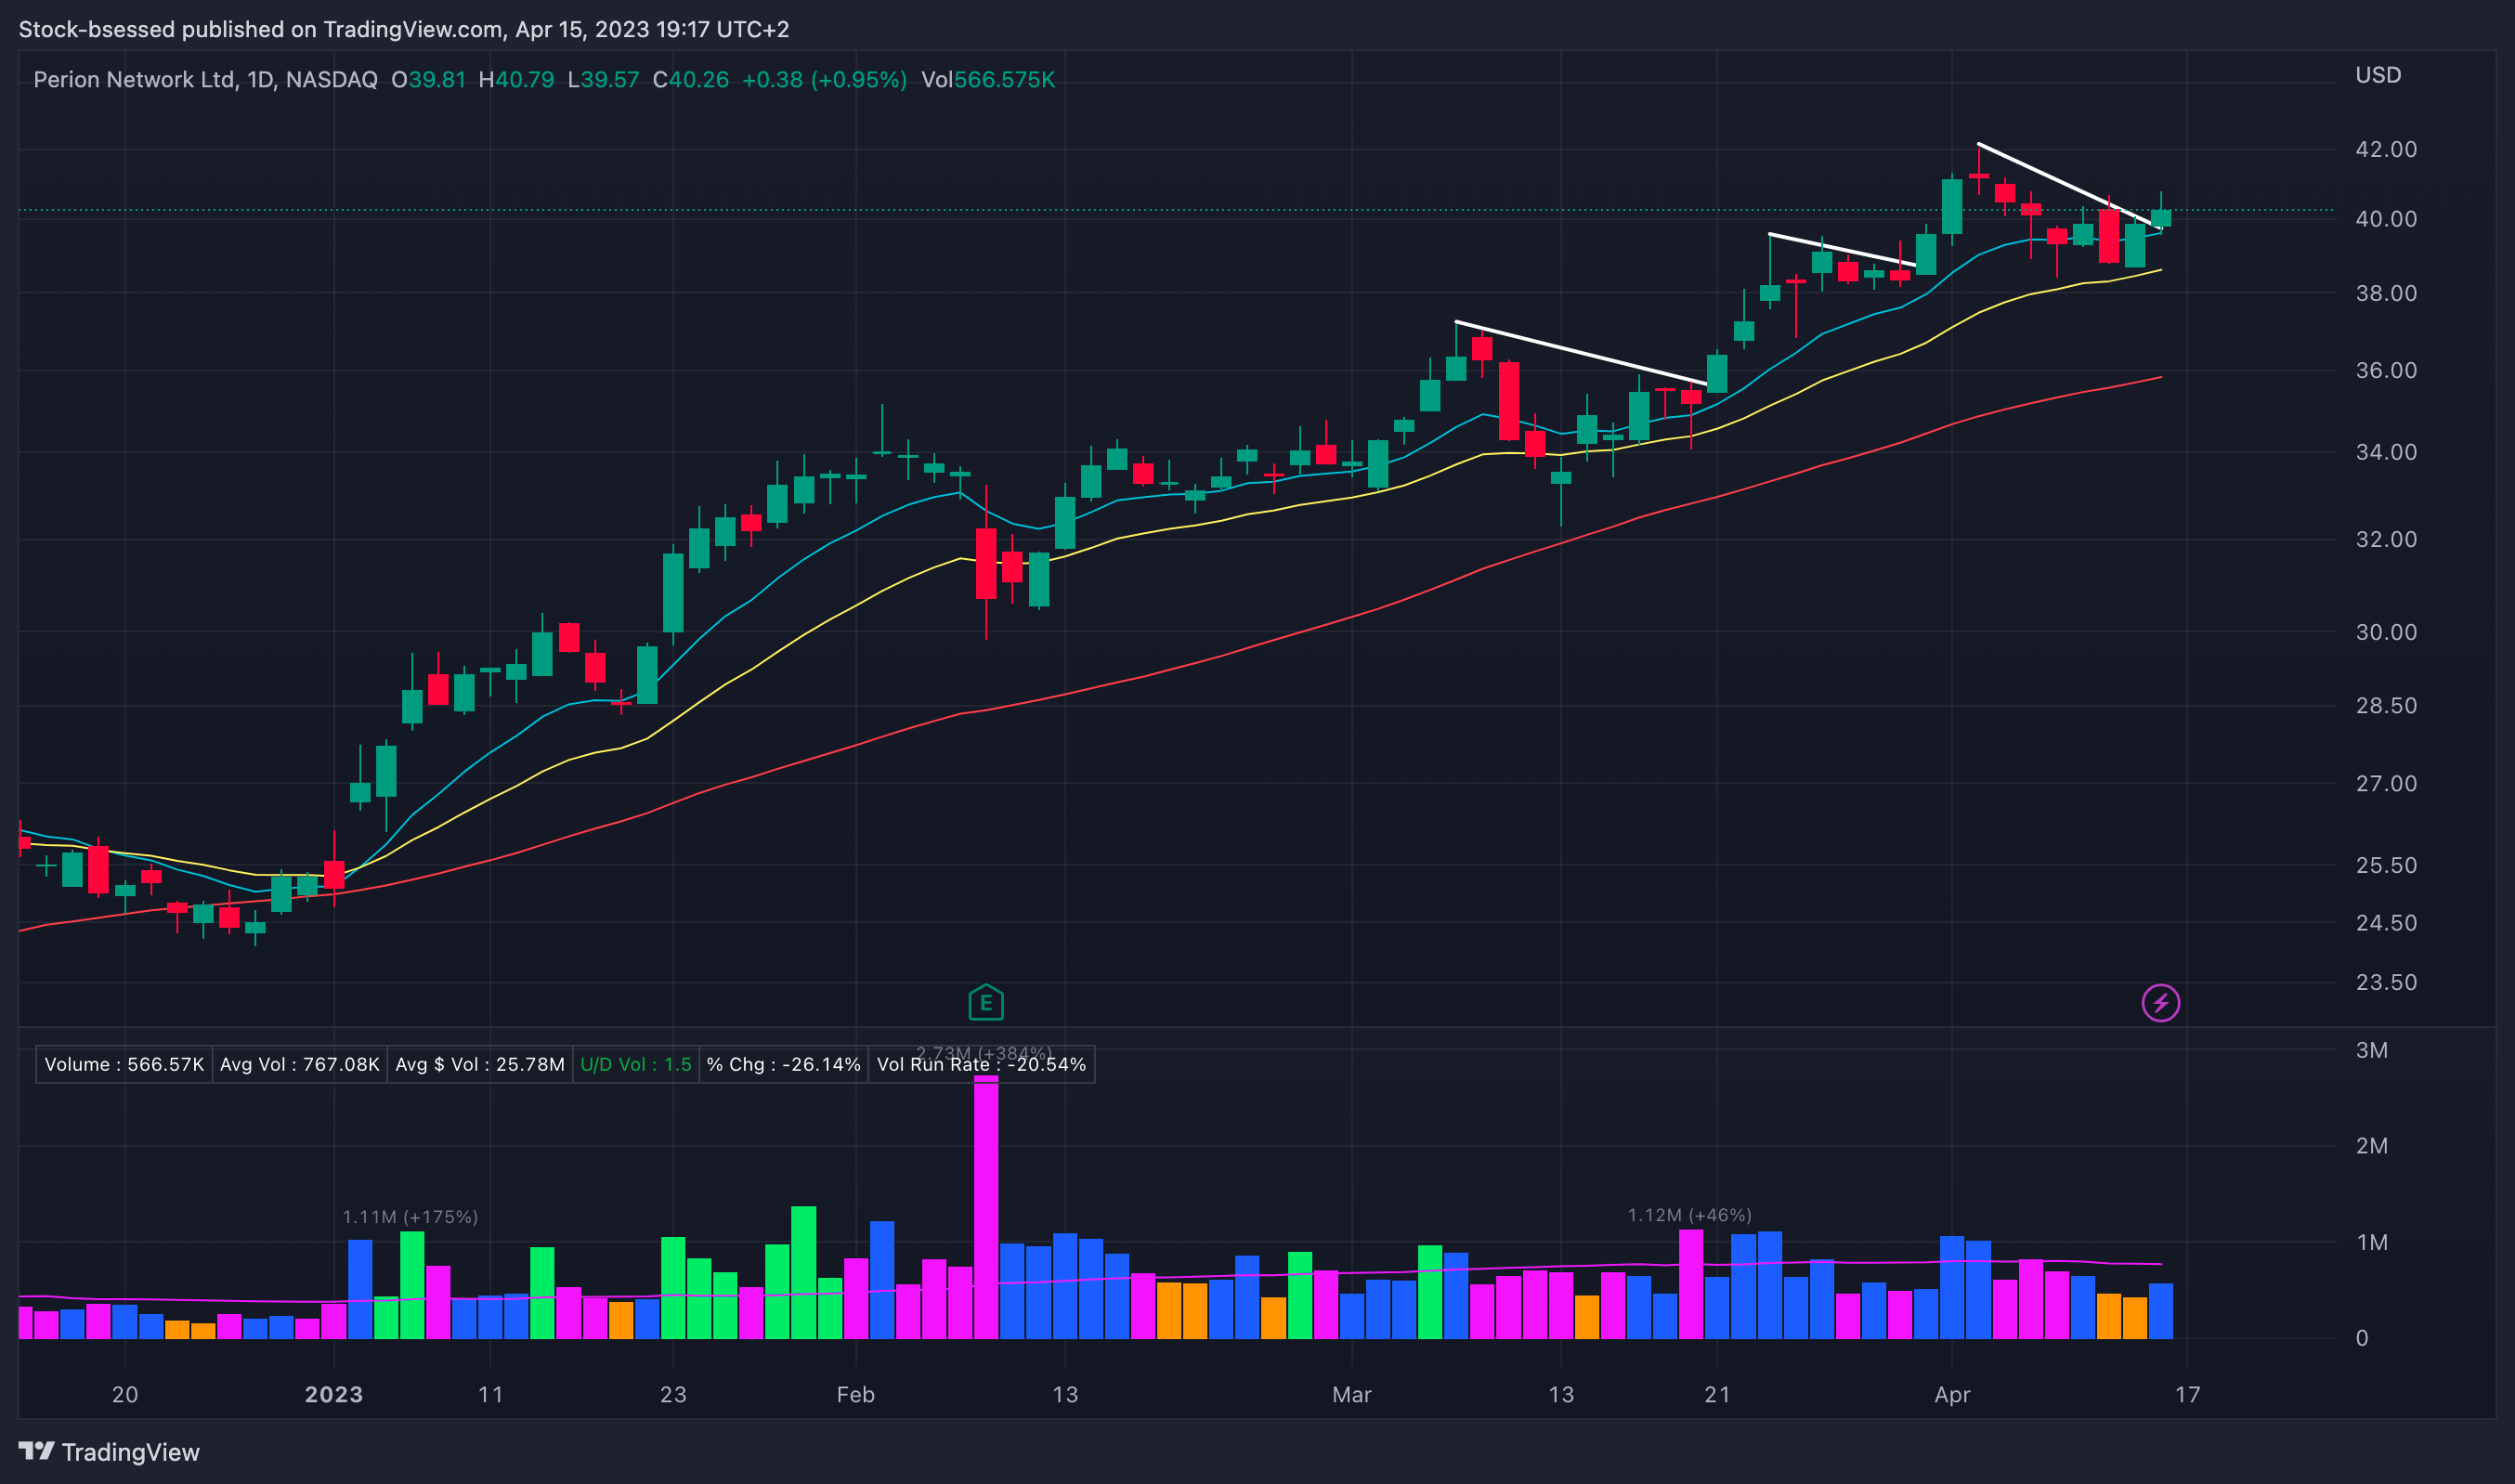
PERI 0.00%↑ Continued the recent trend of forming and breaking out above descending trend lines
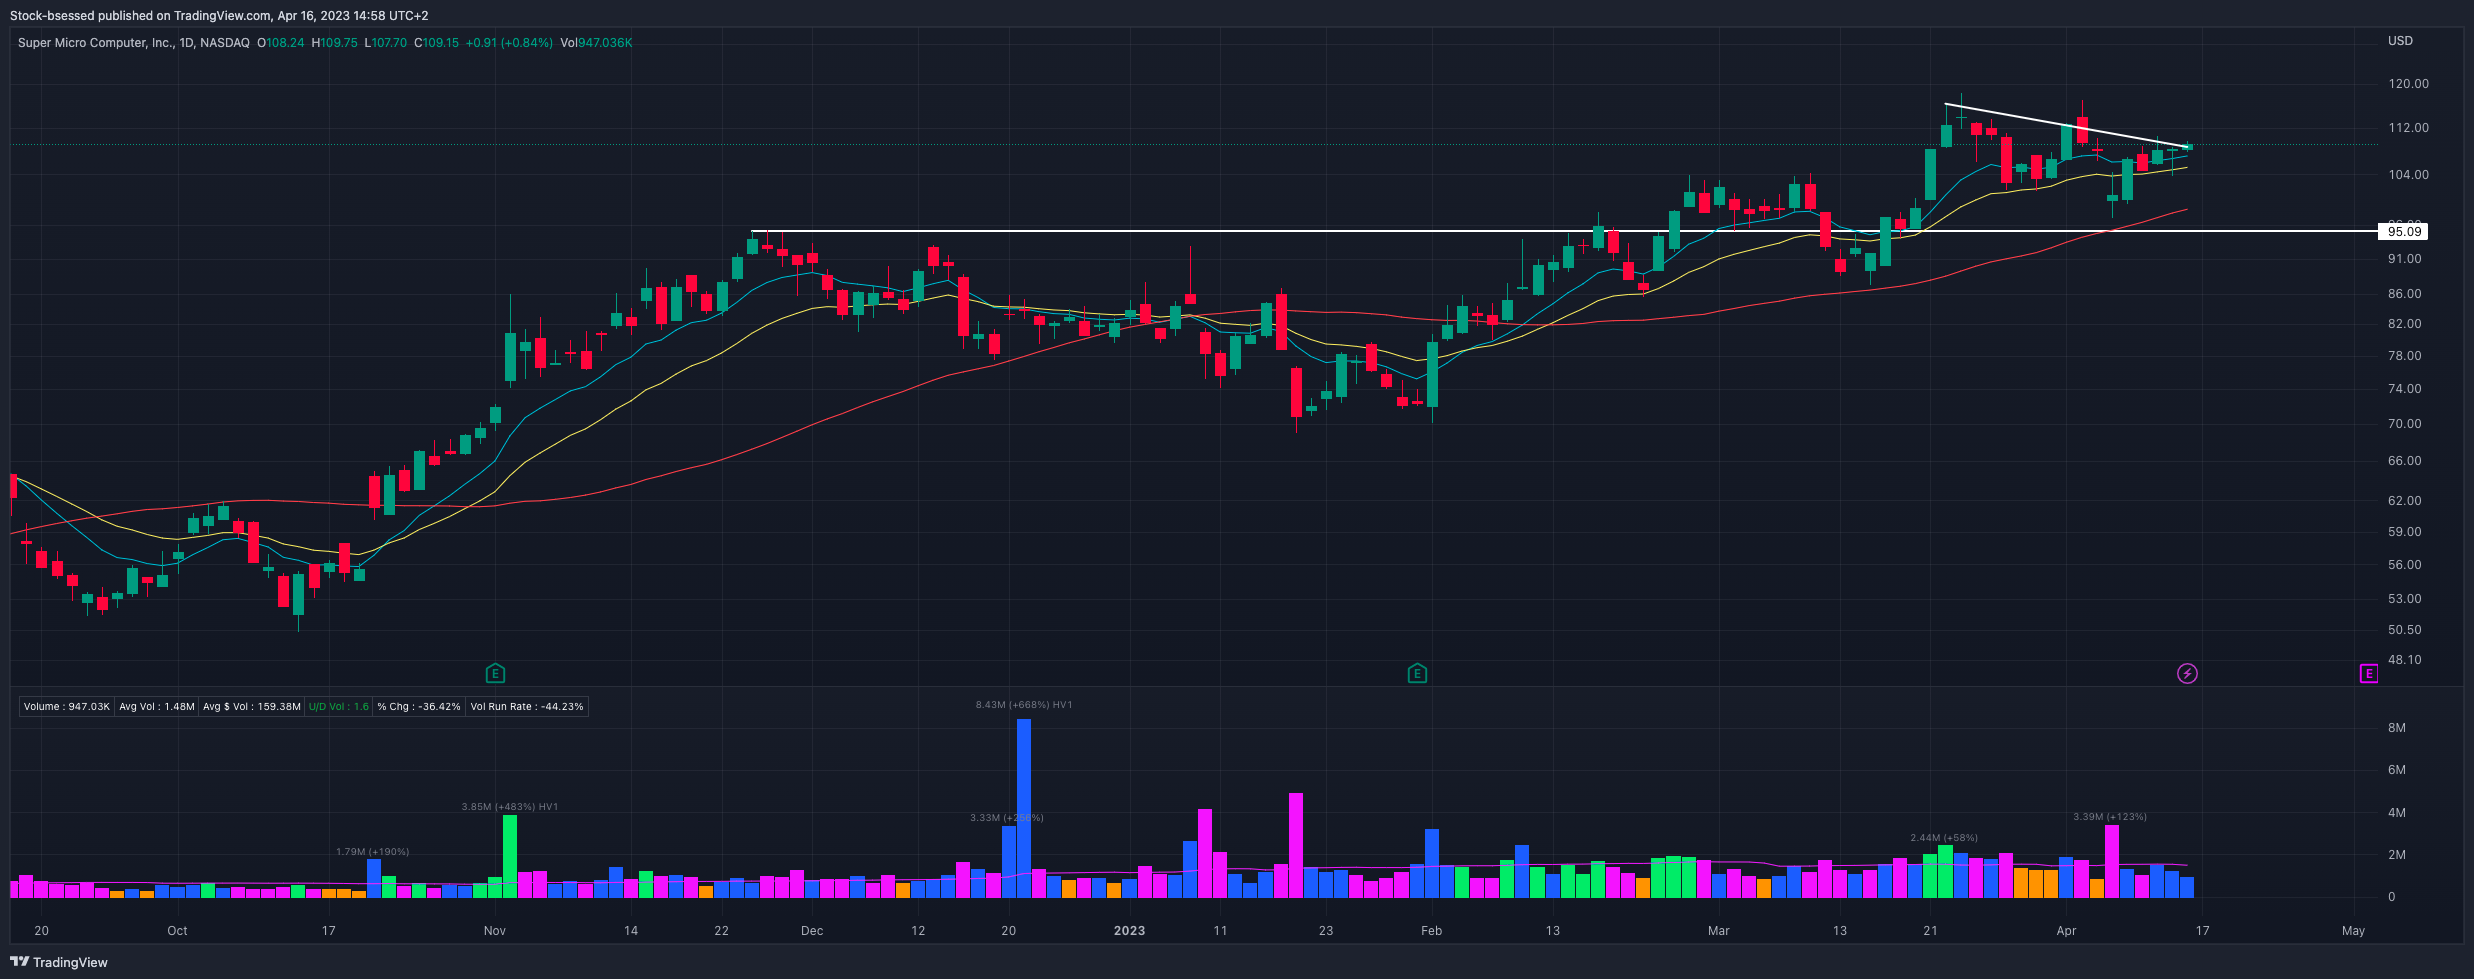
SMCI 0.00%↑ Acting pretty well here and tried a position last session on this descending trend line setup but ended up closing this for a small win into the close as I did not get the push I wanted to see in order to justify taking on additional risk over the weekend:

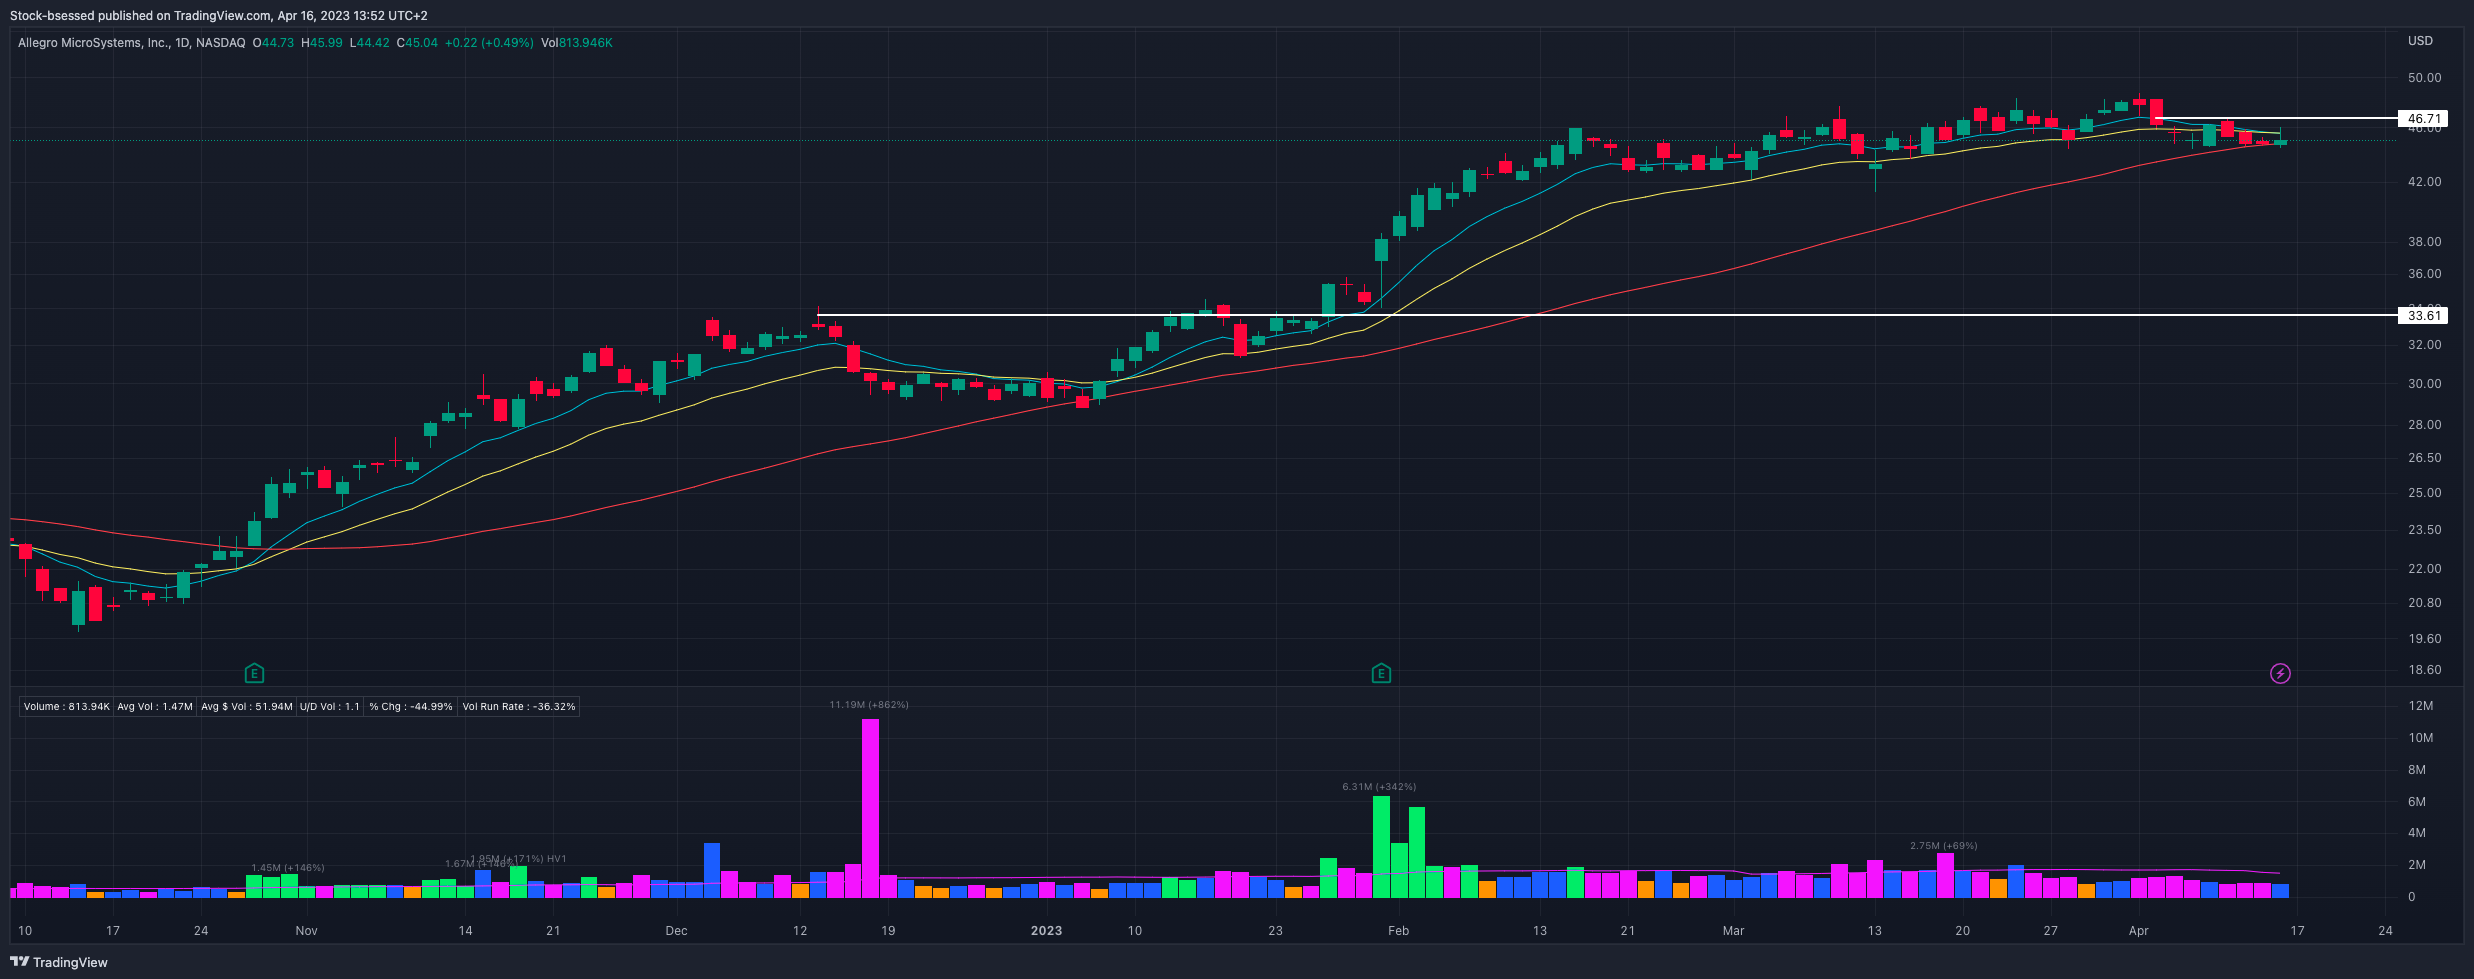
ALGM 0.00%↑ Tried to push off the 50-day moving average well but got pinned down by sellers that came in around the 10/20 EMA:
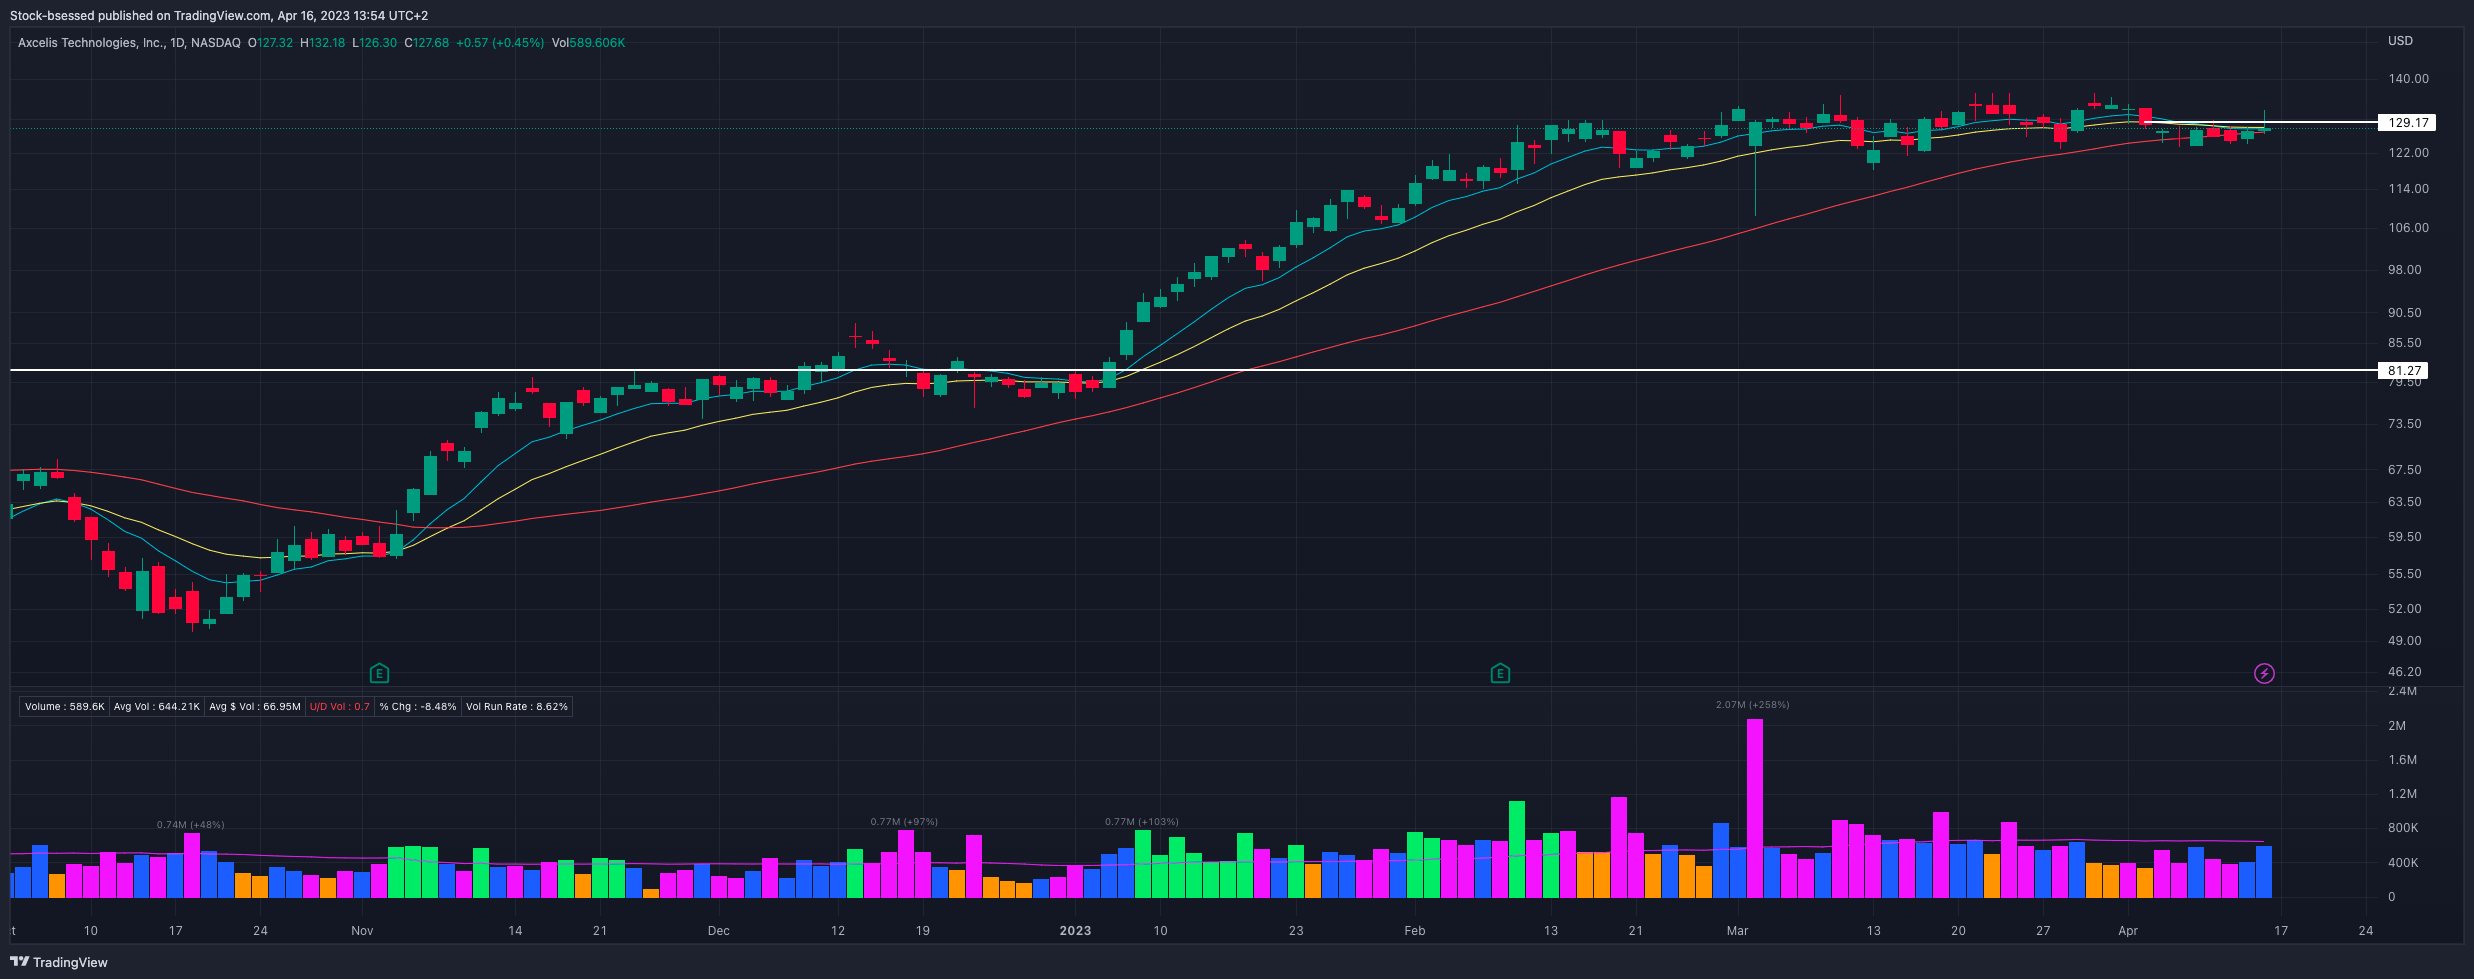
ACLS 0.00%↑ Similar to above:
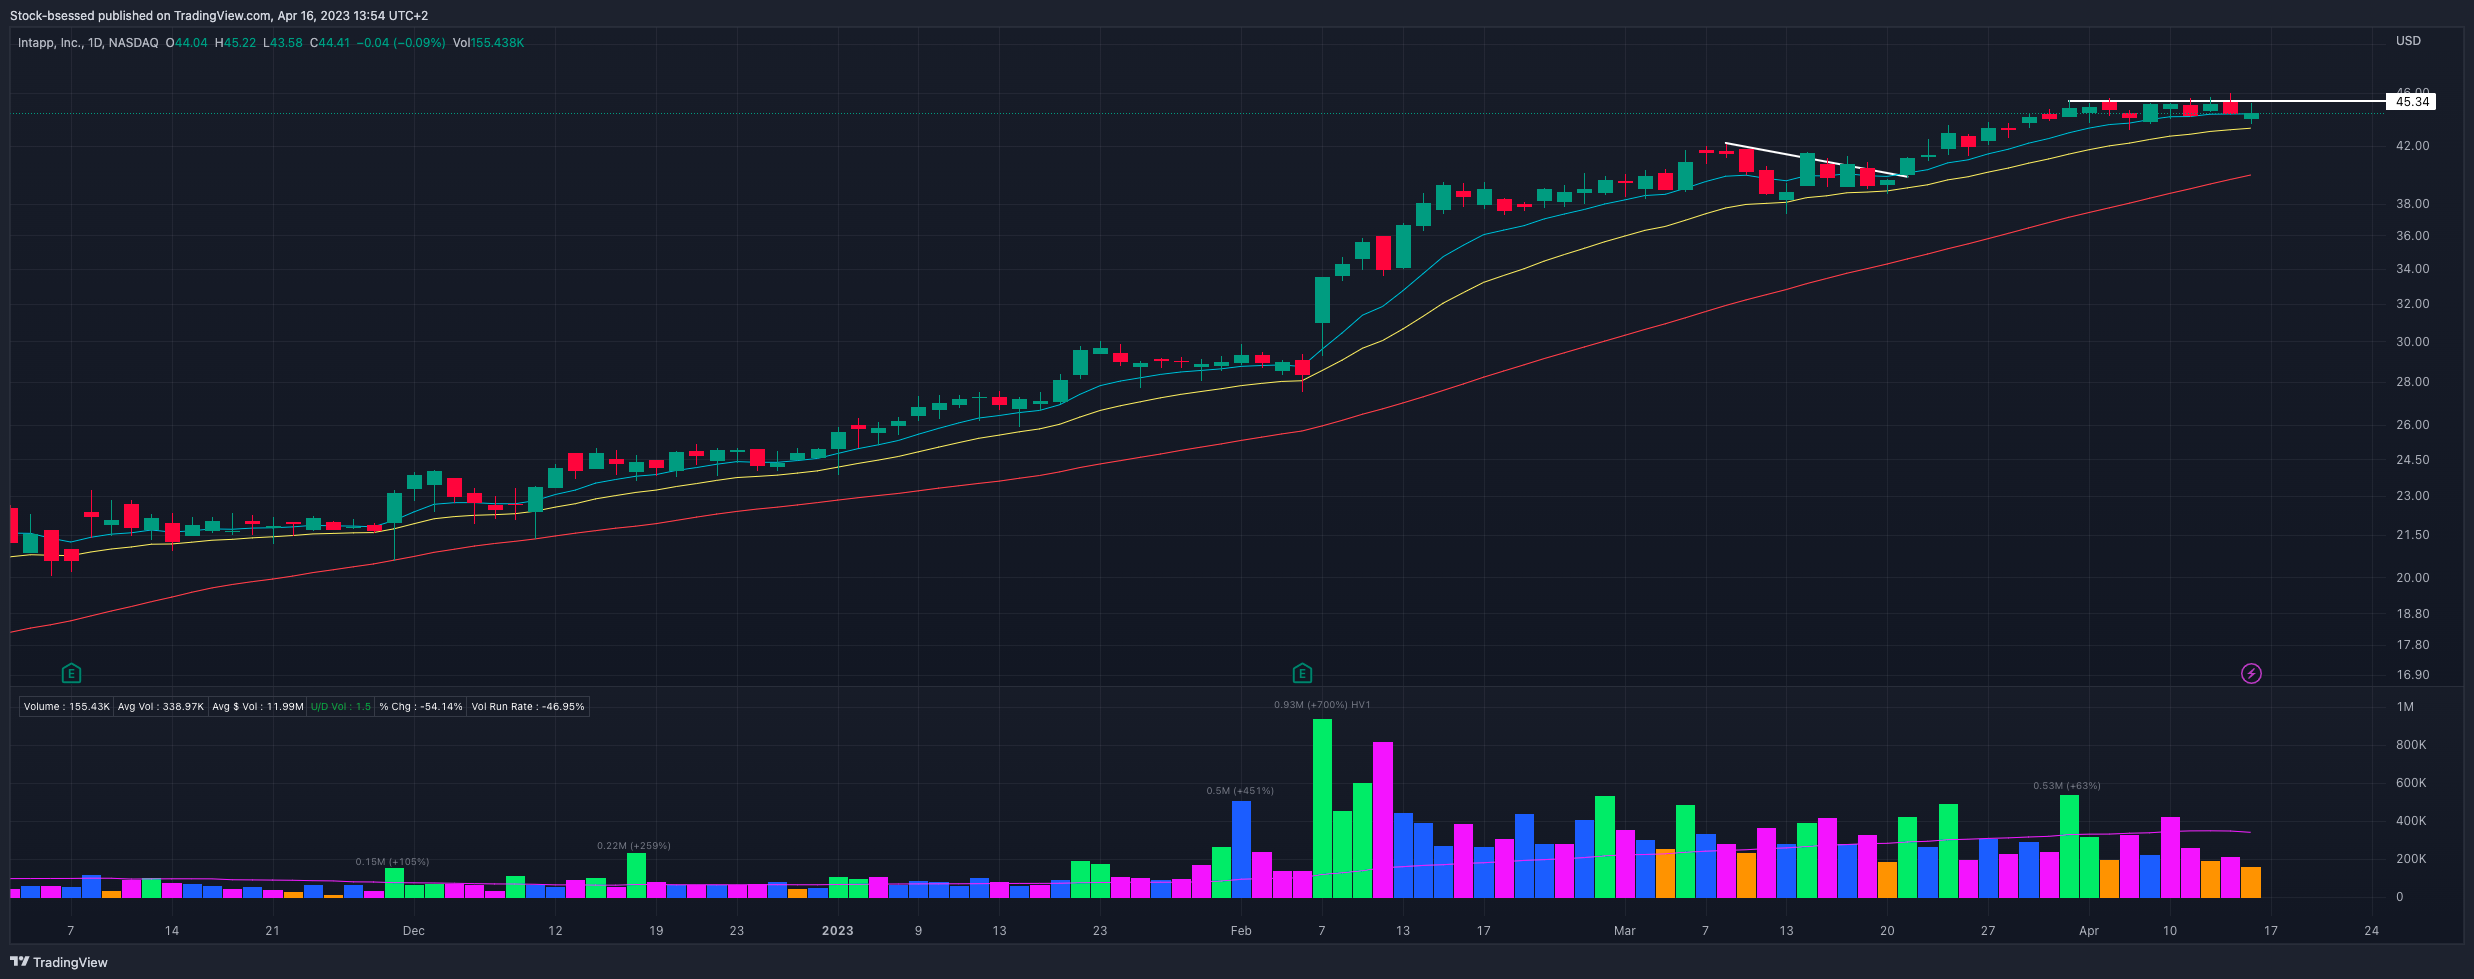
INTA 0.00%↑ Positive reaction off the 20 EMA but got sold down intra-day at the prior resistance around 45.3:
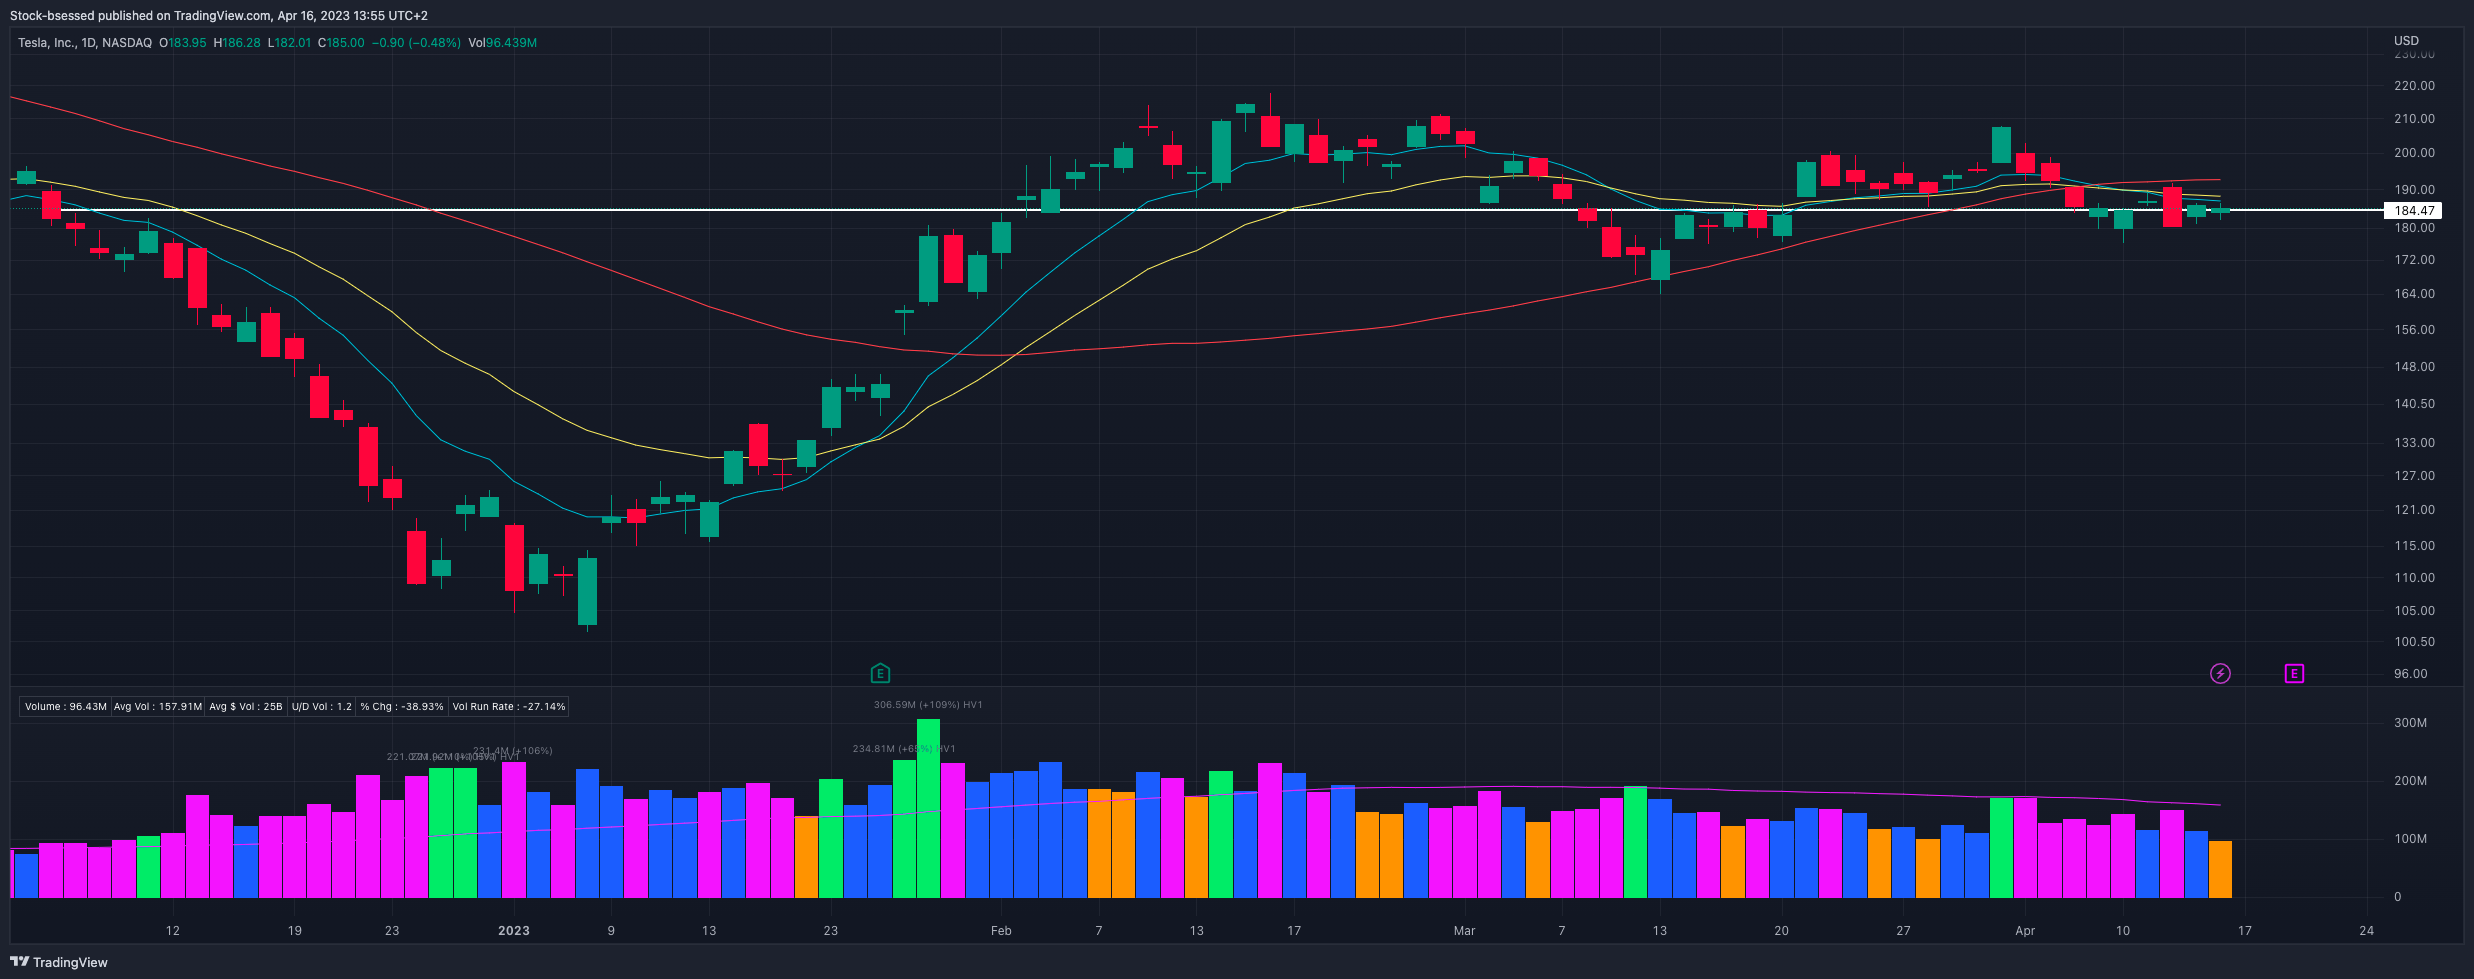
TSLA 0.00%↑ Closes well within this inside day but still lingering below the key moving averages - would like to see this push above rather quickly and reclaim these key areas as it currently hovers around prior resistance:
RMBS 0.00%↑ Acting very well up here at its highs with well-defined levels. Buyers continue to support this around the 10EMA while sellers pin this down at resistance around 51.15. Consolidating well with excellent price and volume charactersistics and clear relative strength - this is one to keep your eyes on:

FSLR 0.00%↑ Still coming together well here as it consolidates around recent highs and attempts to set a pivot around 213.5. Closes back above the 20EMA with this inside day last session as it attempts to tighten up here:

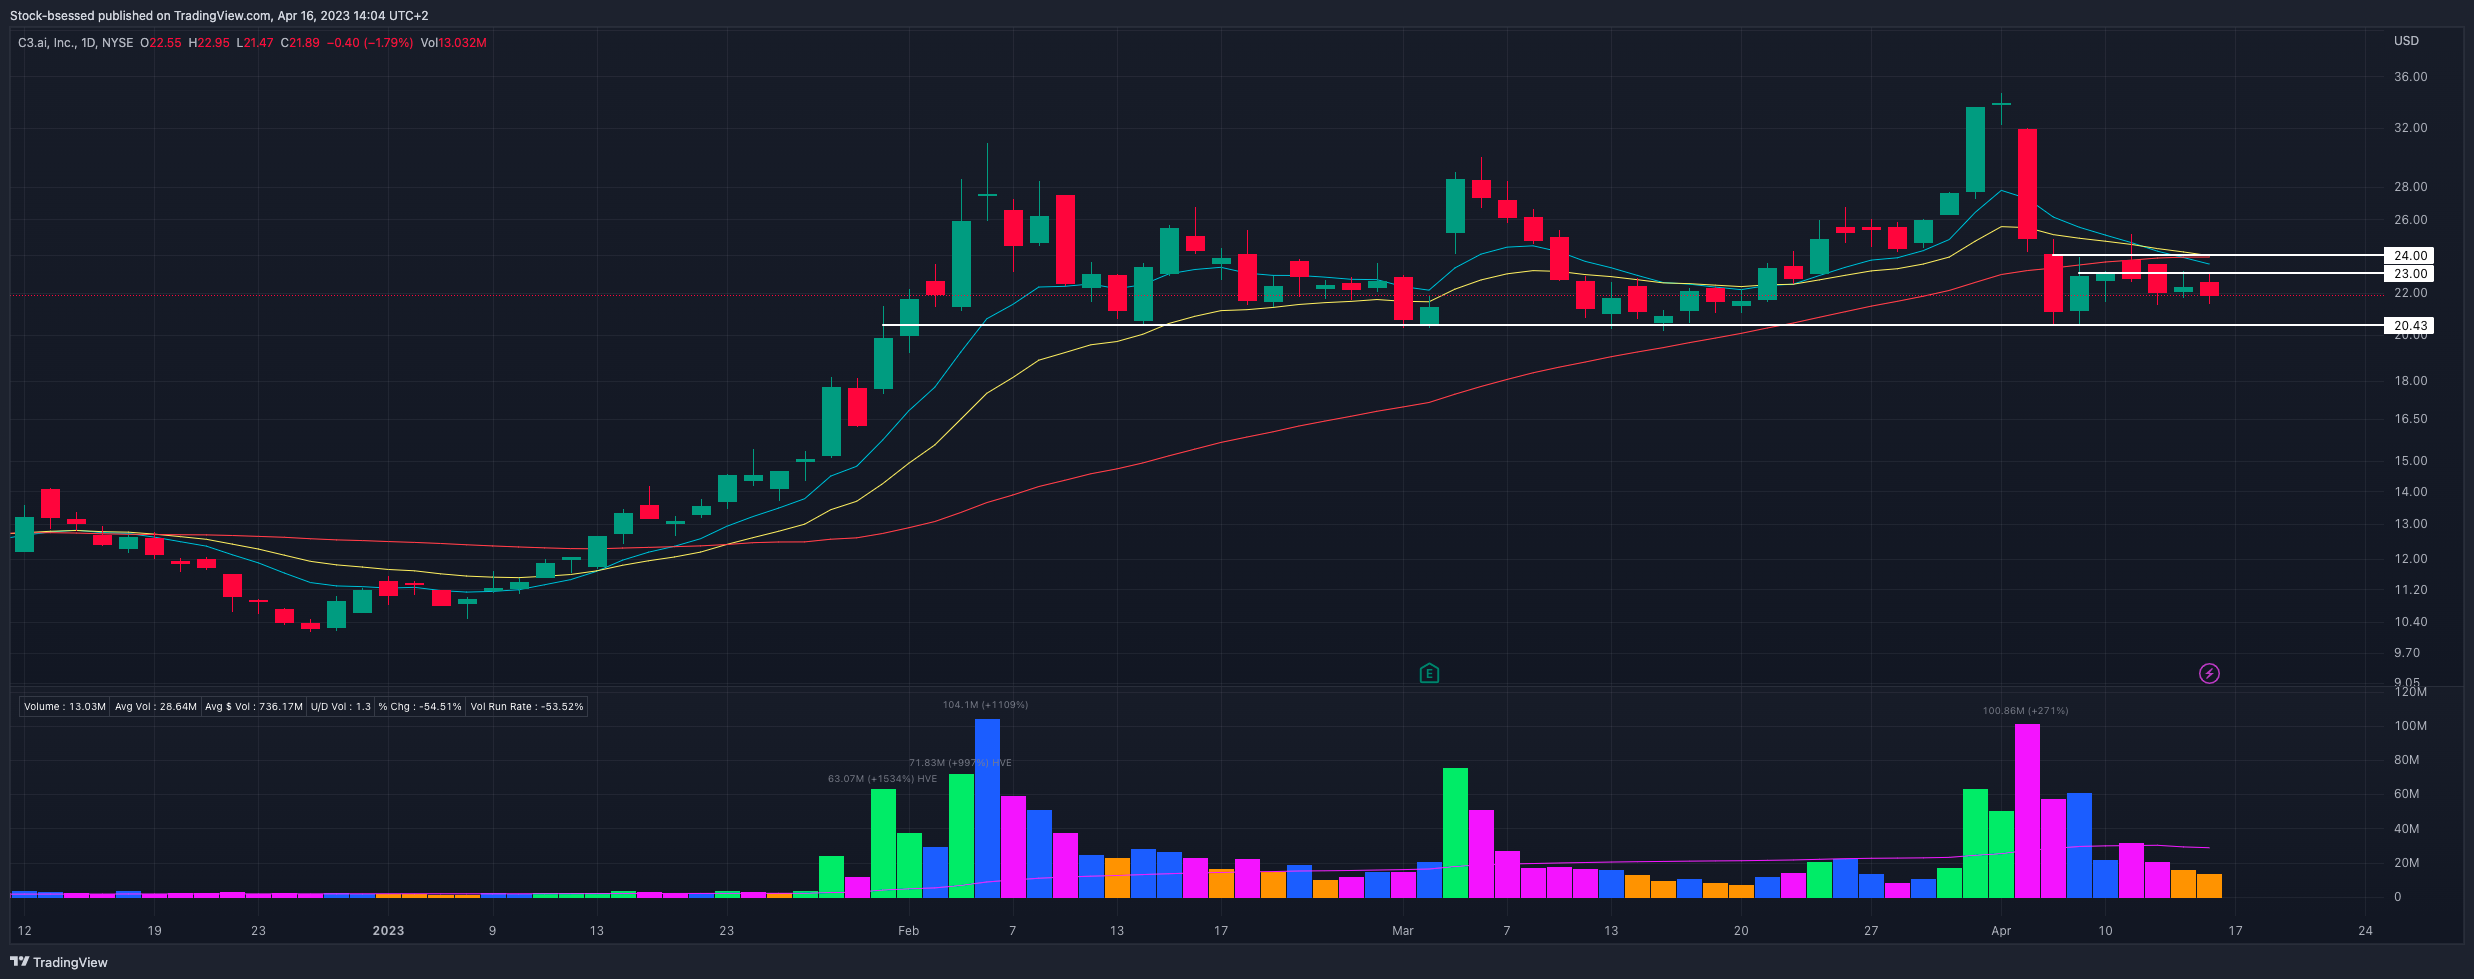
AI 0.00%↑ Still choppy but the way I'm seeing it is with some well-defined levels around 23 and 24 to the upside while watching how weakness is dealt with around 20.50:
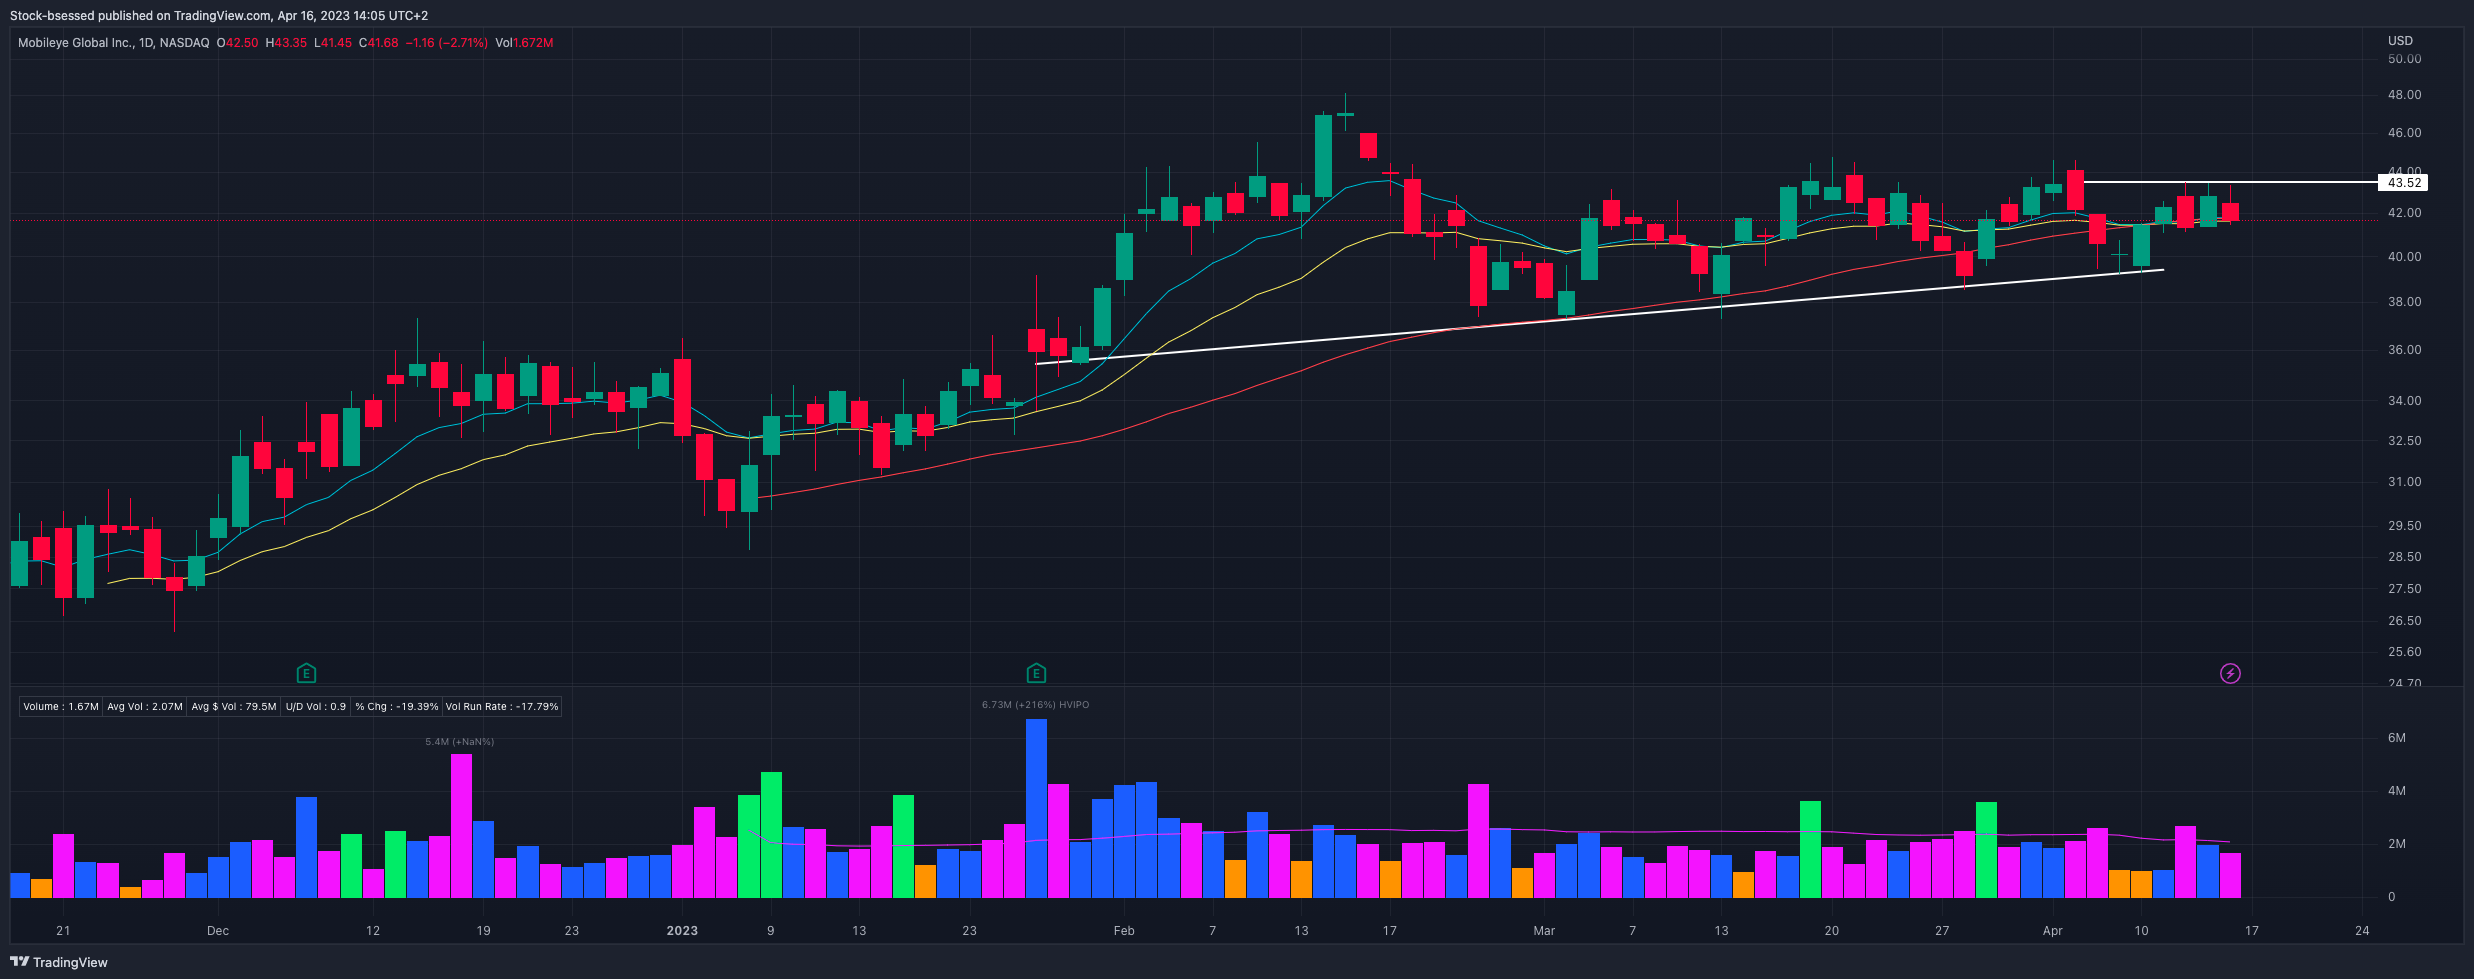
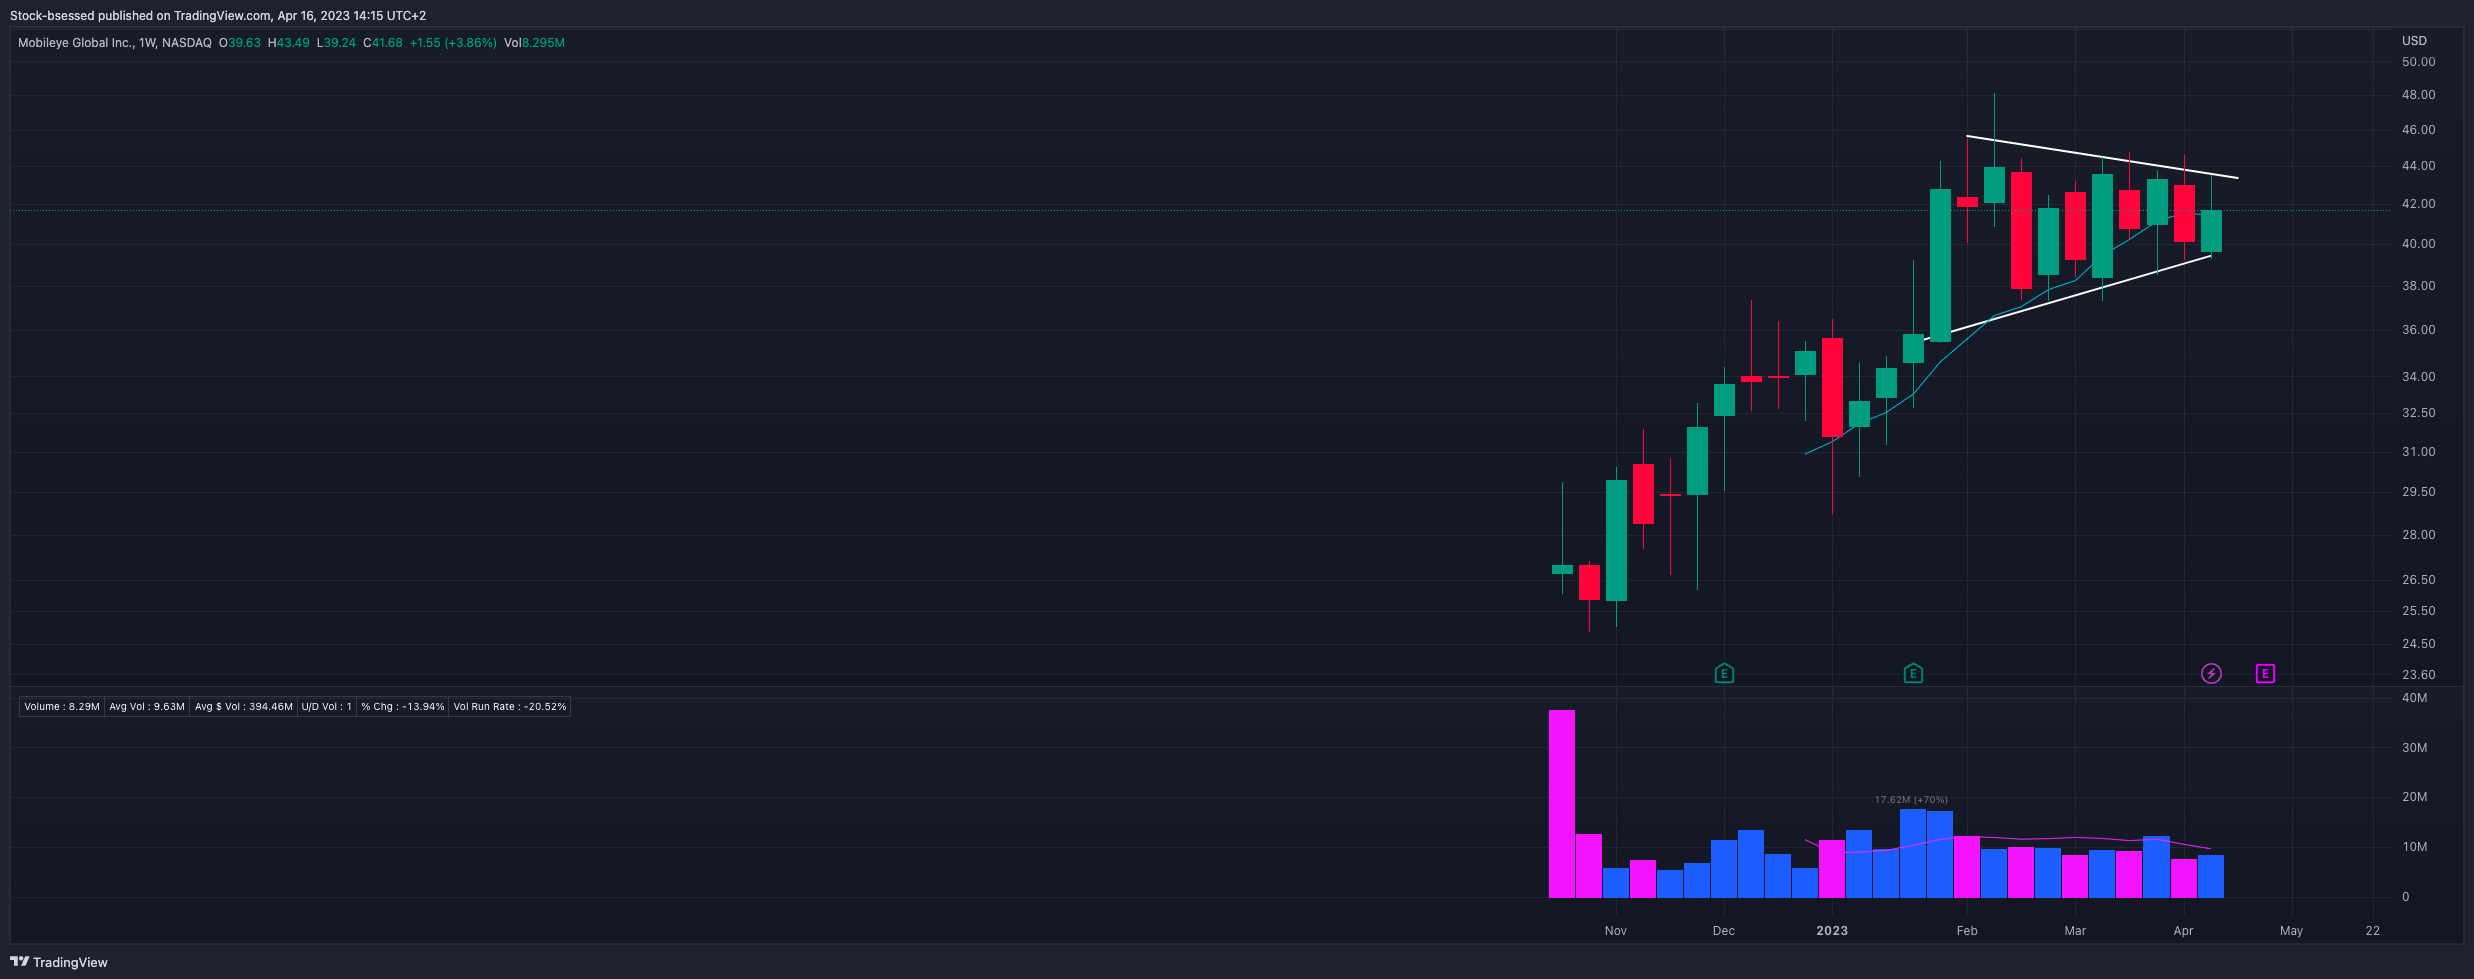
MBLY 0.00%↑ Seeing some what of a potential character change here as it is attempting to move away from its recent volatile and choppy price action and tighten up some here with a double inside day. Like how this continues to form higher lows and am watching the 43.50 area on strength after this recent shakeout below KMAs:
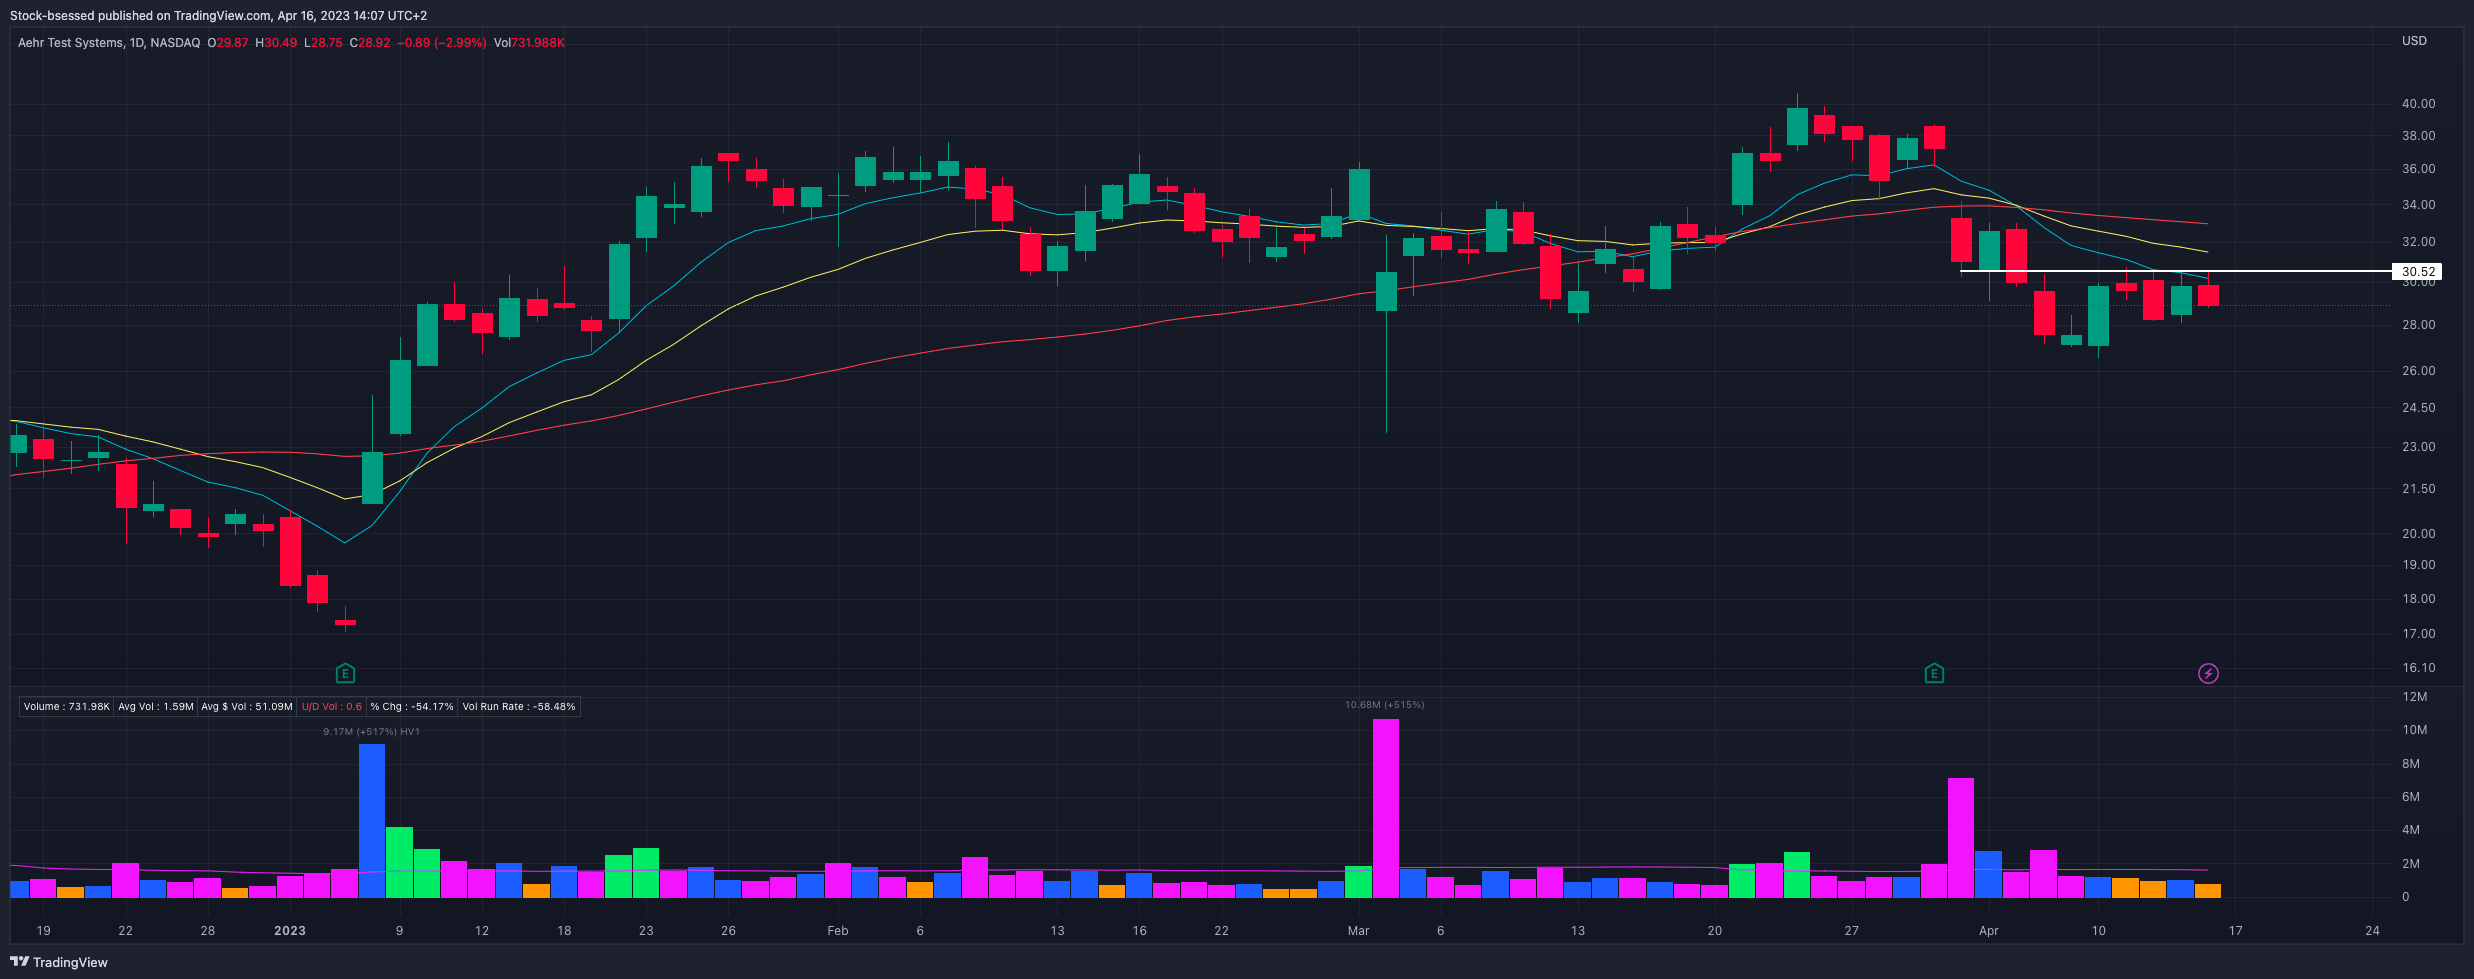
AEHR 0.00%↑ Wasn't liking the recent weakness in semiconductors and how this continues to trend below KMAs but it is setting a clear pivot right around the 30.50 area:
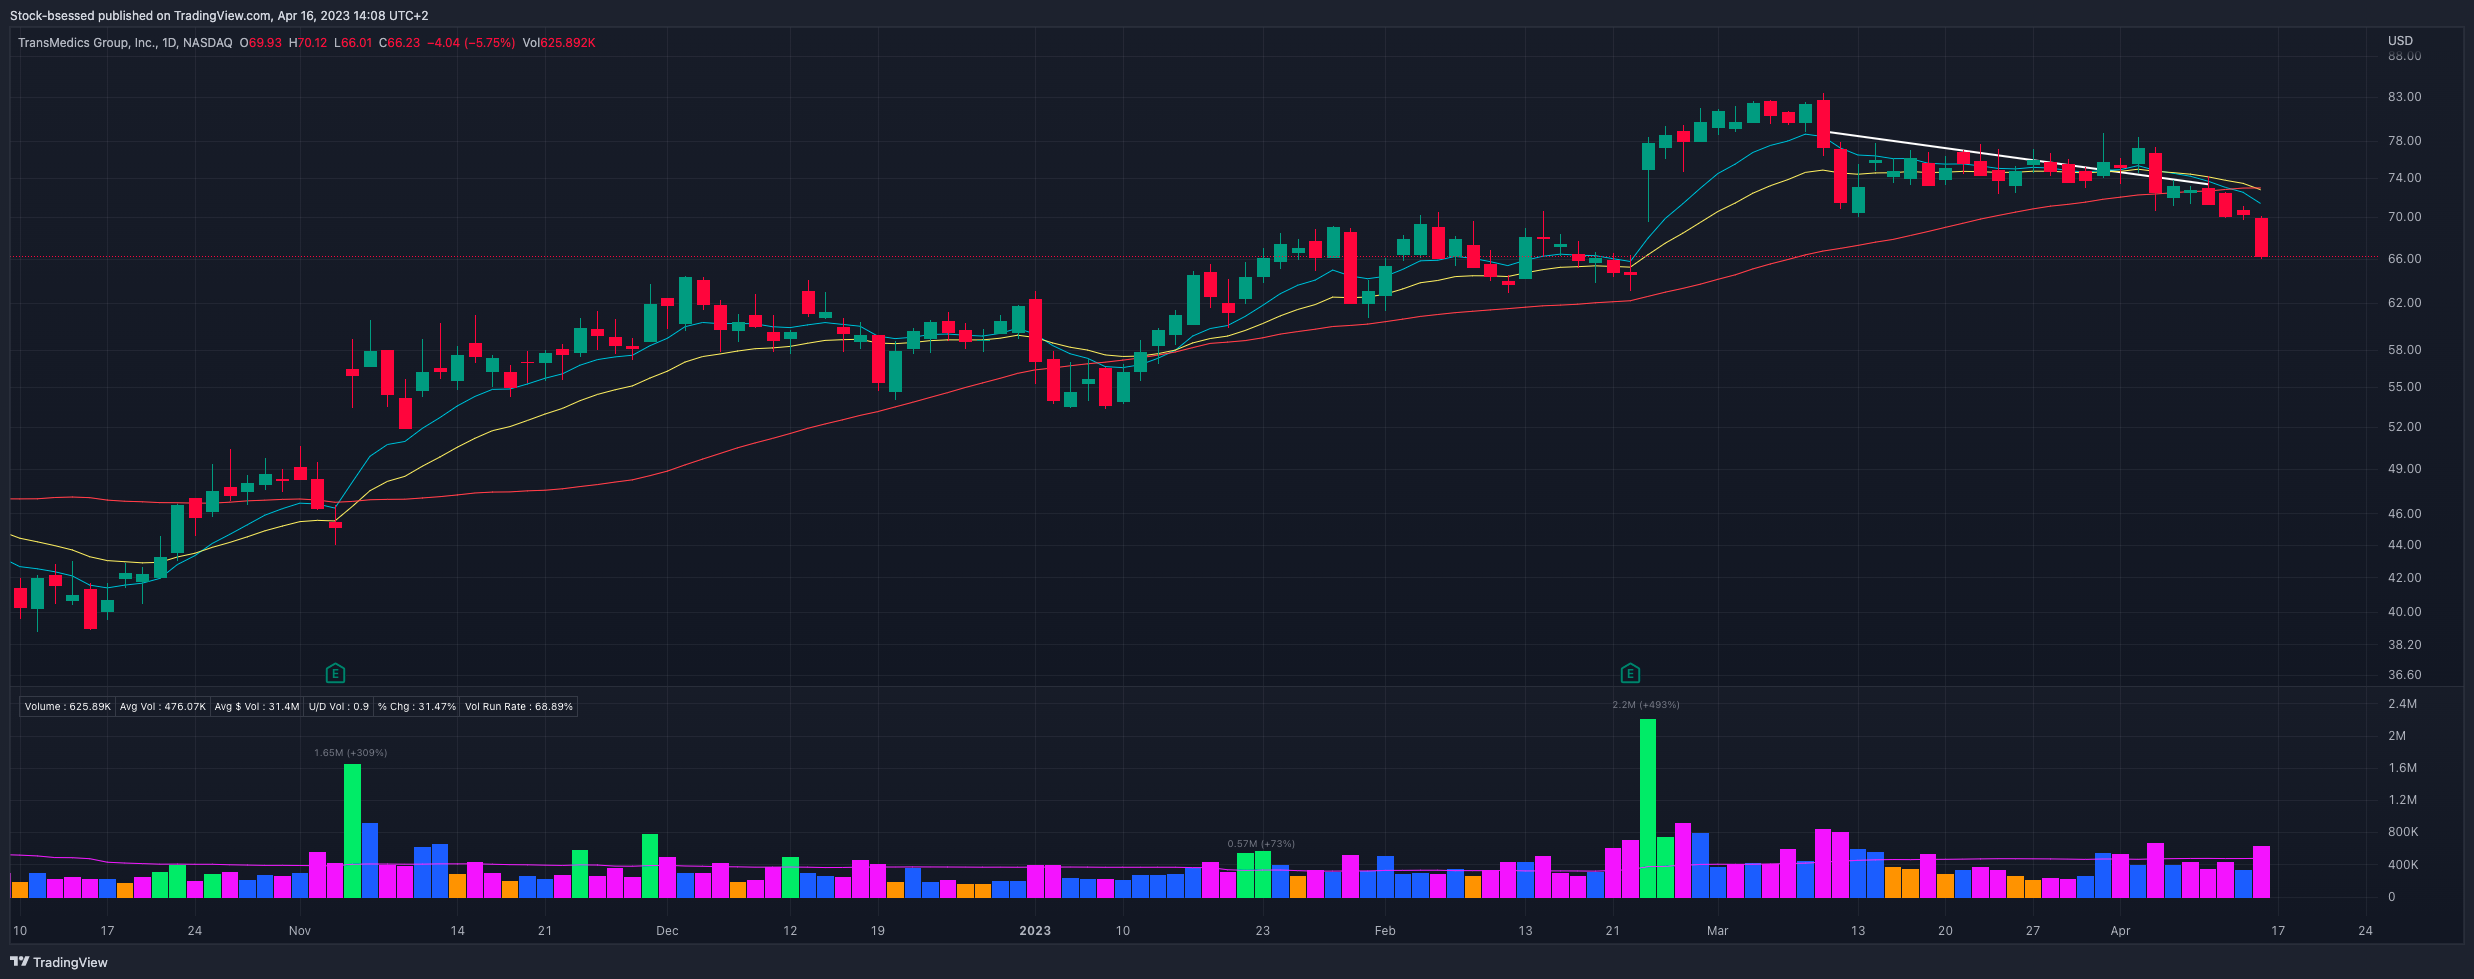
TMDX 0.00%↑ Relative weakness to fall -5.75% on increased volume on the session and now firmly below all KMAs. Moved up well over a longer-time frame but never really had the power to push out quickly and strongly - was more of a grinding up slowly type of name which is why I opted to stay away for the most part:
Week
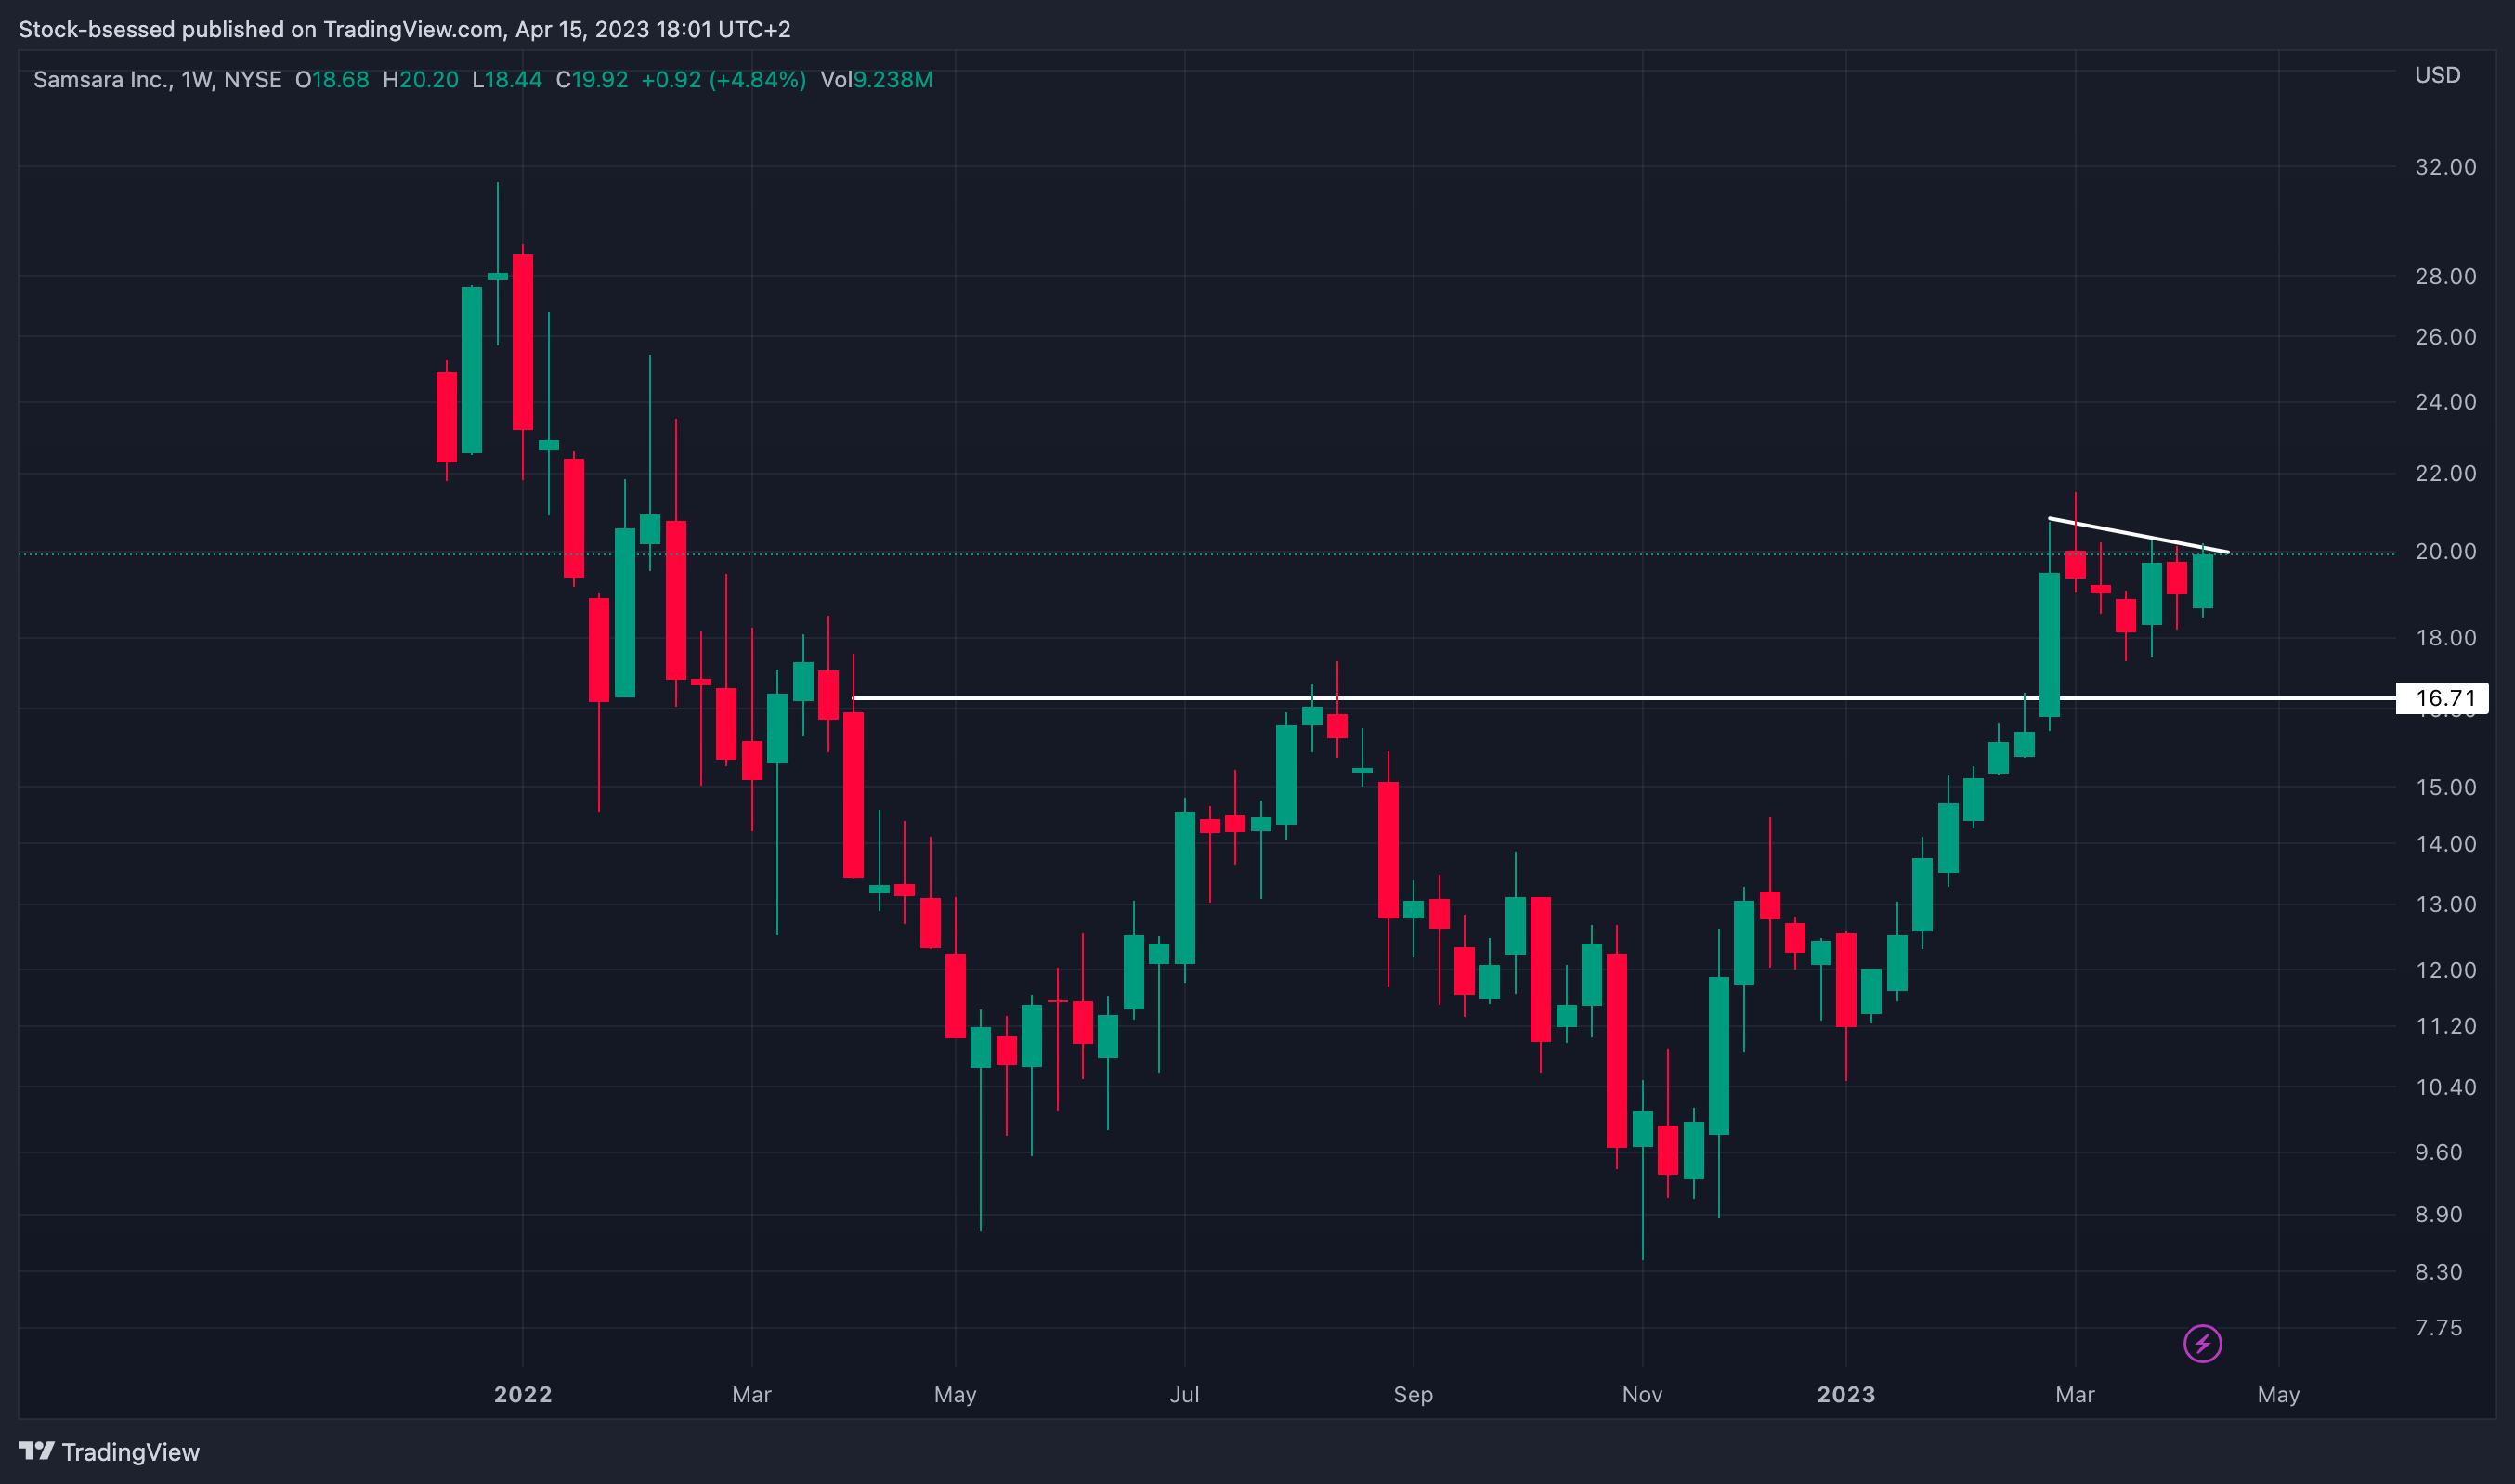
IOT 0.00%↑ Main focus.
Coming together really nicely since the recent +15.40% earnings gap-up on its Highest-volume ever (HVE).
Now potentially setting a spot right around the 20 area after finding buyers at the 20EMA:

ONON 0.00%↑ Daily chart shows some back-and-forth action but weekly continues. to show well-defined levels with ~32 proving to be very important:
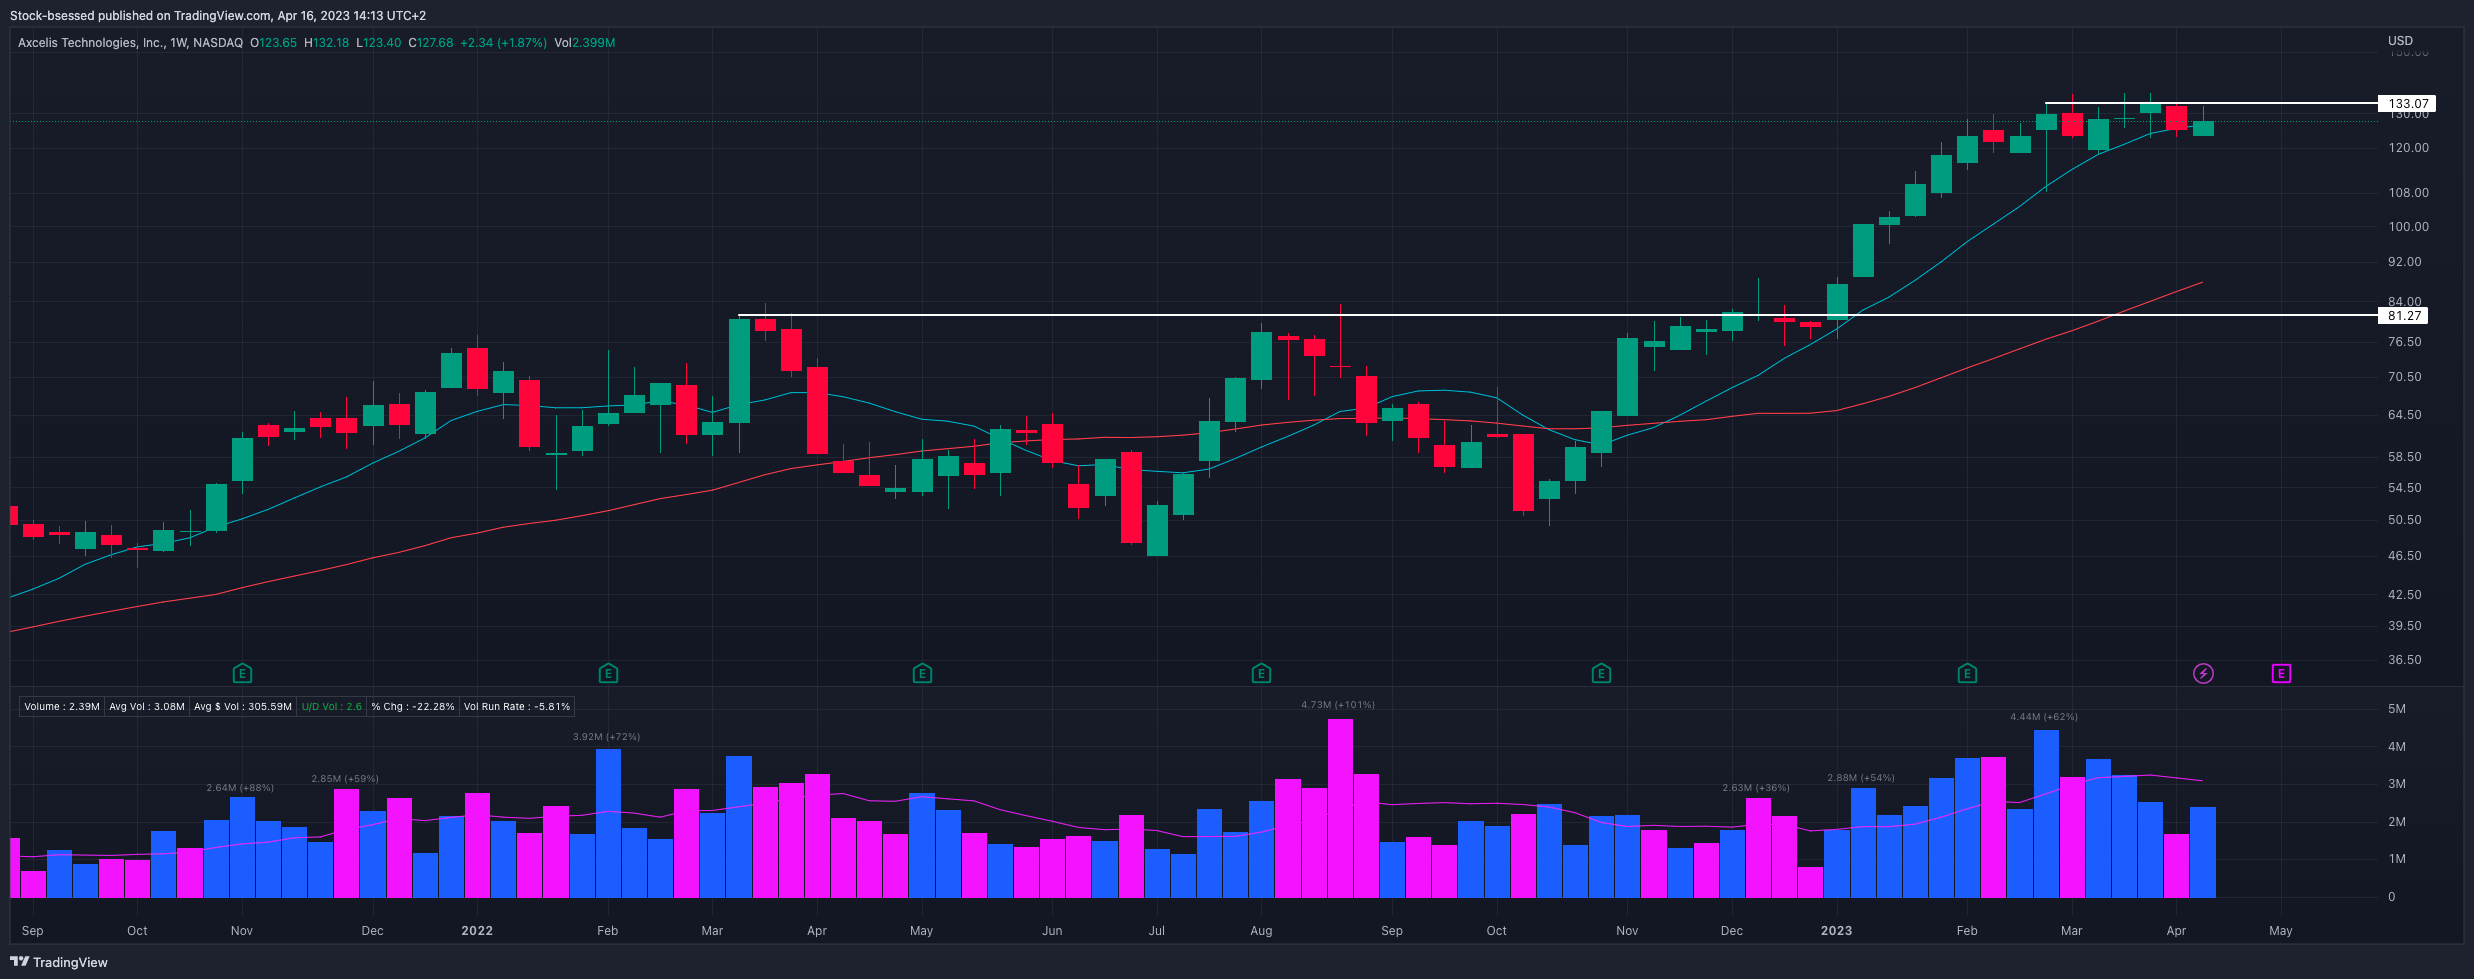
ACLS 0.00%↑ Pushed well from the recent base-breakout and now attempting to form another base up here below this 133 level:
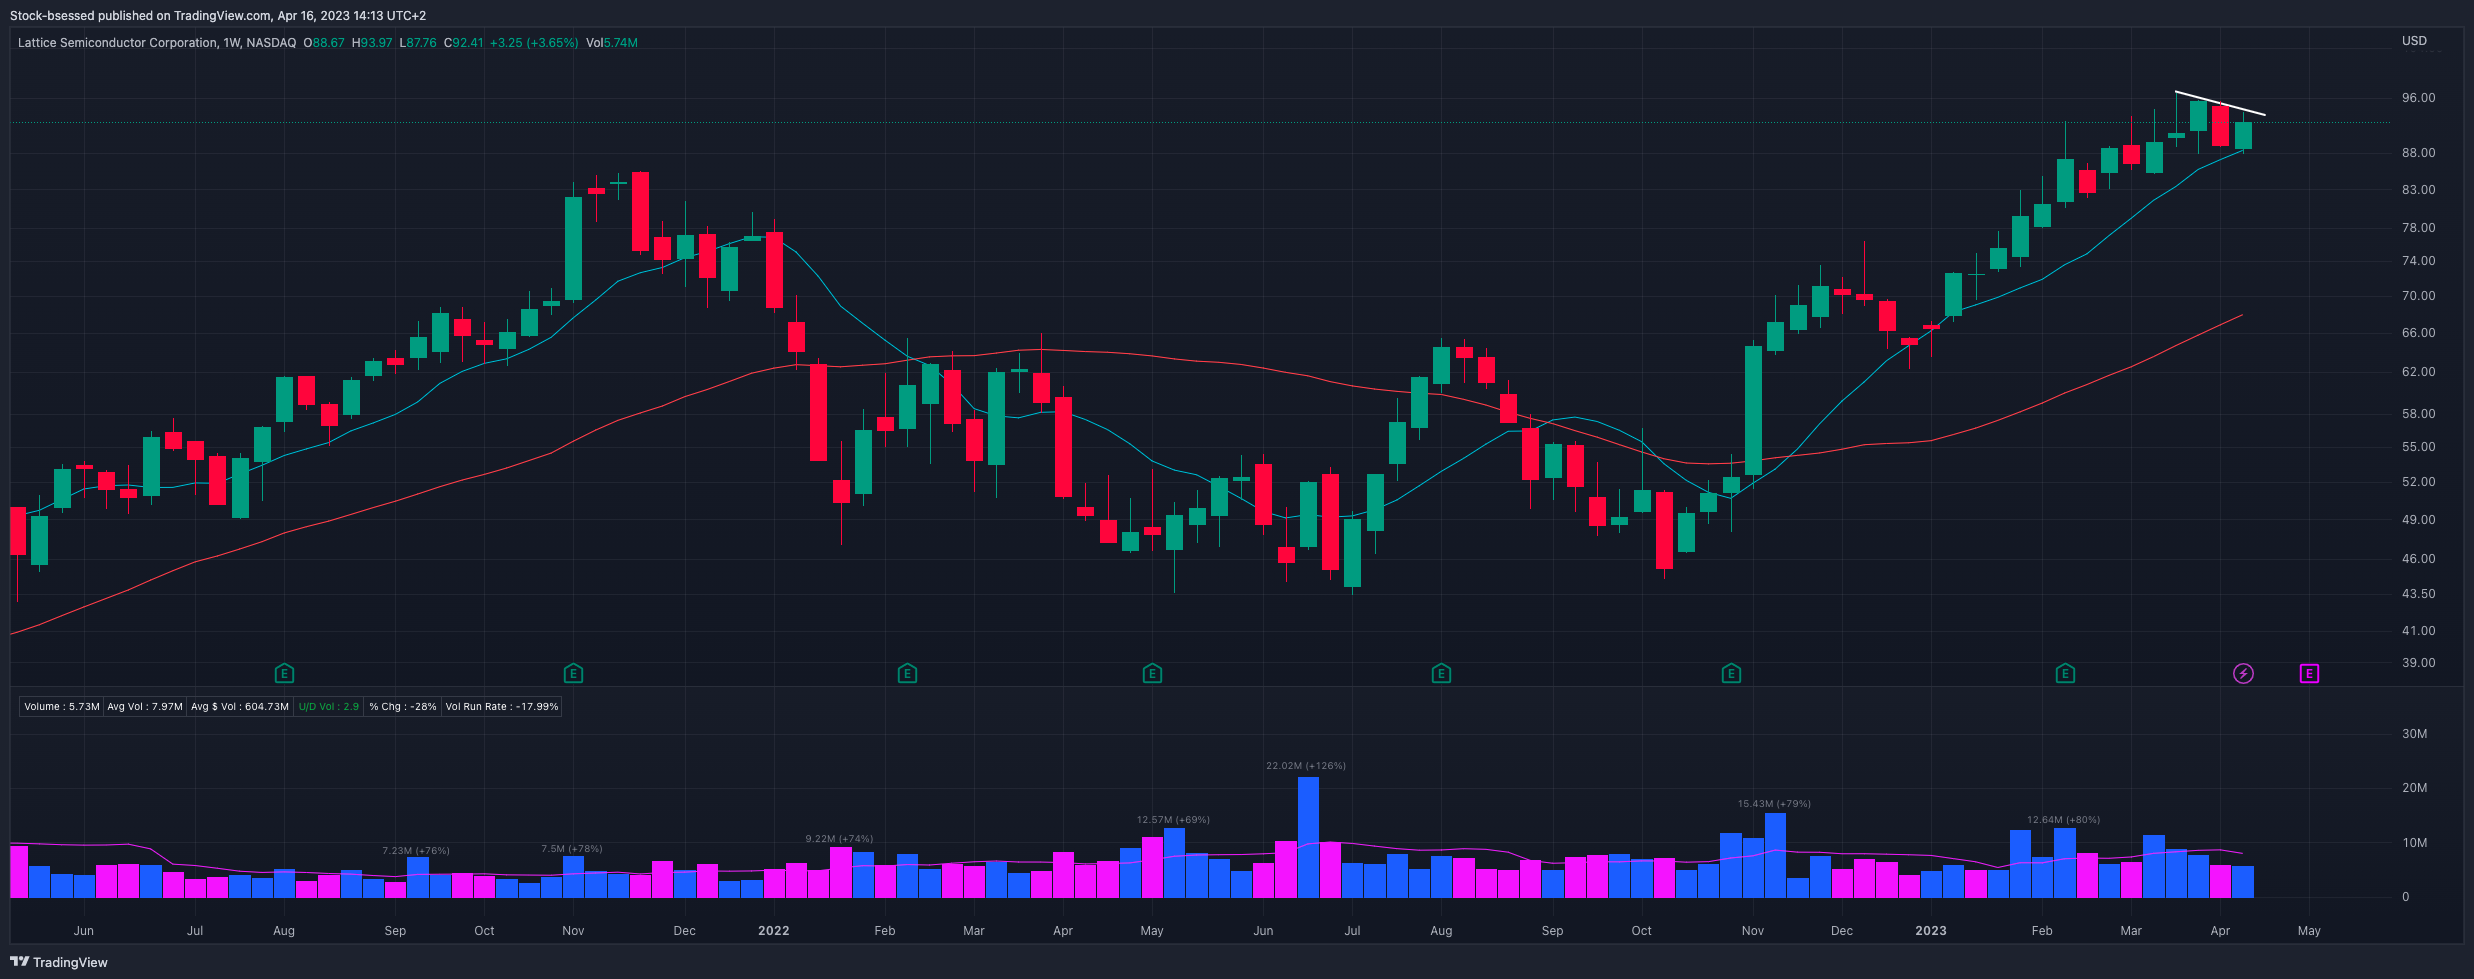
LSCC 0.00%↑ Flagging well up here as buyers keep supporting it right around the 10-Week moving average (10WMA):
MBLY 0.00%↑ Weekly shows more clearly how this is attempting to tighten up within this flag:
Individual Sector Analysis
Session
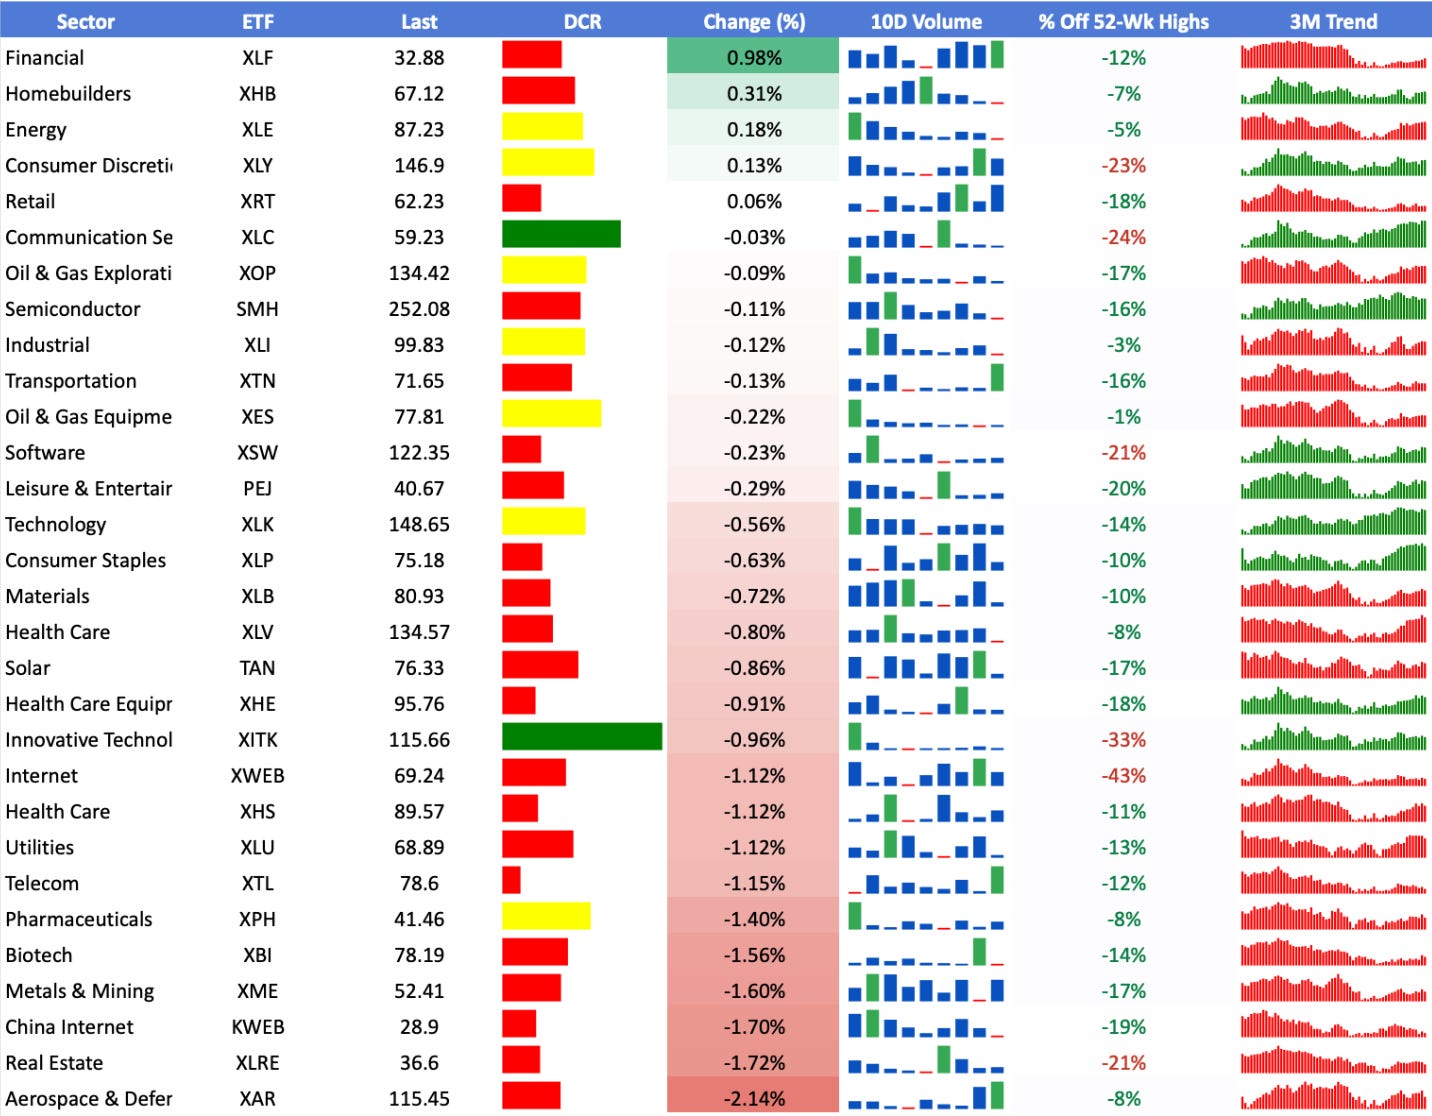
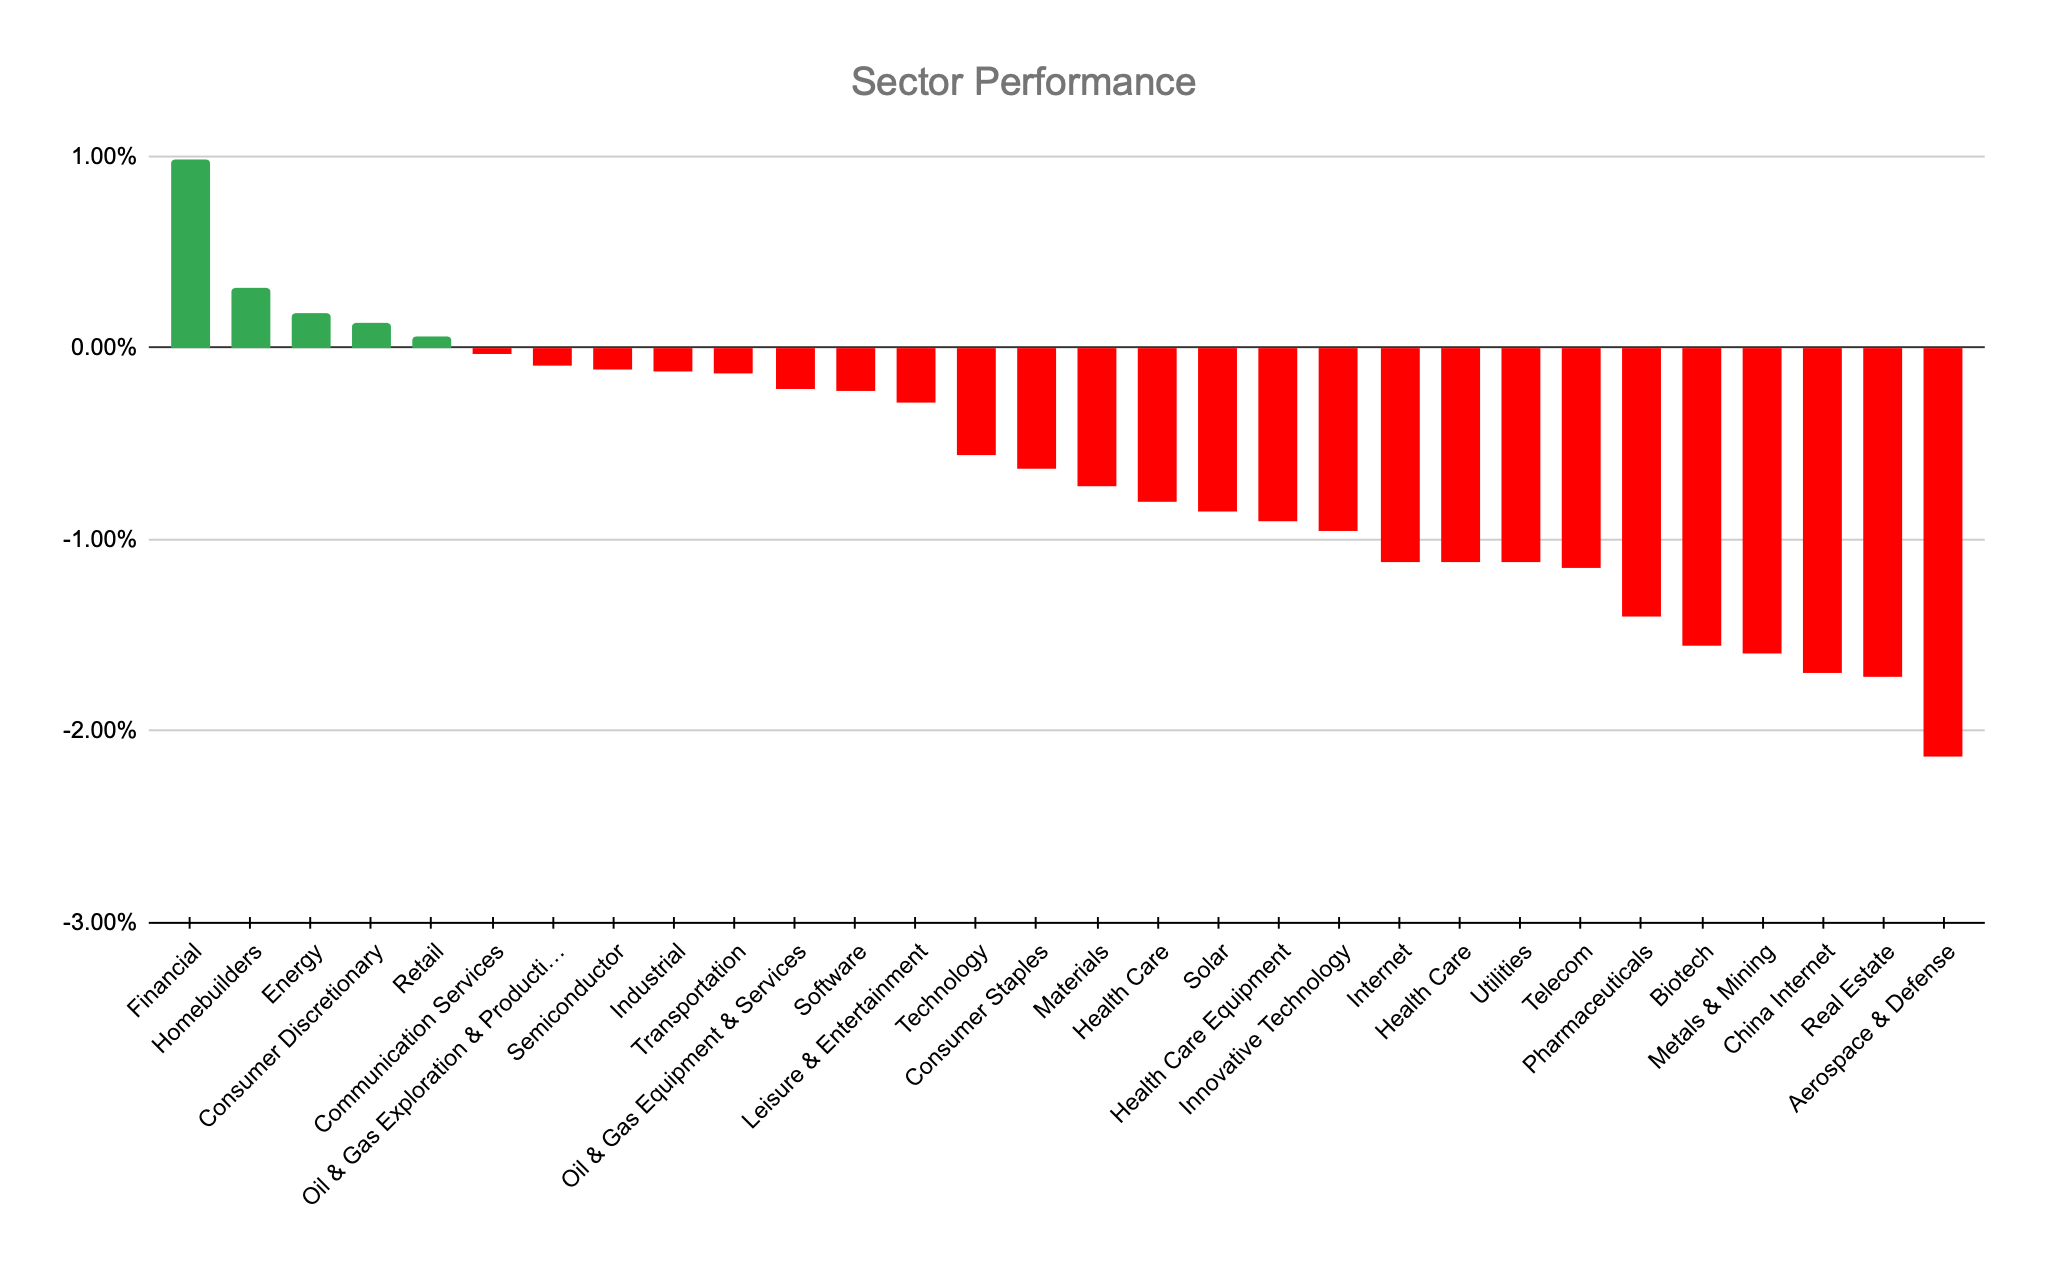
I am linking the sectors watchlist in tradingview for your convenience, here
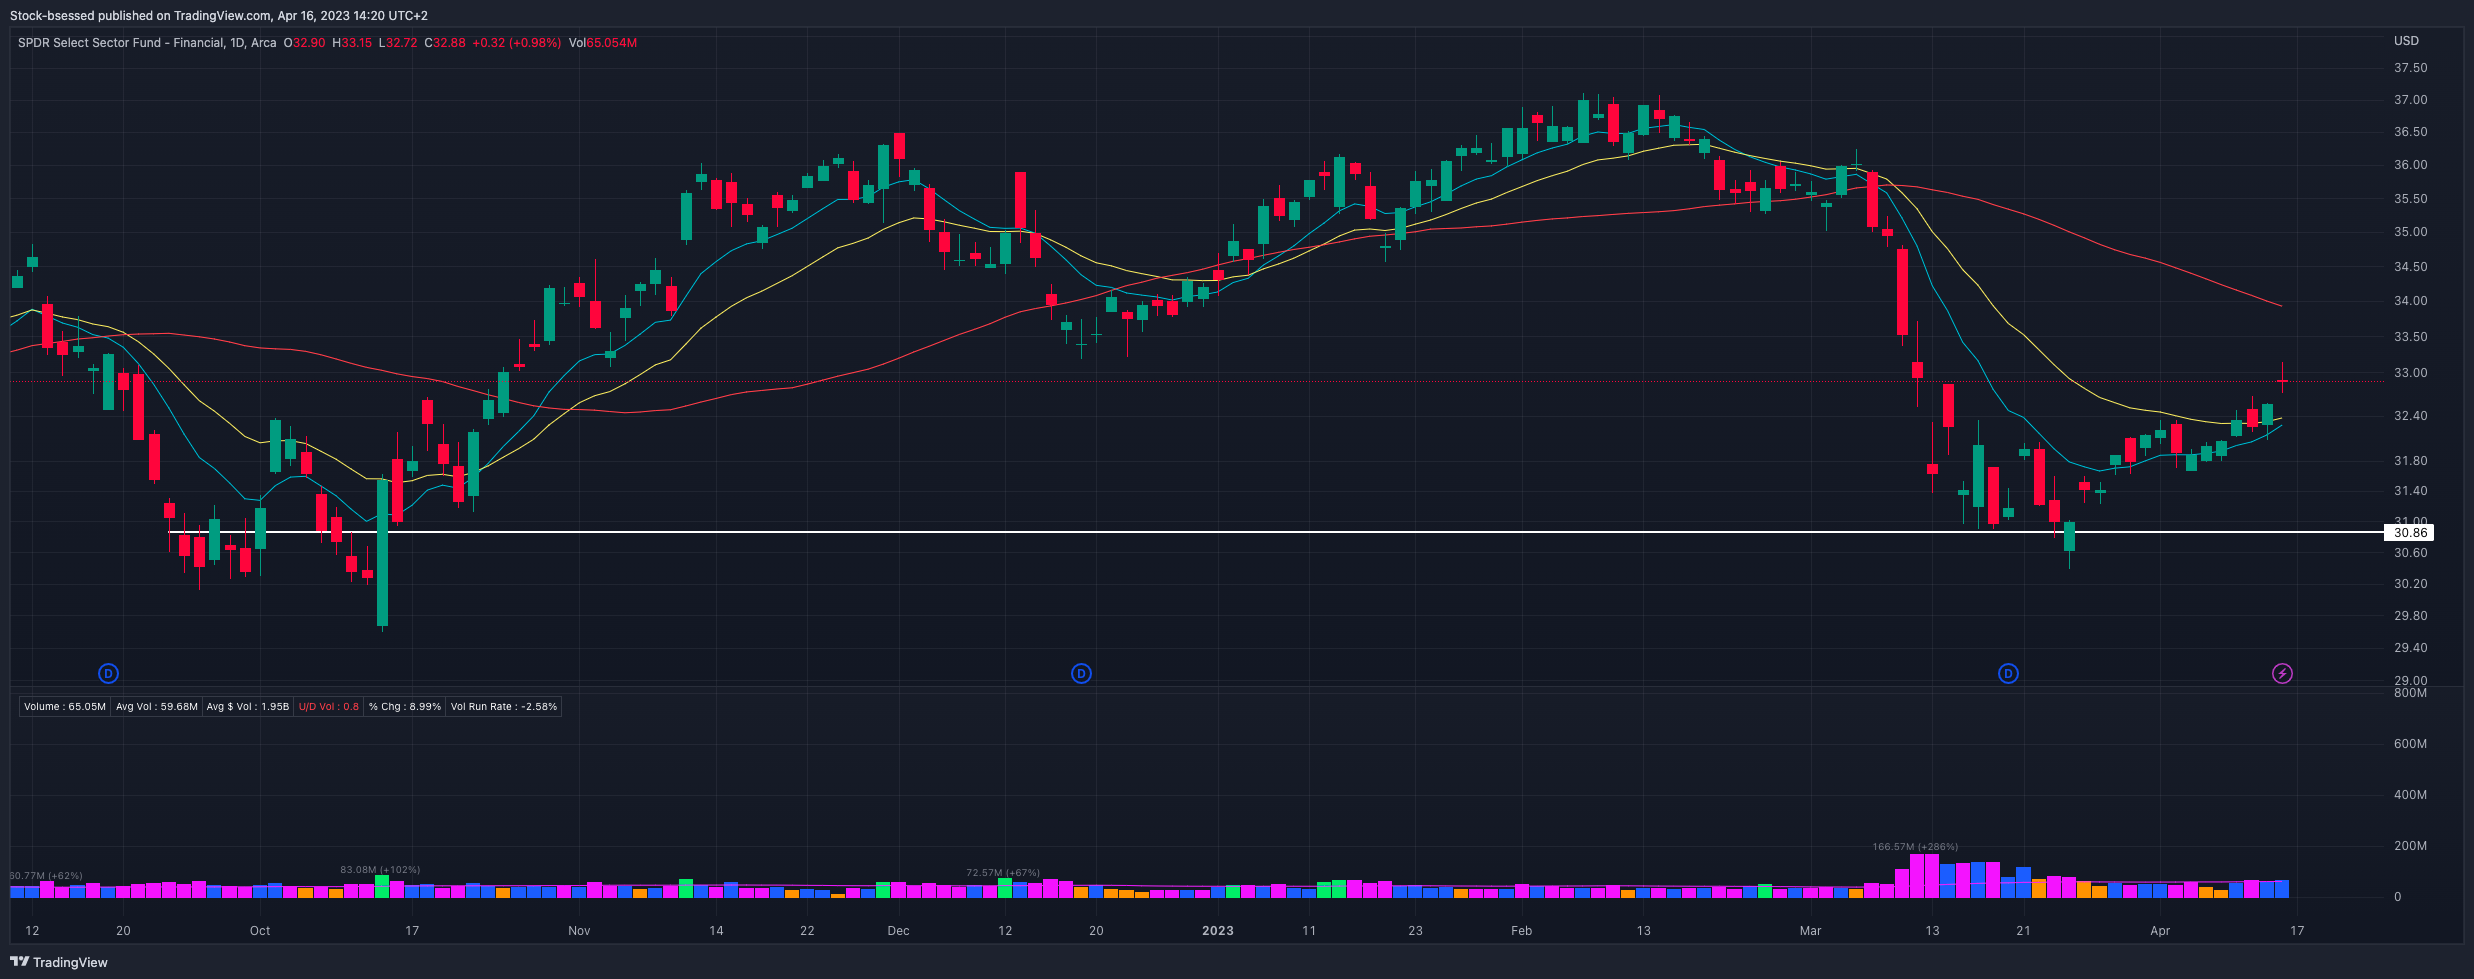
XLF 0.00%↑ Follows through on its recent undercut and rally within the overall failed breakdown to now gap-up on the back of some positive earnings such as JPM 0.00%↑ and close firmly above the 10 and 20EMA which are now trending upwards nicely:
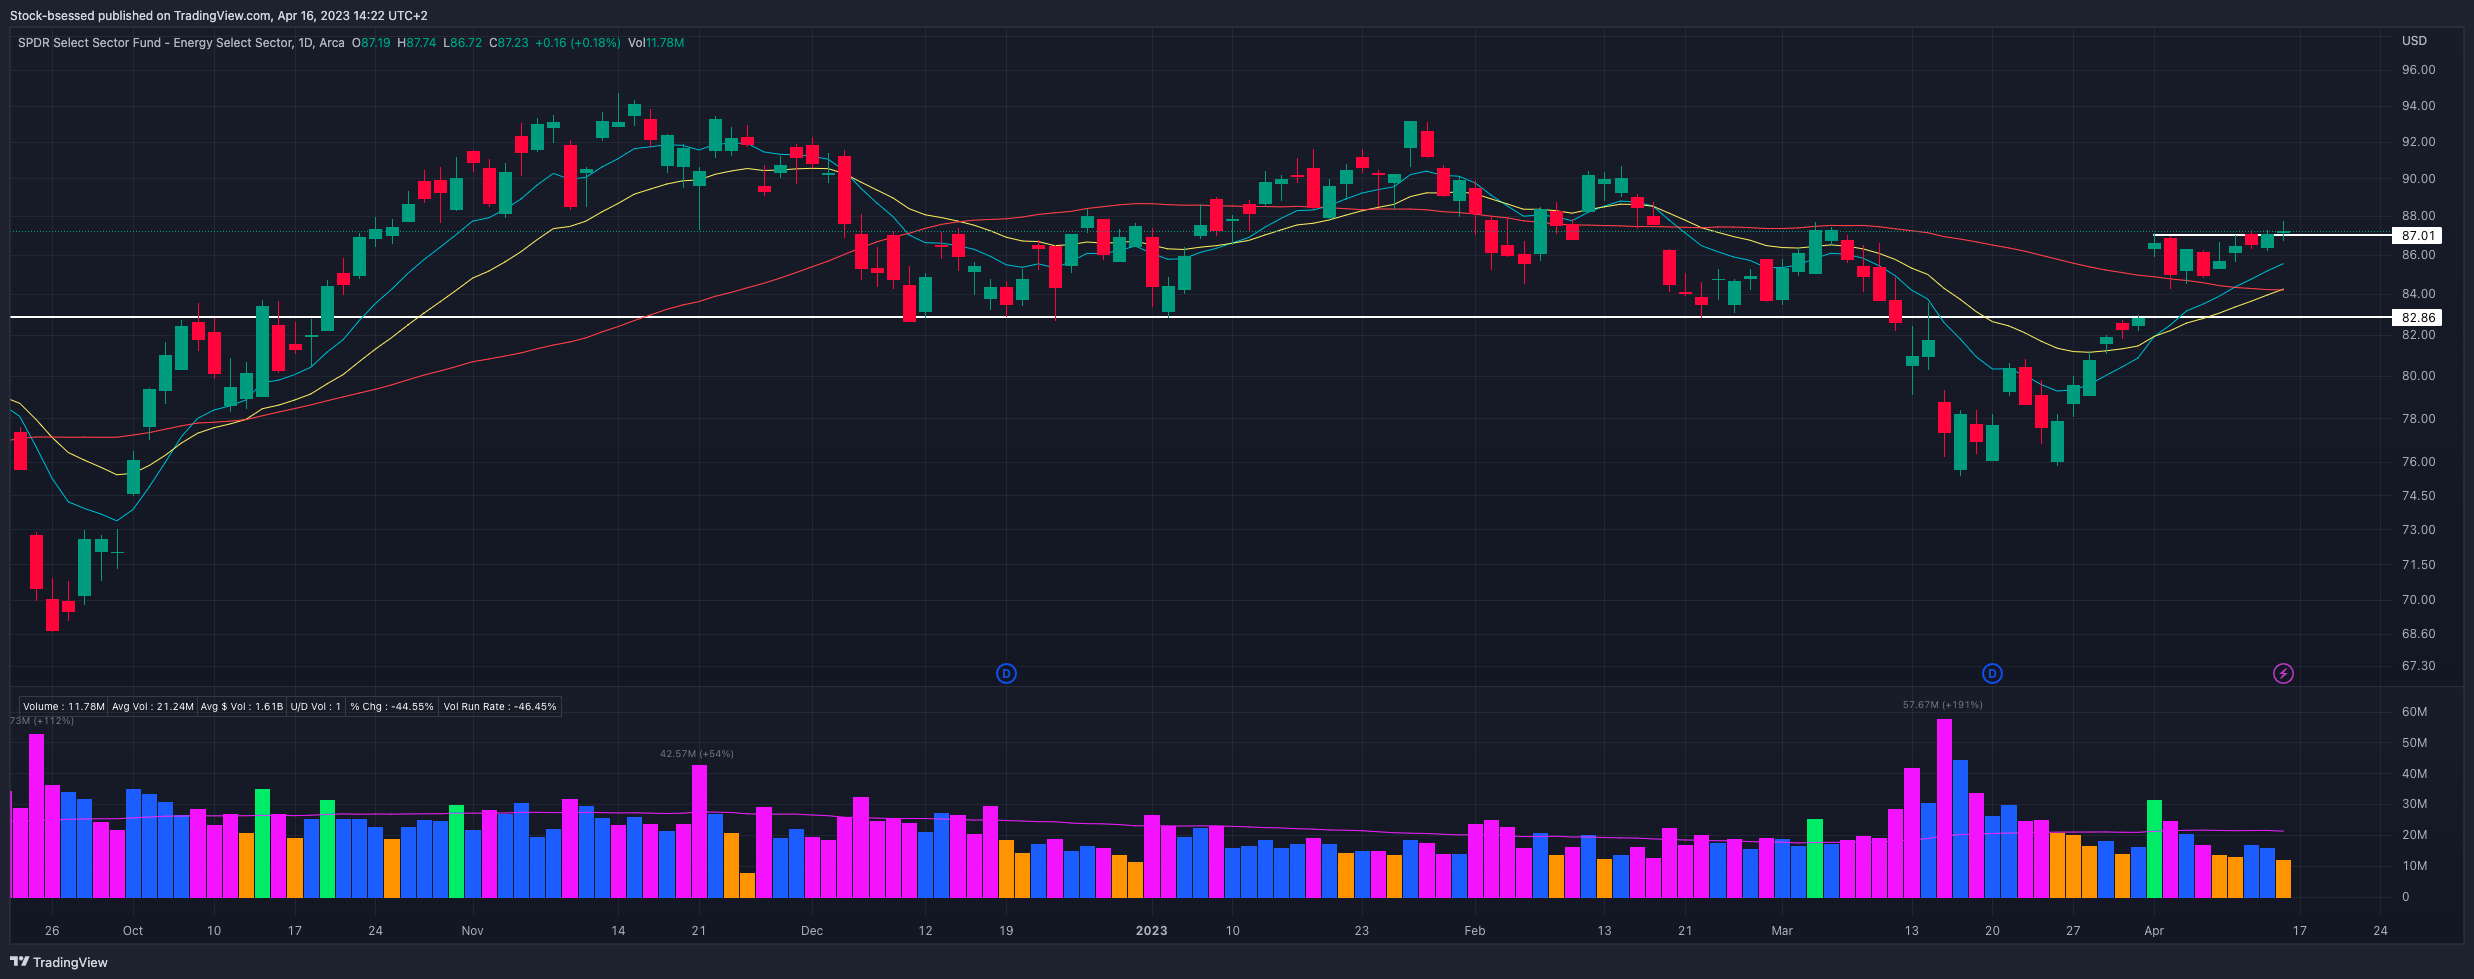
XLE 0.00%↑ Continues trading with some well-defined areas and some encouraging action last session to push to its highest price since mid-February after breaking out of this post-gap consolidation:
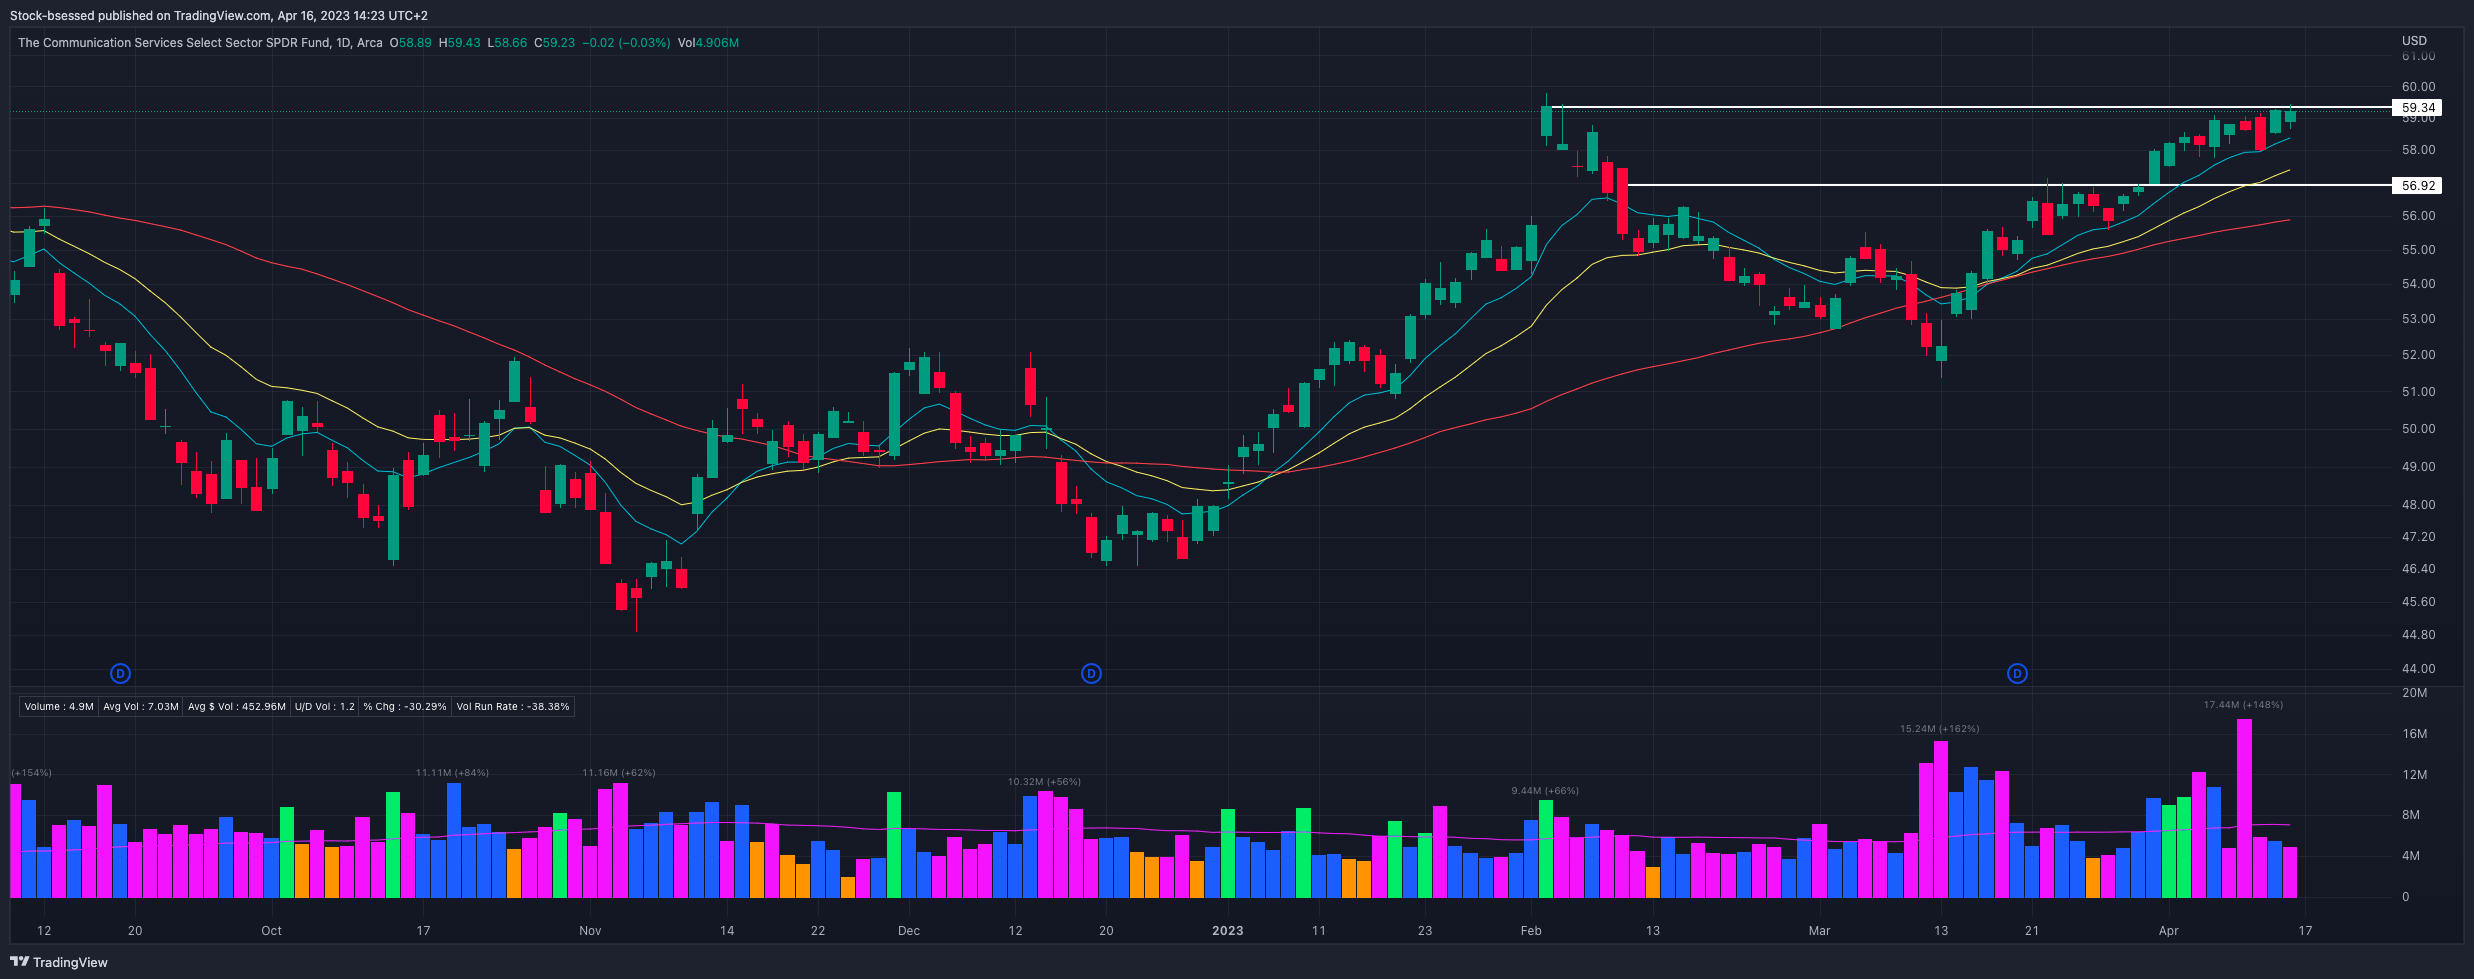
XLC 0.00%↑ Some excellent action where with another strong close and has been trending very-well since the 10EMA reclaim around mid-March. Since then, the 10EMA has been supportive and it is now tightening up nicely below the 60 area:
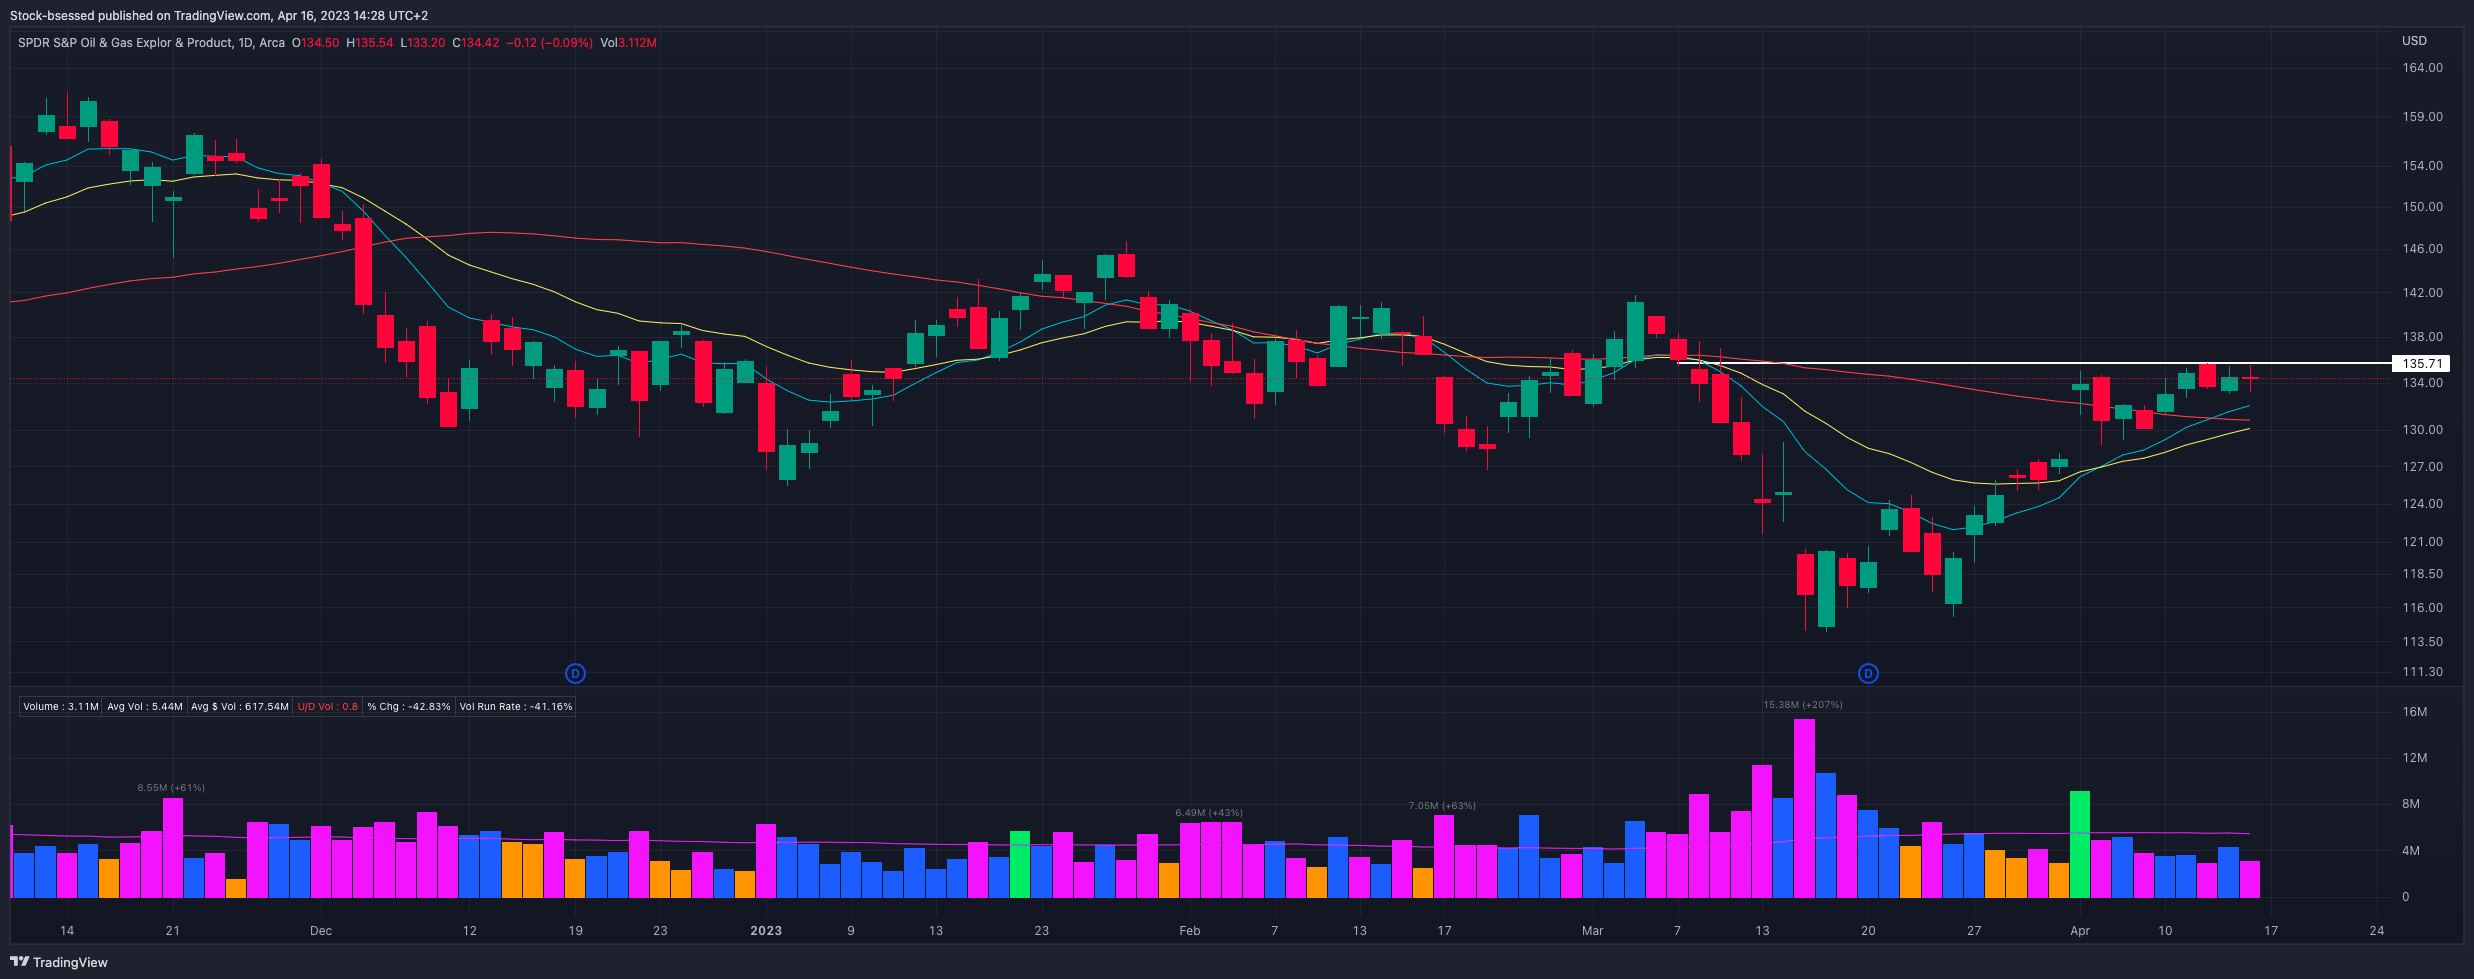
XOP 0.00%↑ Liking the recent tight action under this ~135.7 area:
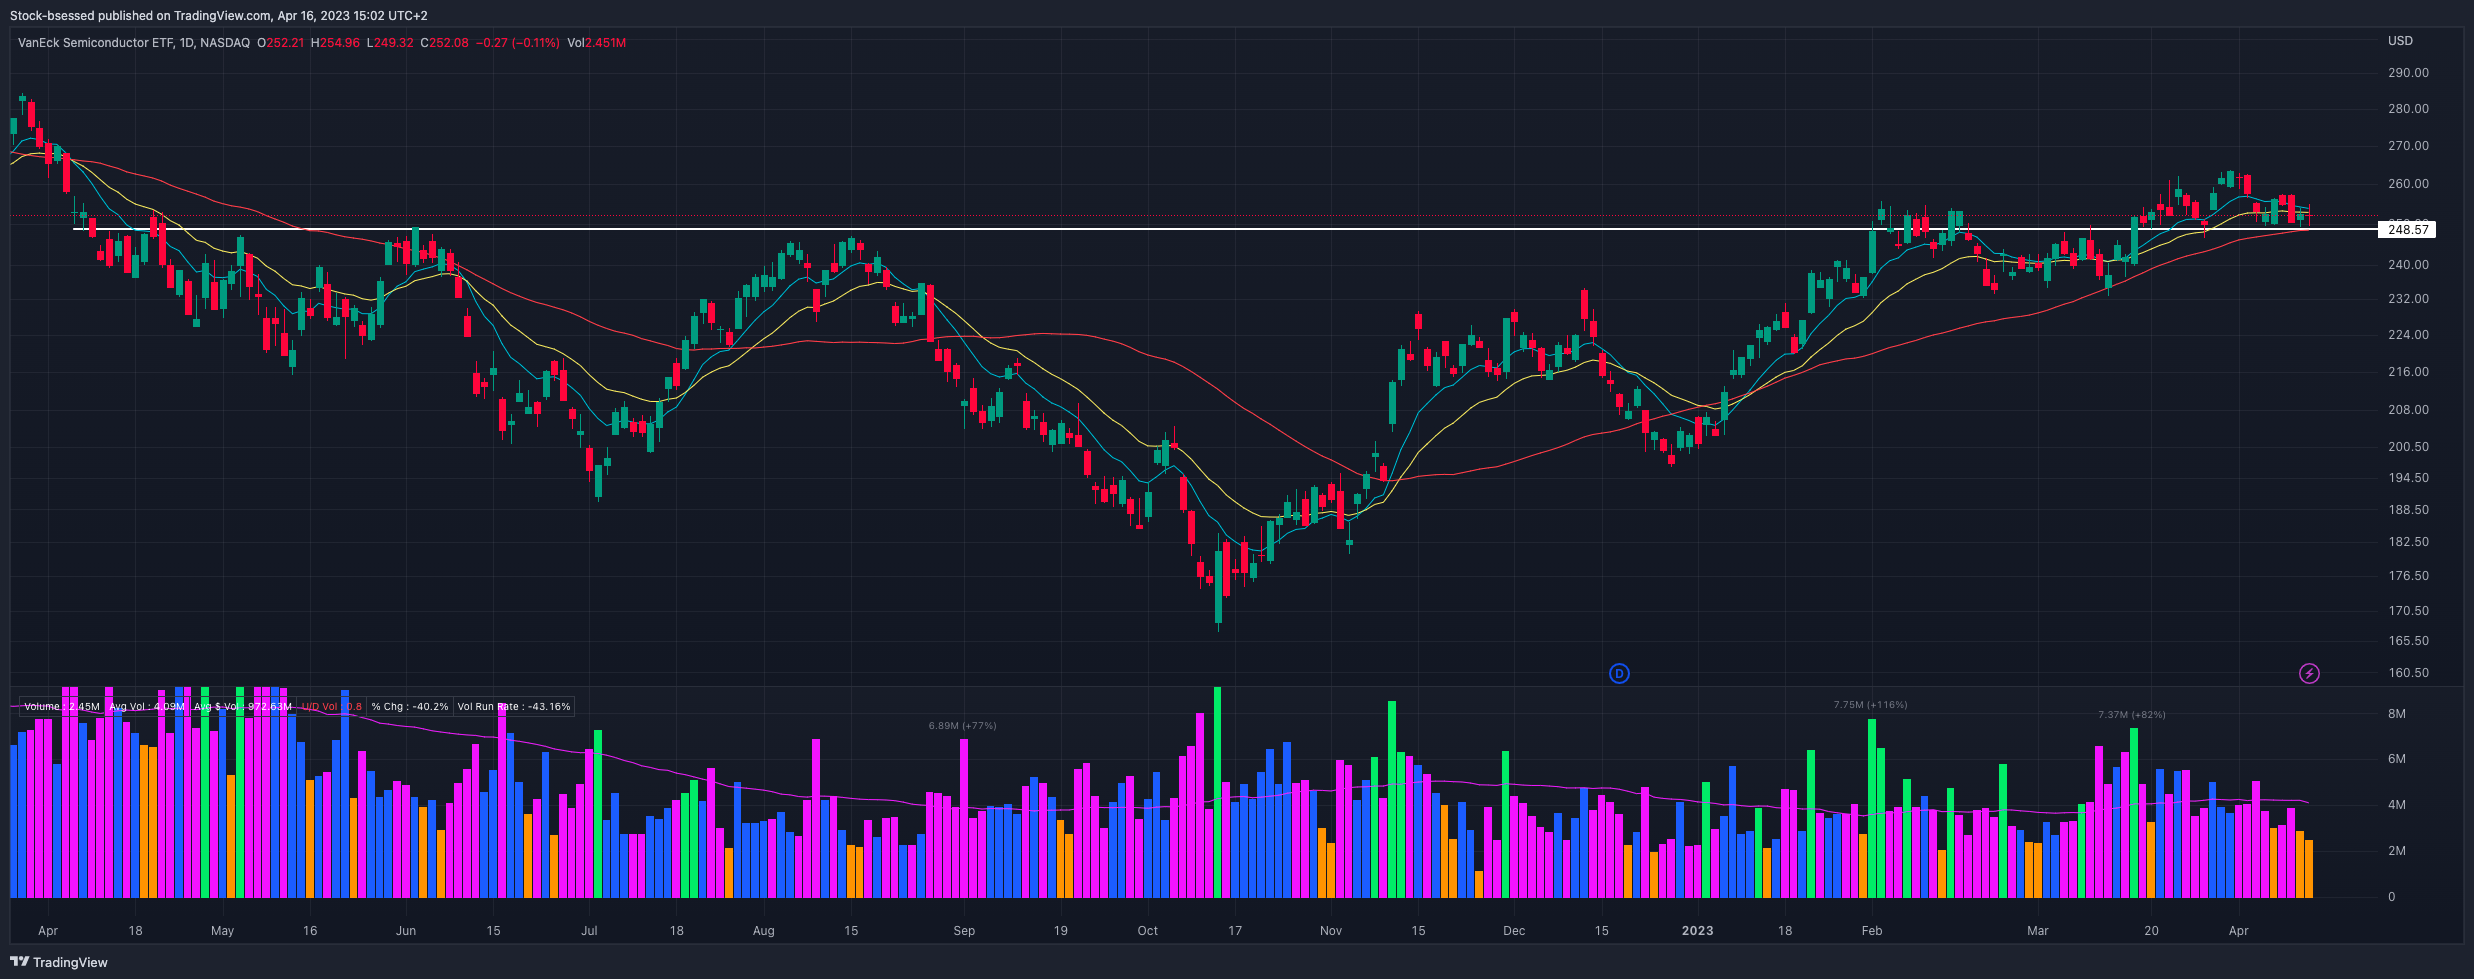
SMH 0.00%↑ Not as strong as it recently was and closes once more below the 10/20 EMAs but is positive that it continues to hold the ~248.50 area of previous resistance now turned support:
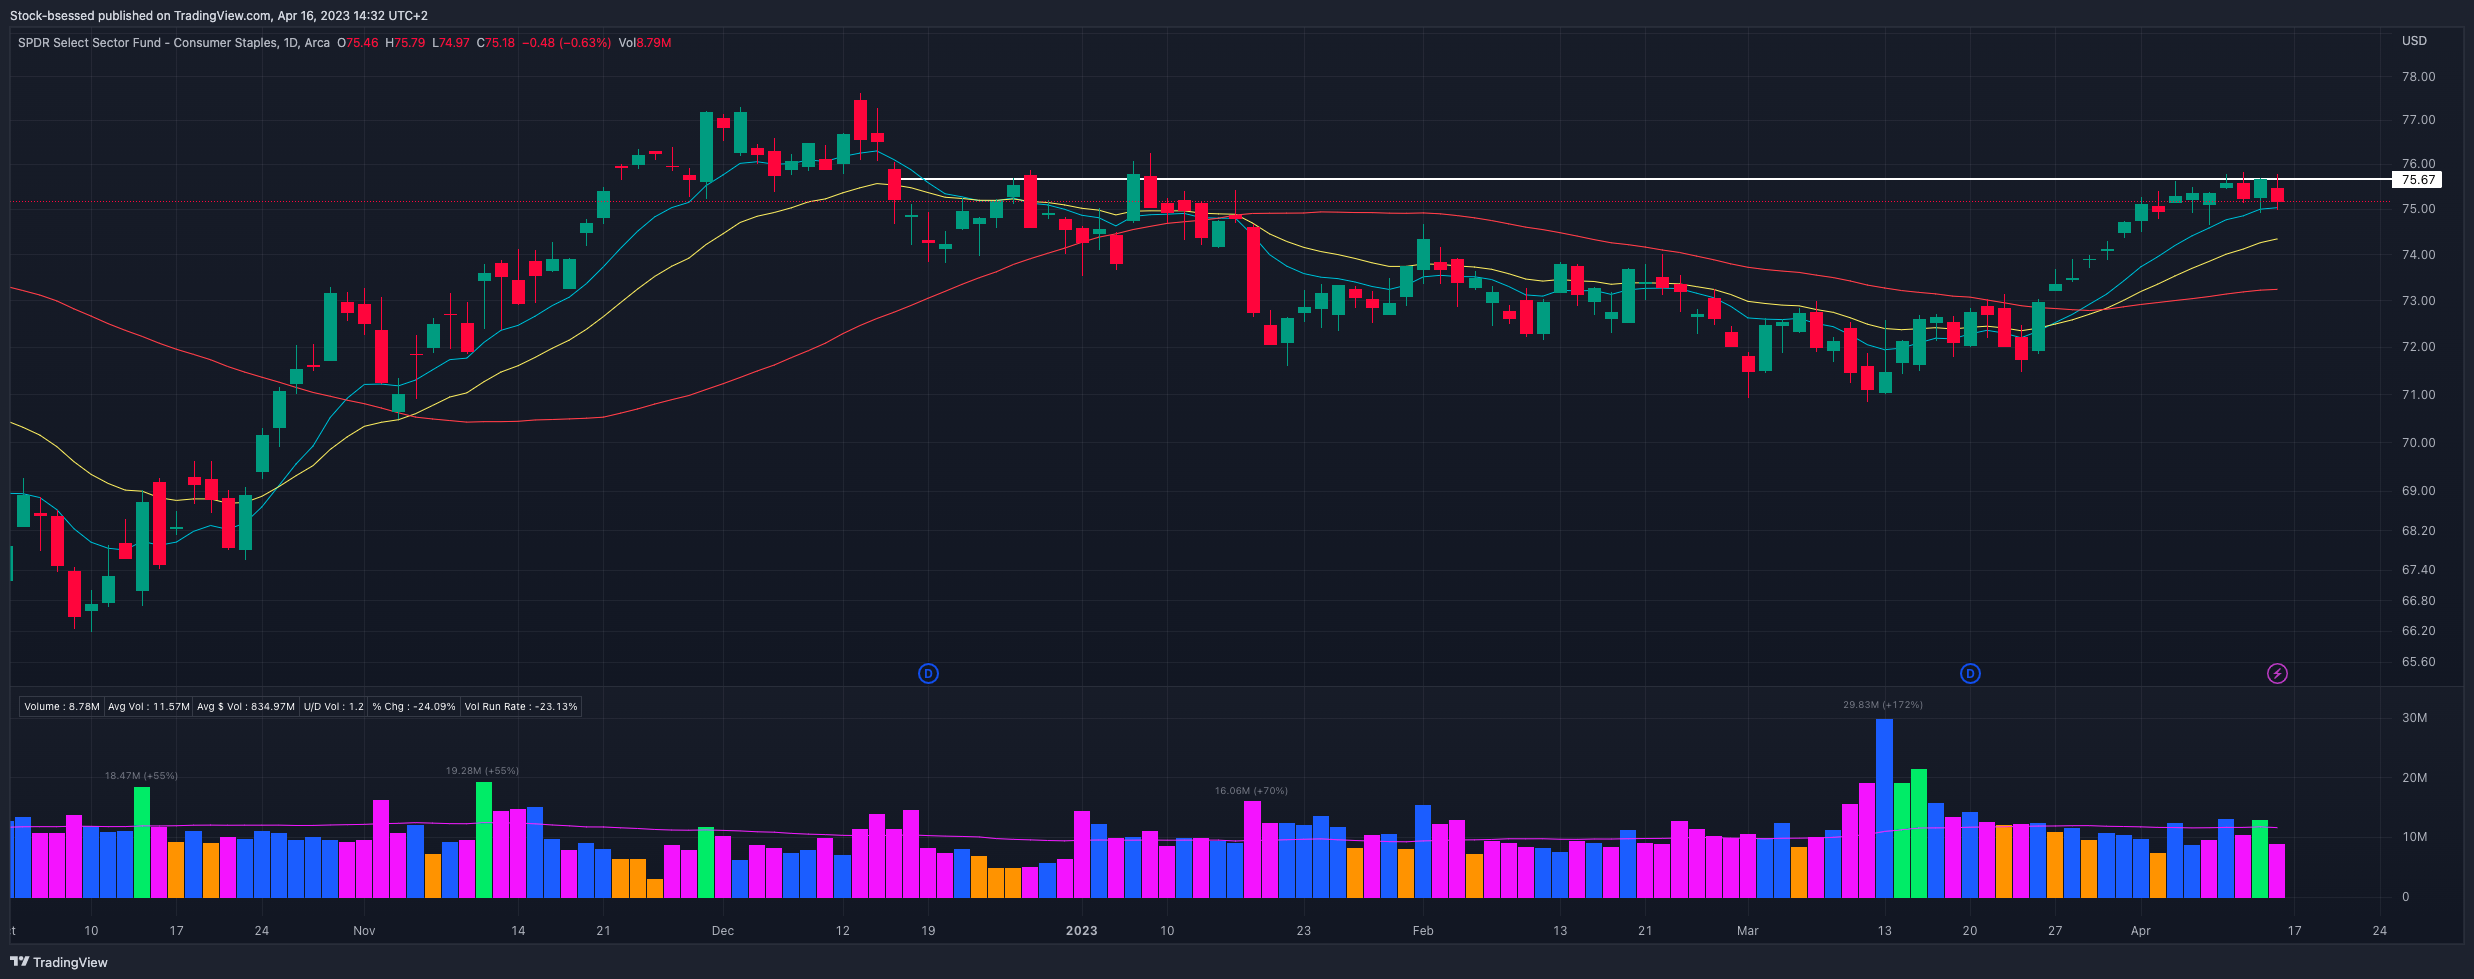
XLP 0.00%↑ Still flagging well below 76 as buyers continue supporting this around the 10EMA:
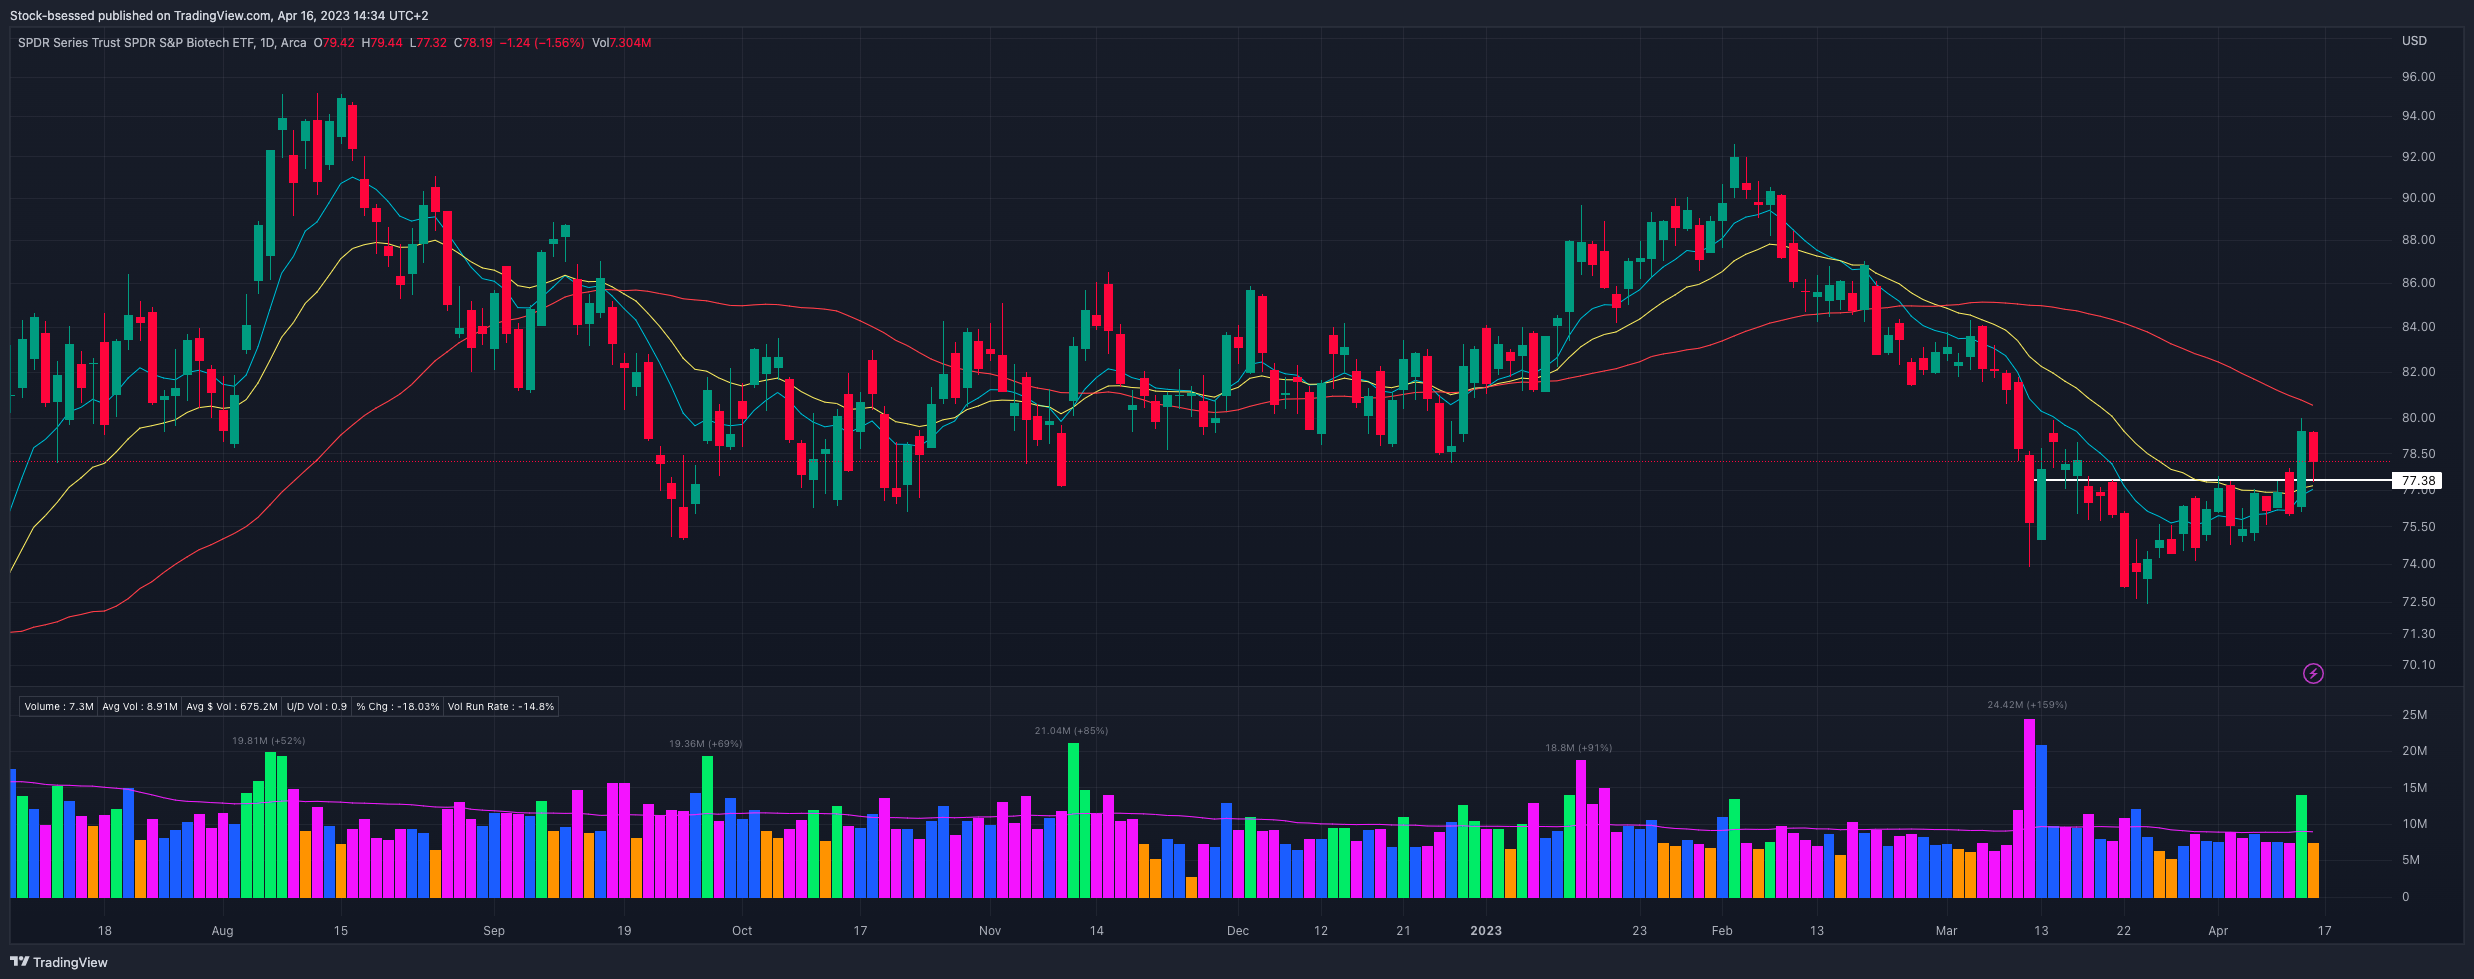
XBI 0.00%↑ A good re-test of previous resistance and the short-term moving averages and would like to see this turn up from here and continue higher now:
XME 0.00%↑ Acting well:

Week
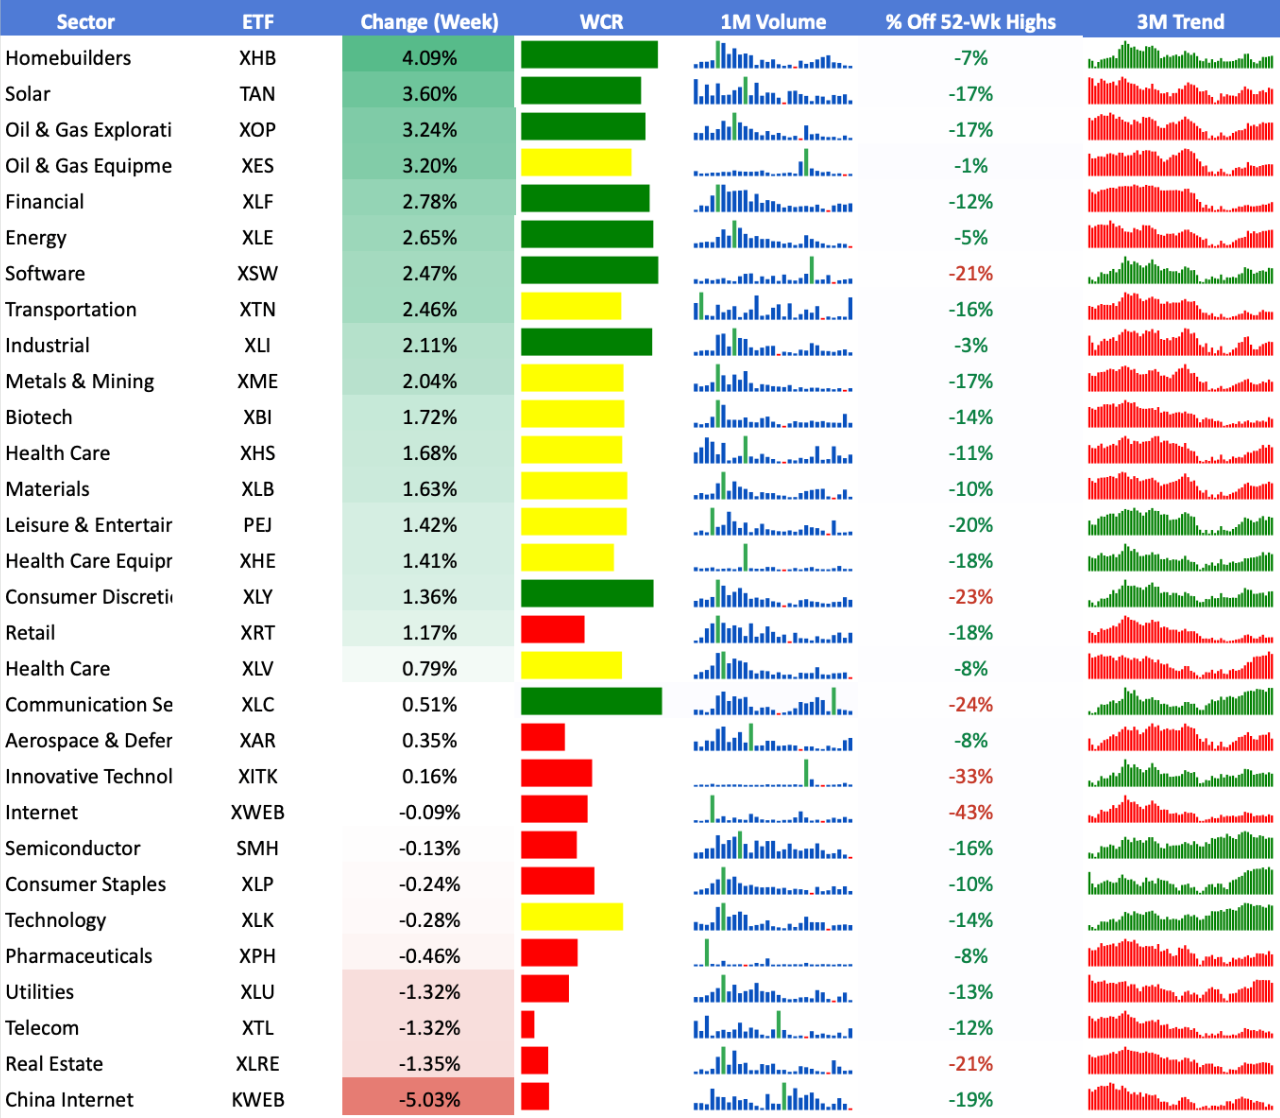
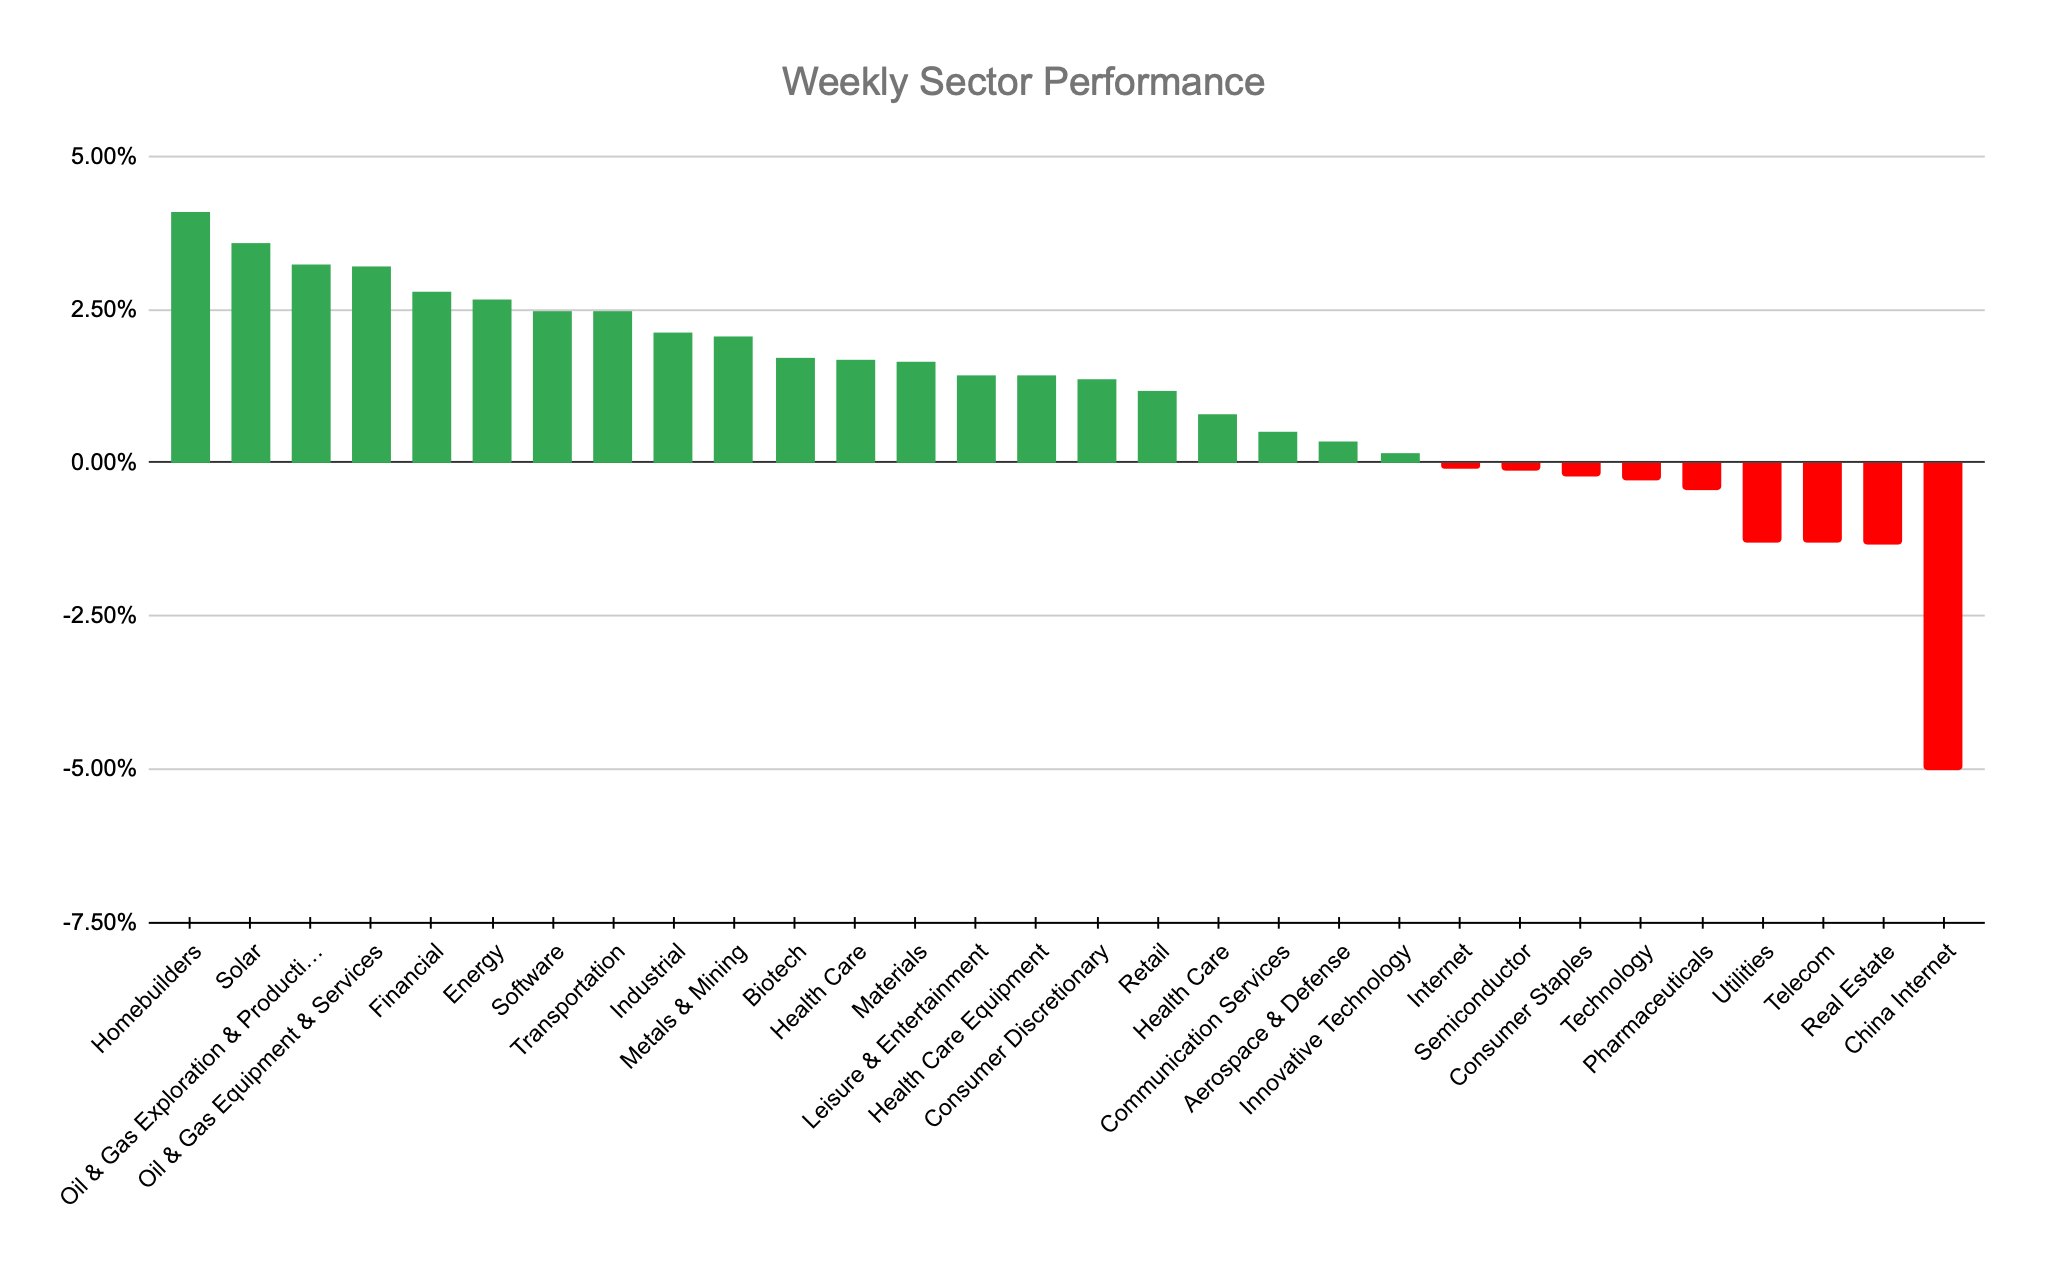
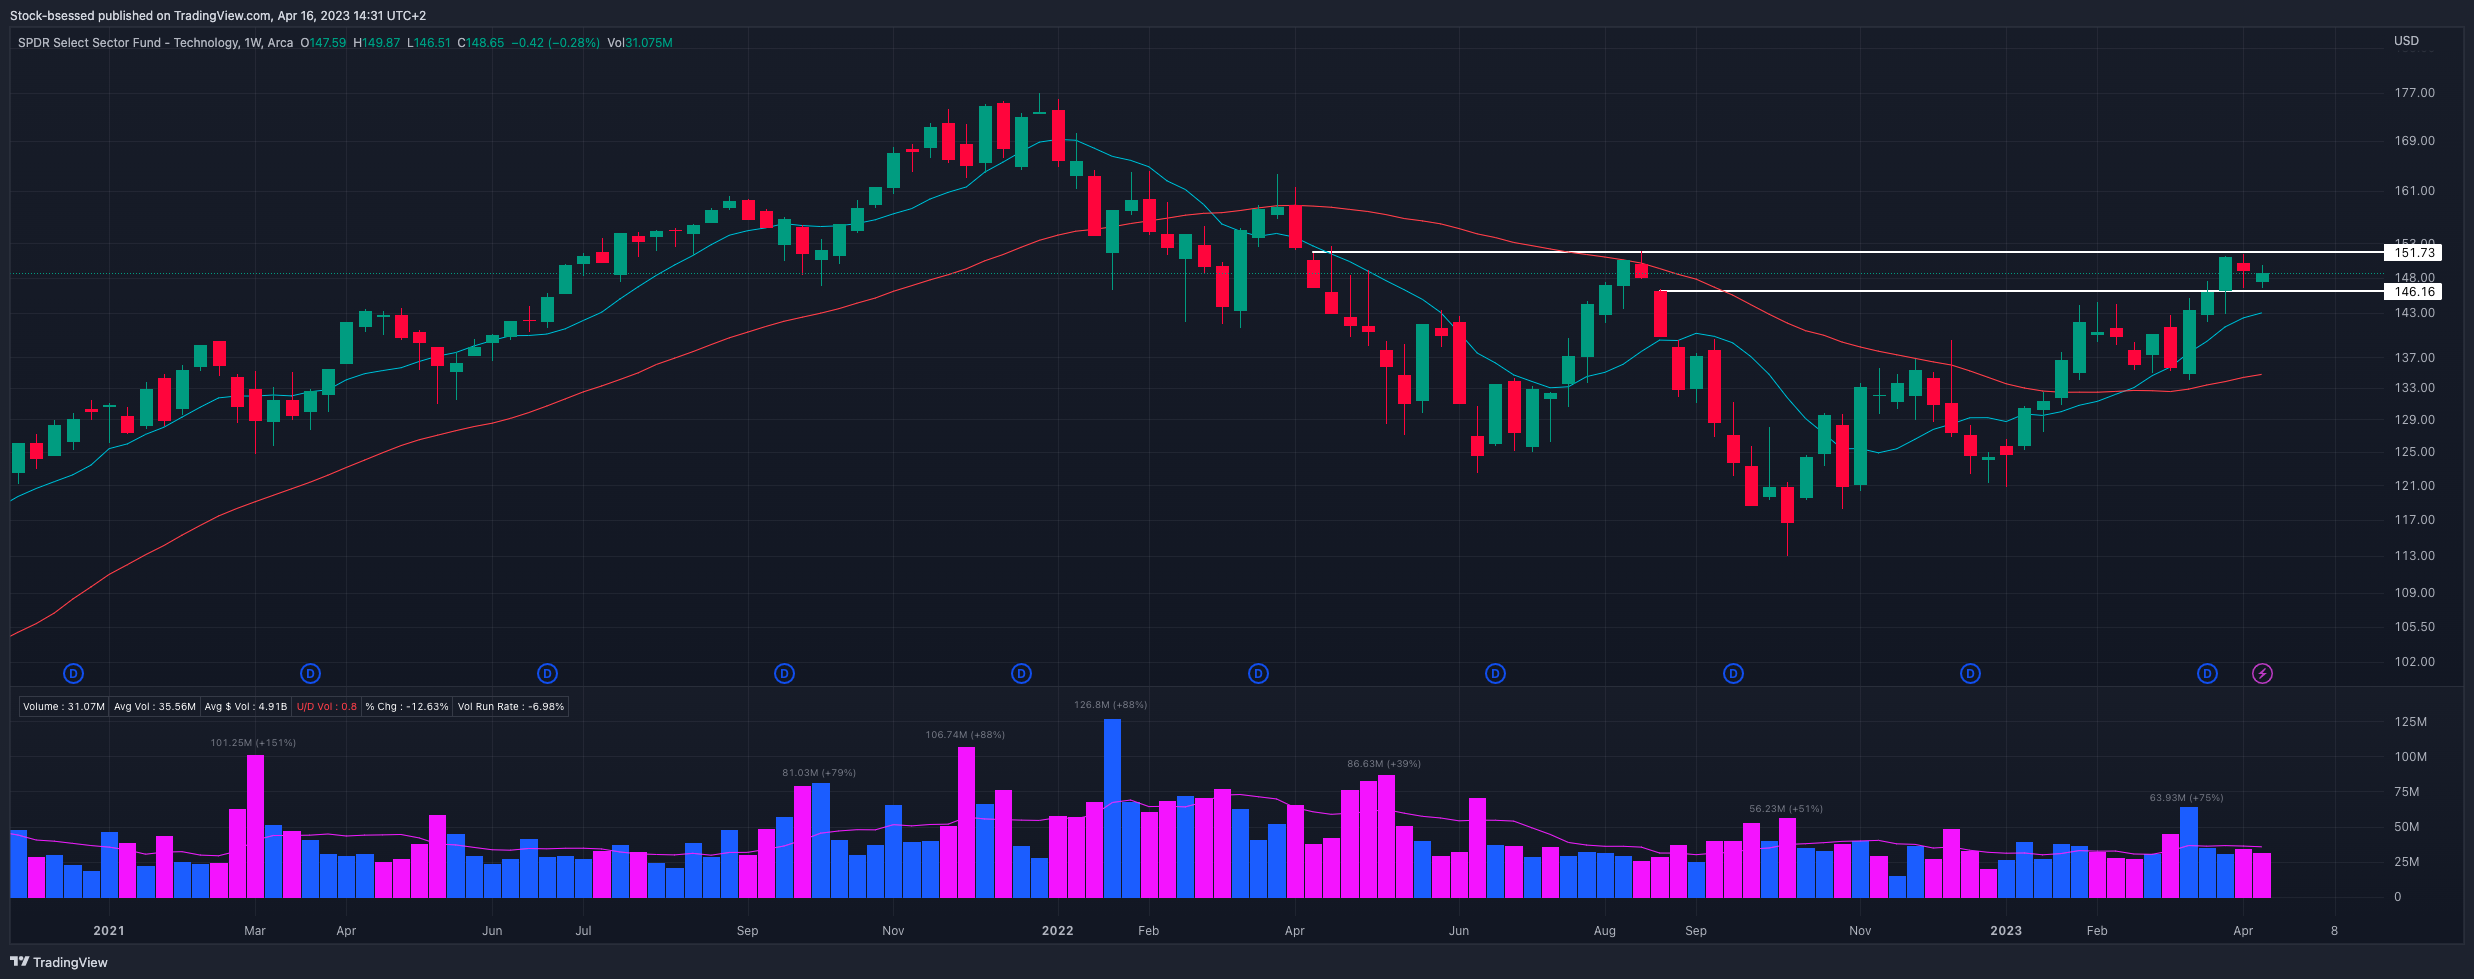
XLK 0.00%↑ Great action within this large base as it attempts to continue its bottoming process with well-defined areas around 146 and 151.75:
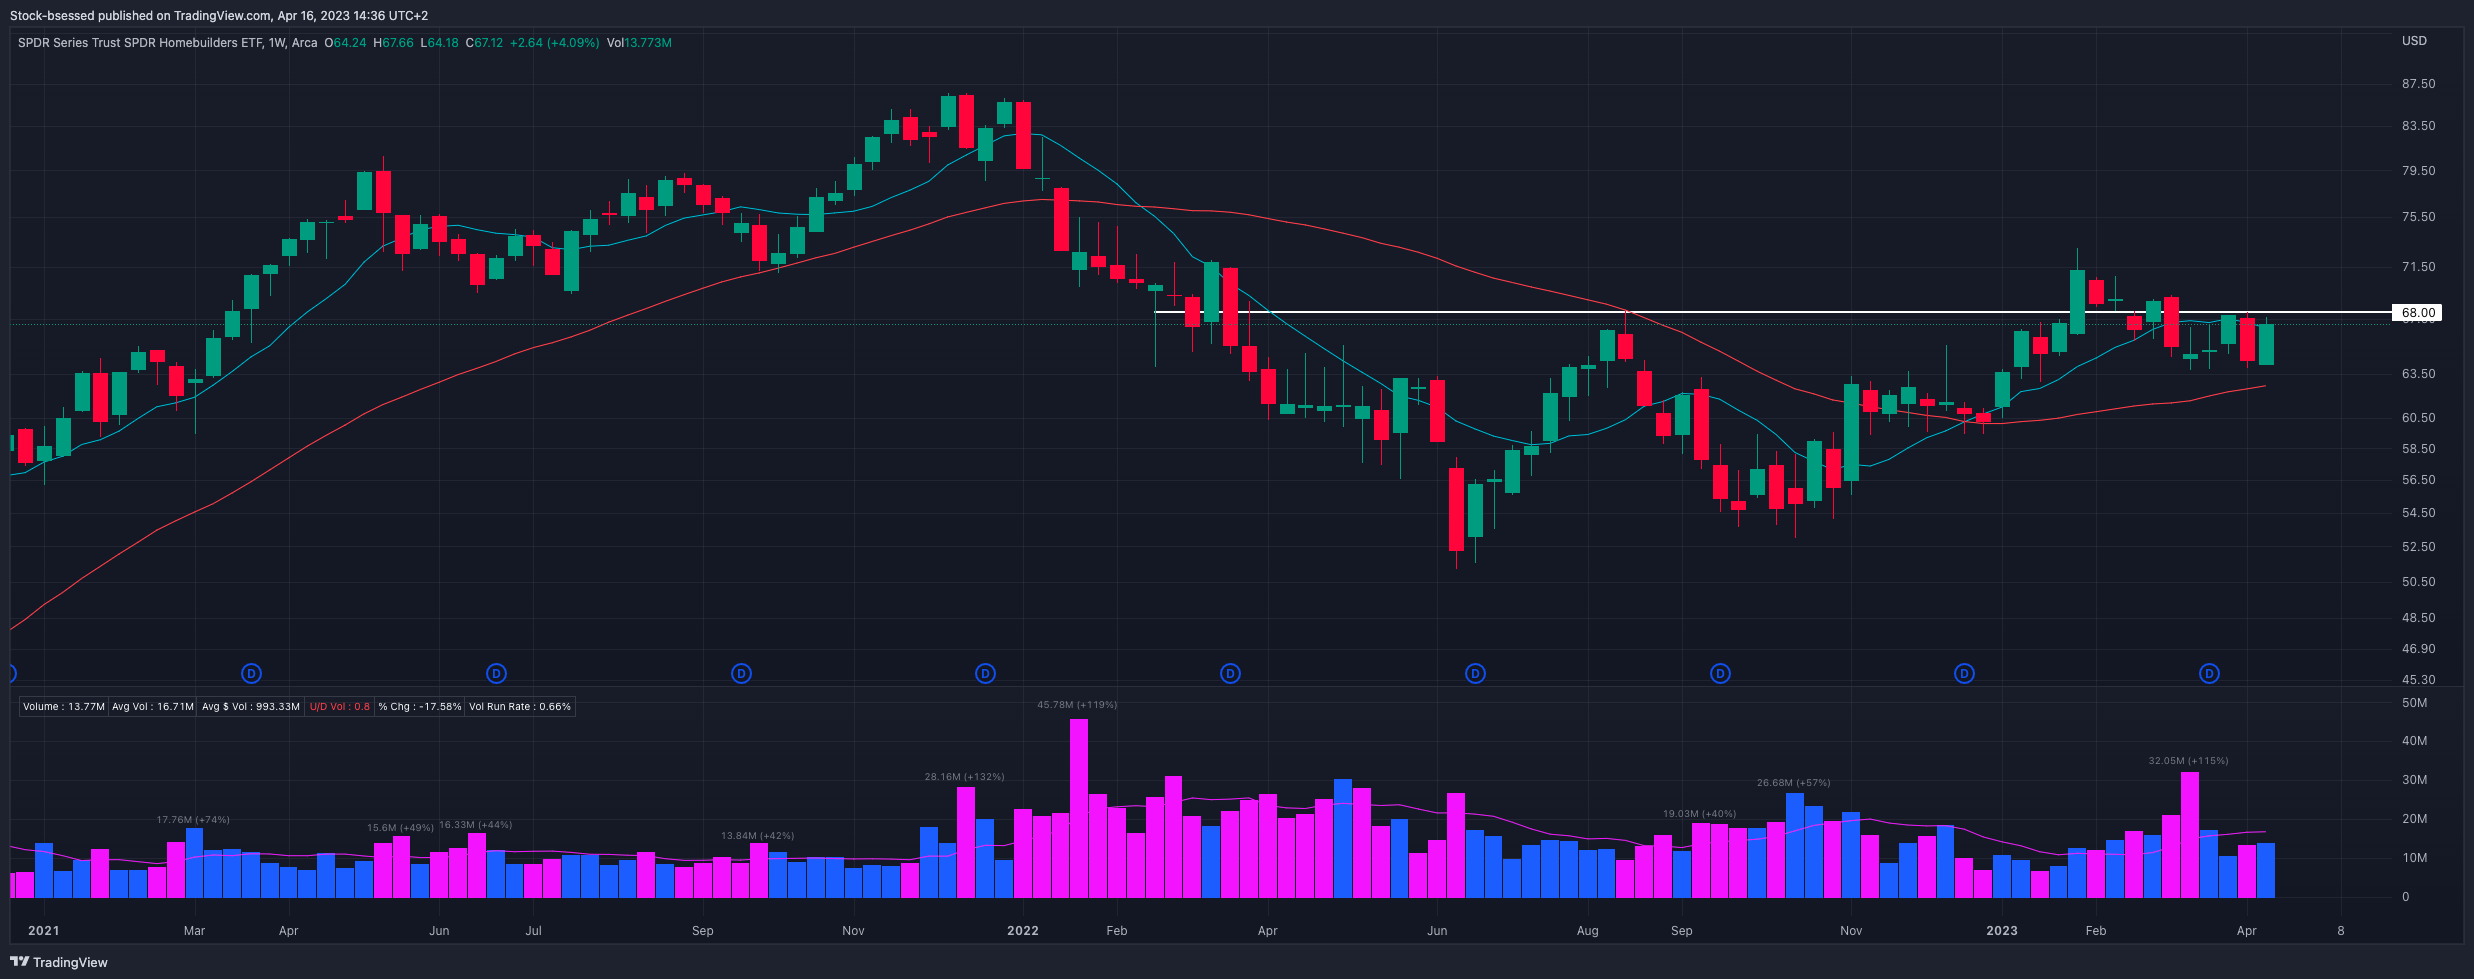
XHB 0.00%↑ Continues to show that the 68 level is an important area on the weekly:
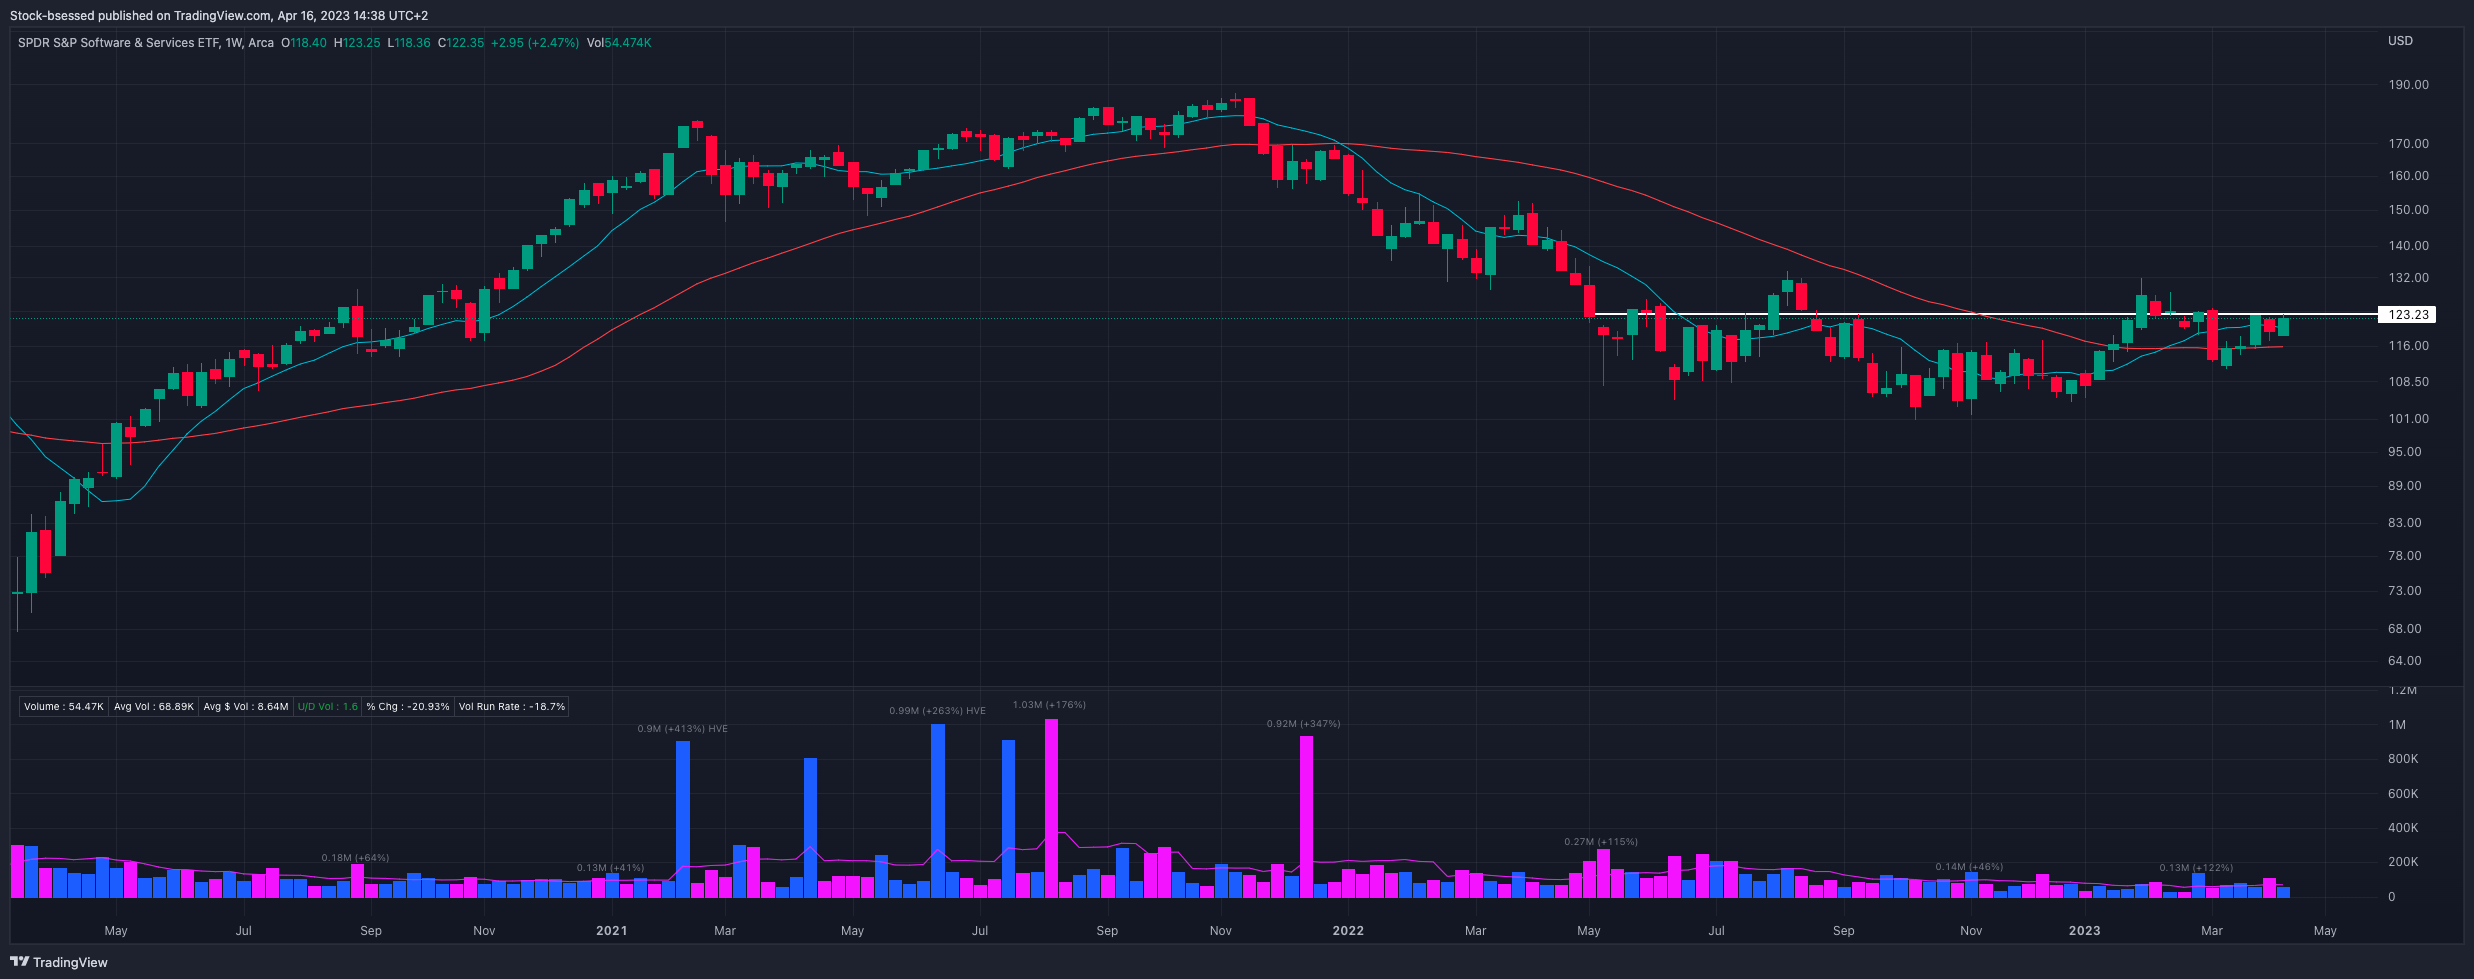
XSW 0.00%↑ This ~123.25 area shows how important it is on the weekly side of things:
Scans
52 Week highs

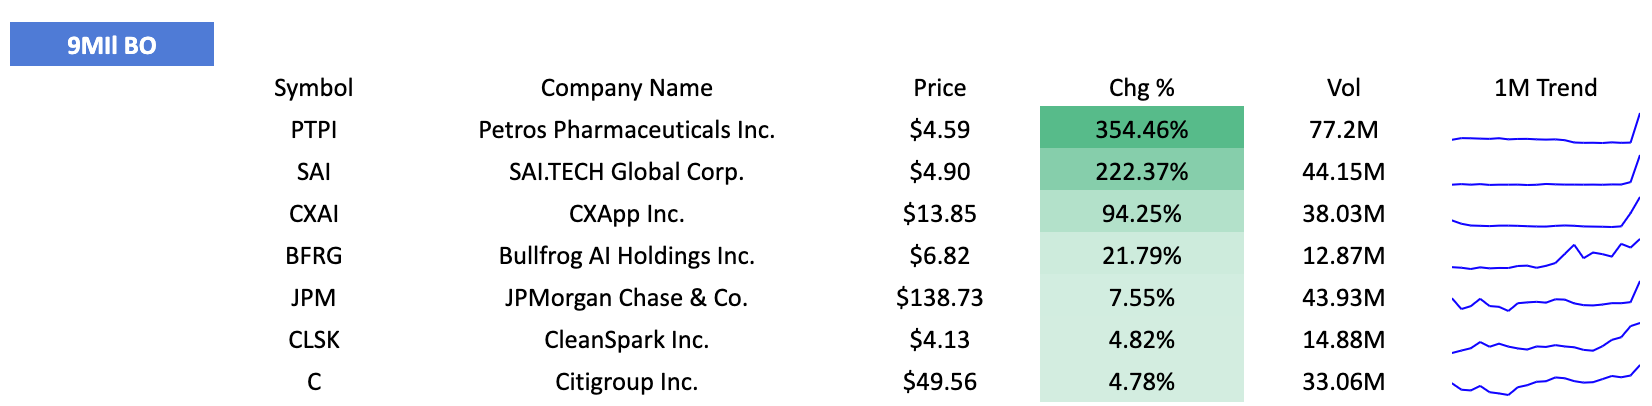
9 Million breakout
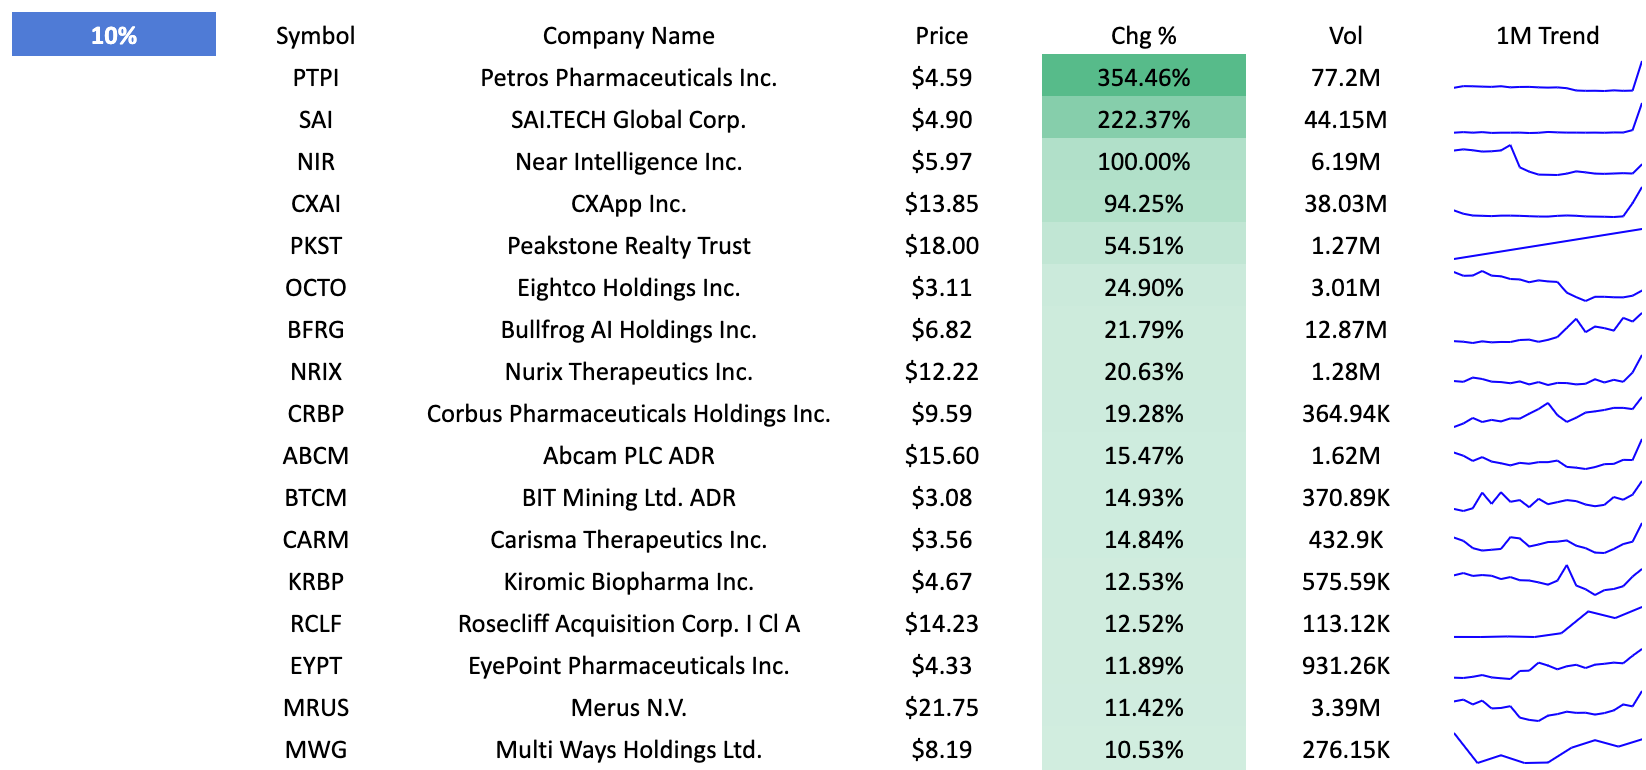
+10% Breakout
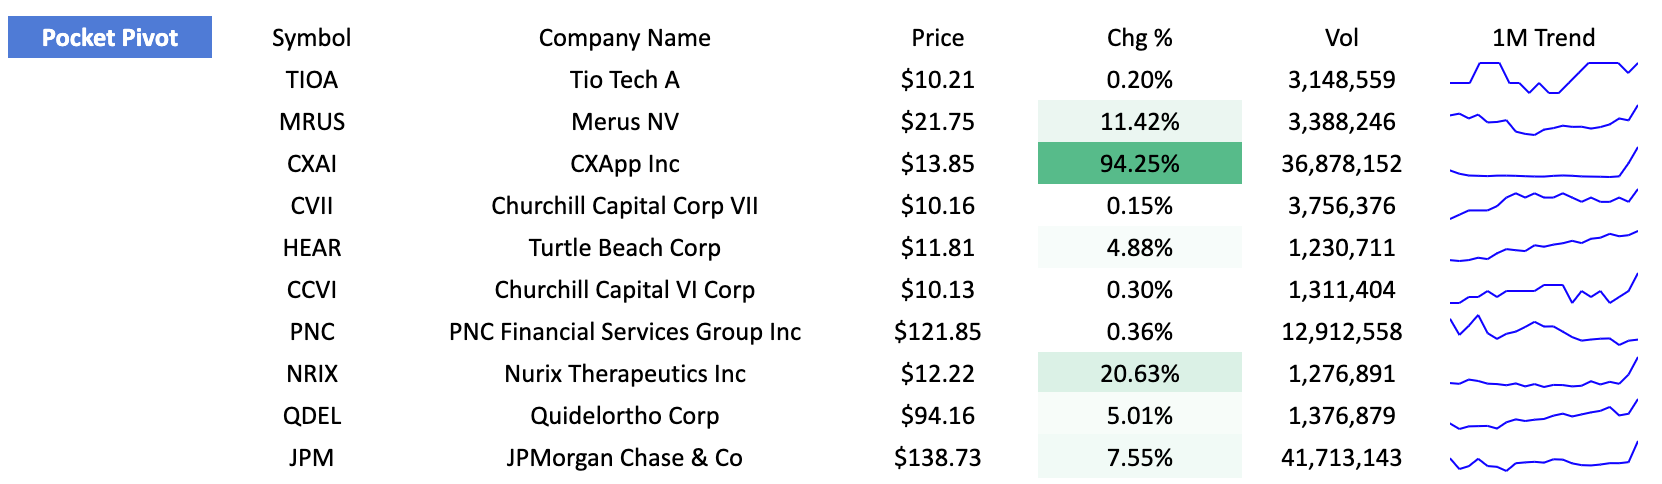
Pocket Pivot
Upcoming Earnings

Personal Portfolio Update
Recent trades:
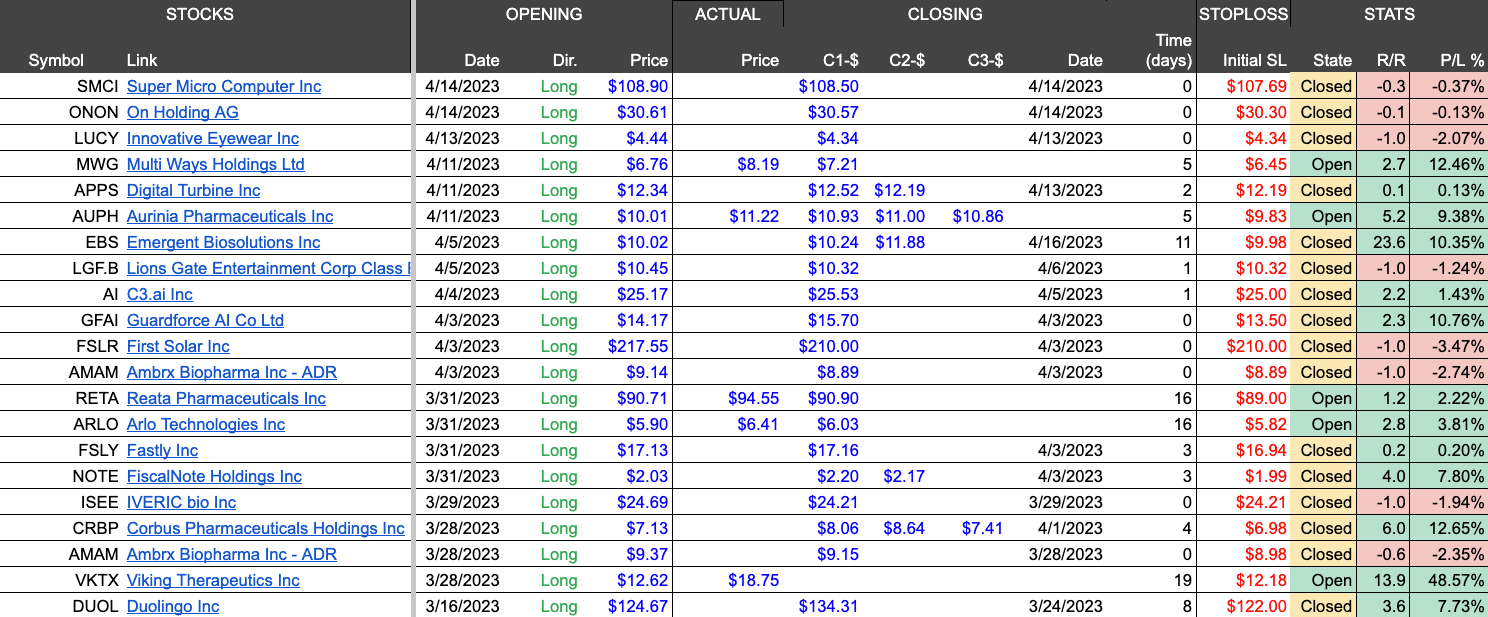
Opted to get more defensive and raise some cash into the close after seeing how an oversized position (70% equity) in ONON 0.00%↑ reversed from +5% to flat after squatting its breakout.
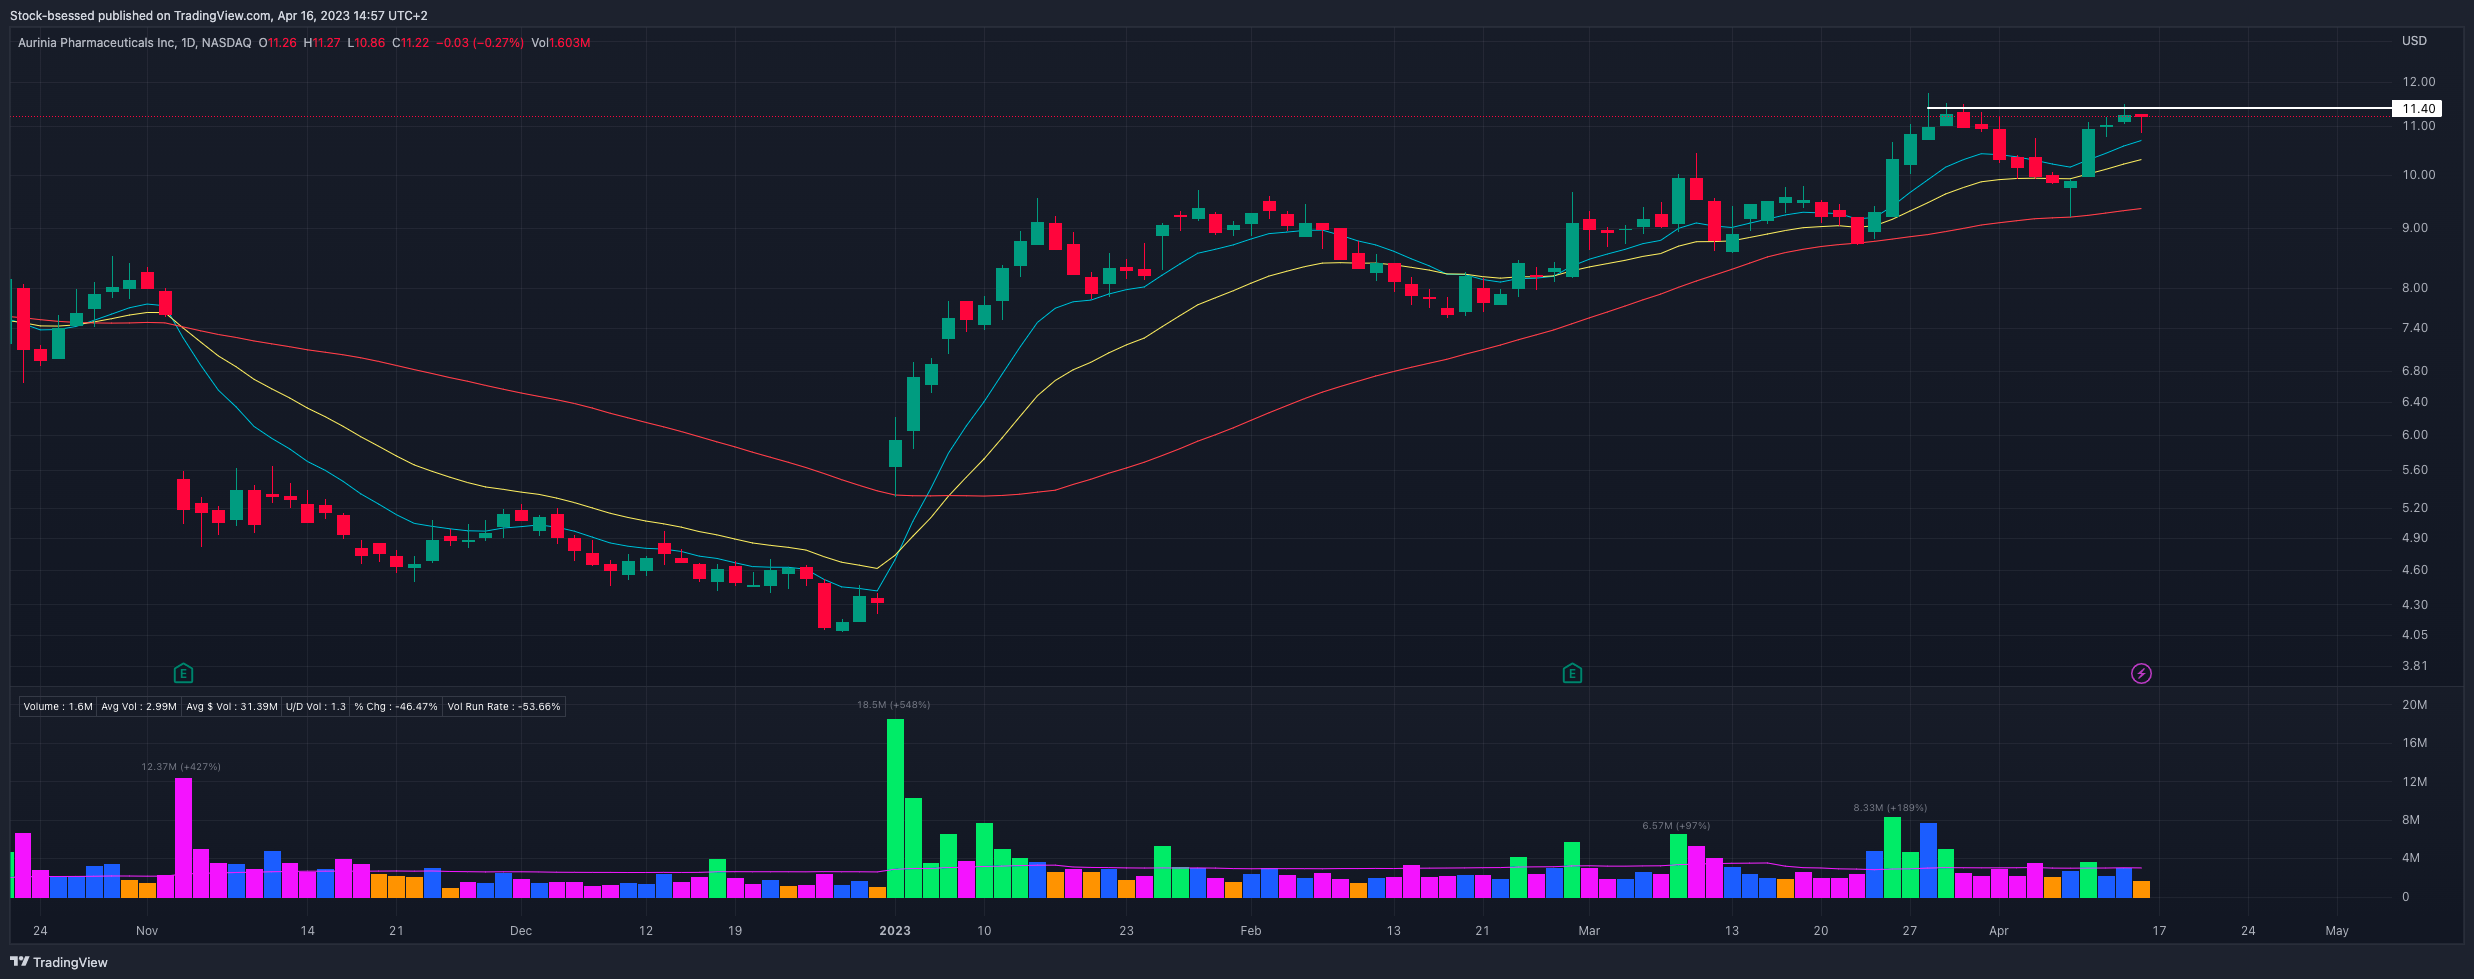
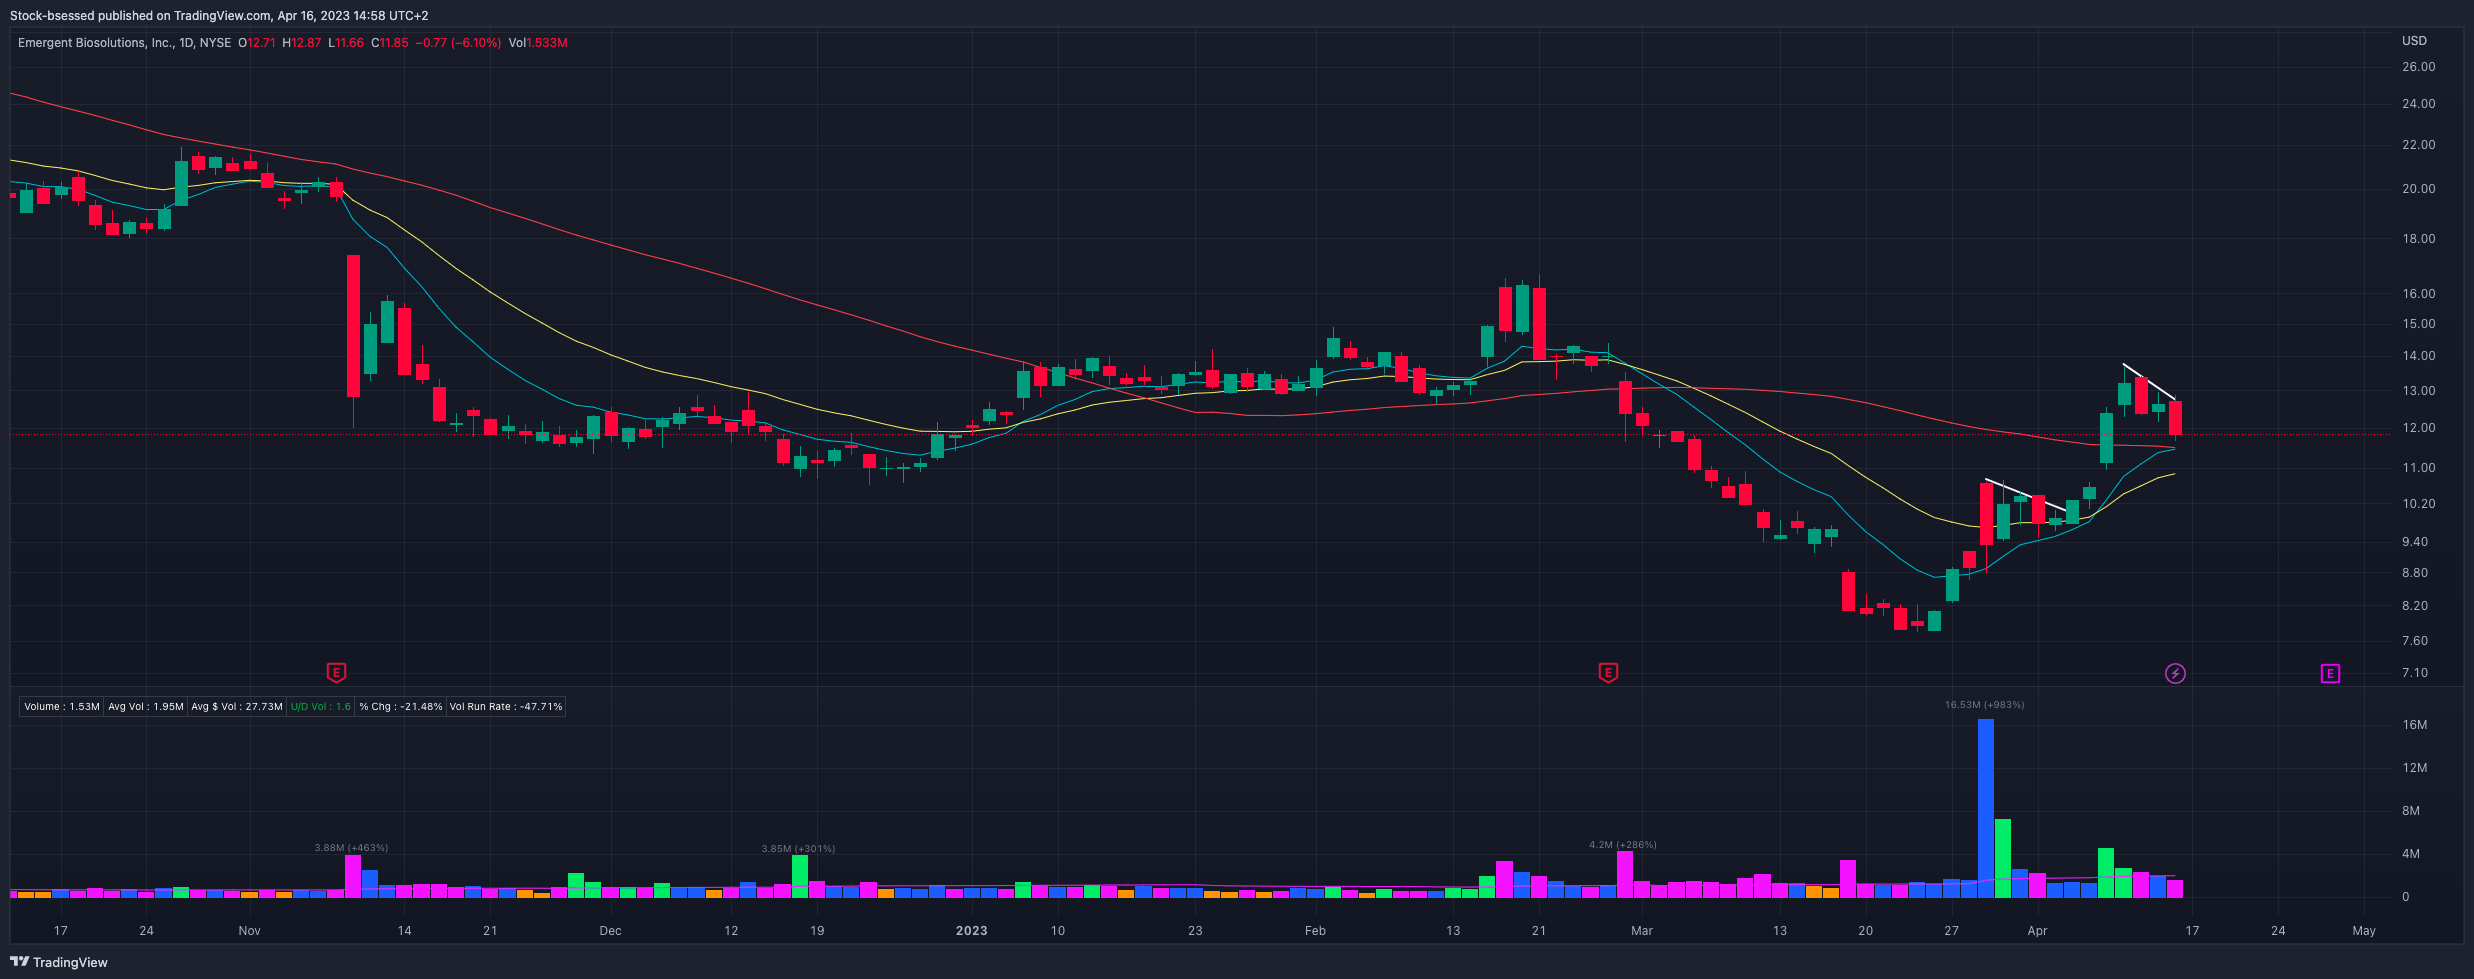
Because of this - I decided to further trim AUPH 0.00%↑ to leave a runner and completely close EBS 0.00%↑ as a +10.35% and 23.6R trade.
Still able to make progress but they are not making this easy whatsoever - the key is getting strong entries, cutting losers very quickly and not forcing trades!
Open positions:
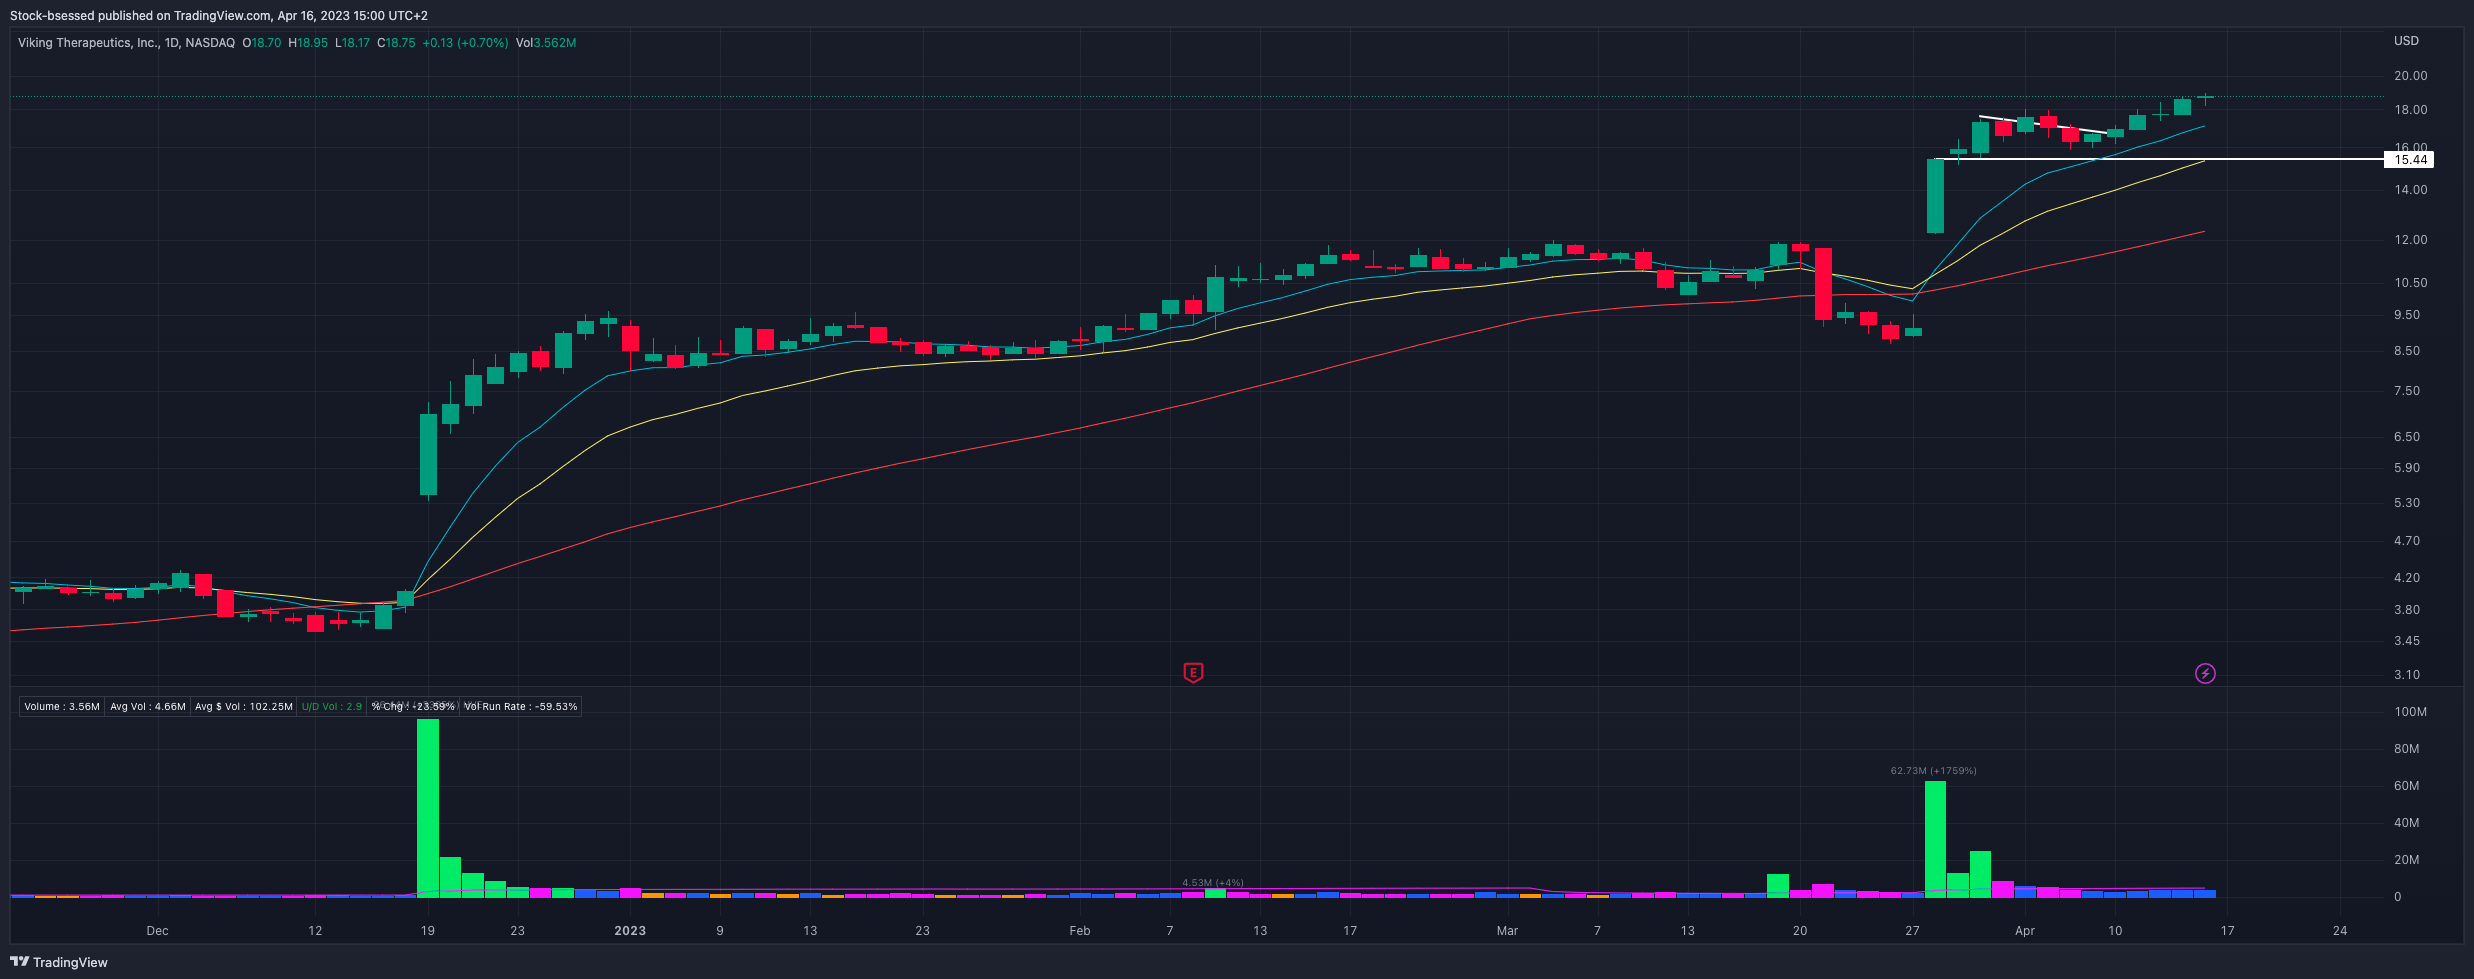
VKTX 0.00%↑ Continues trading very well and still my strong position currently +48% on remaining shares and so avoiding micro-managing this to let it work:

Closed positions:
Focus List
Reminder to NOT force anything and rather wait for your edge to show up clearly!
Pivots
High-Tight Flags
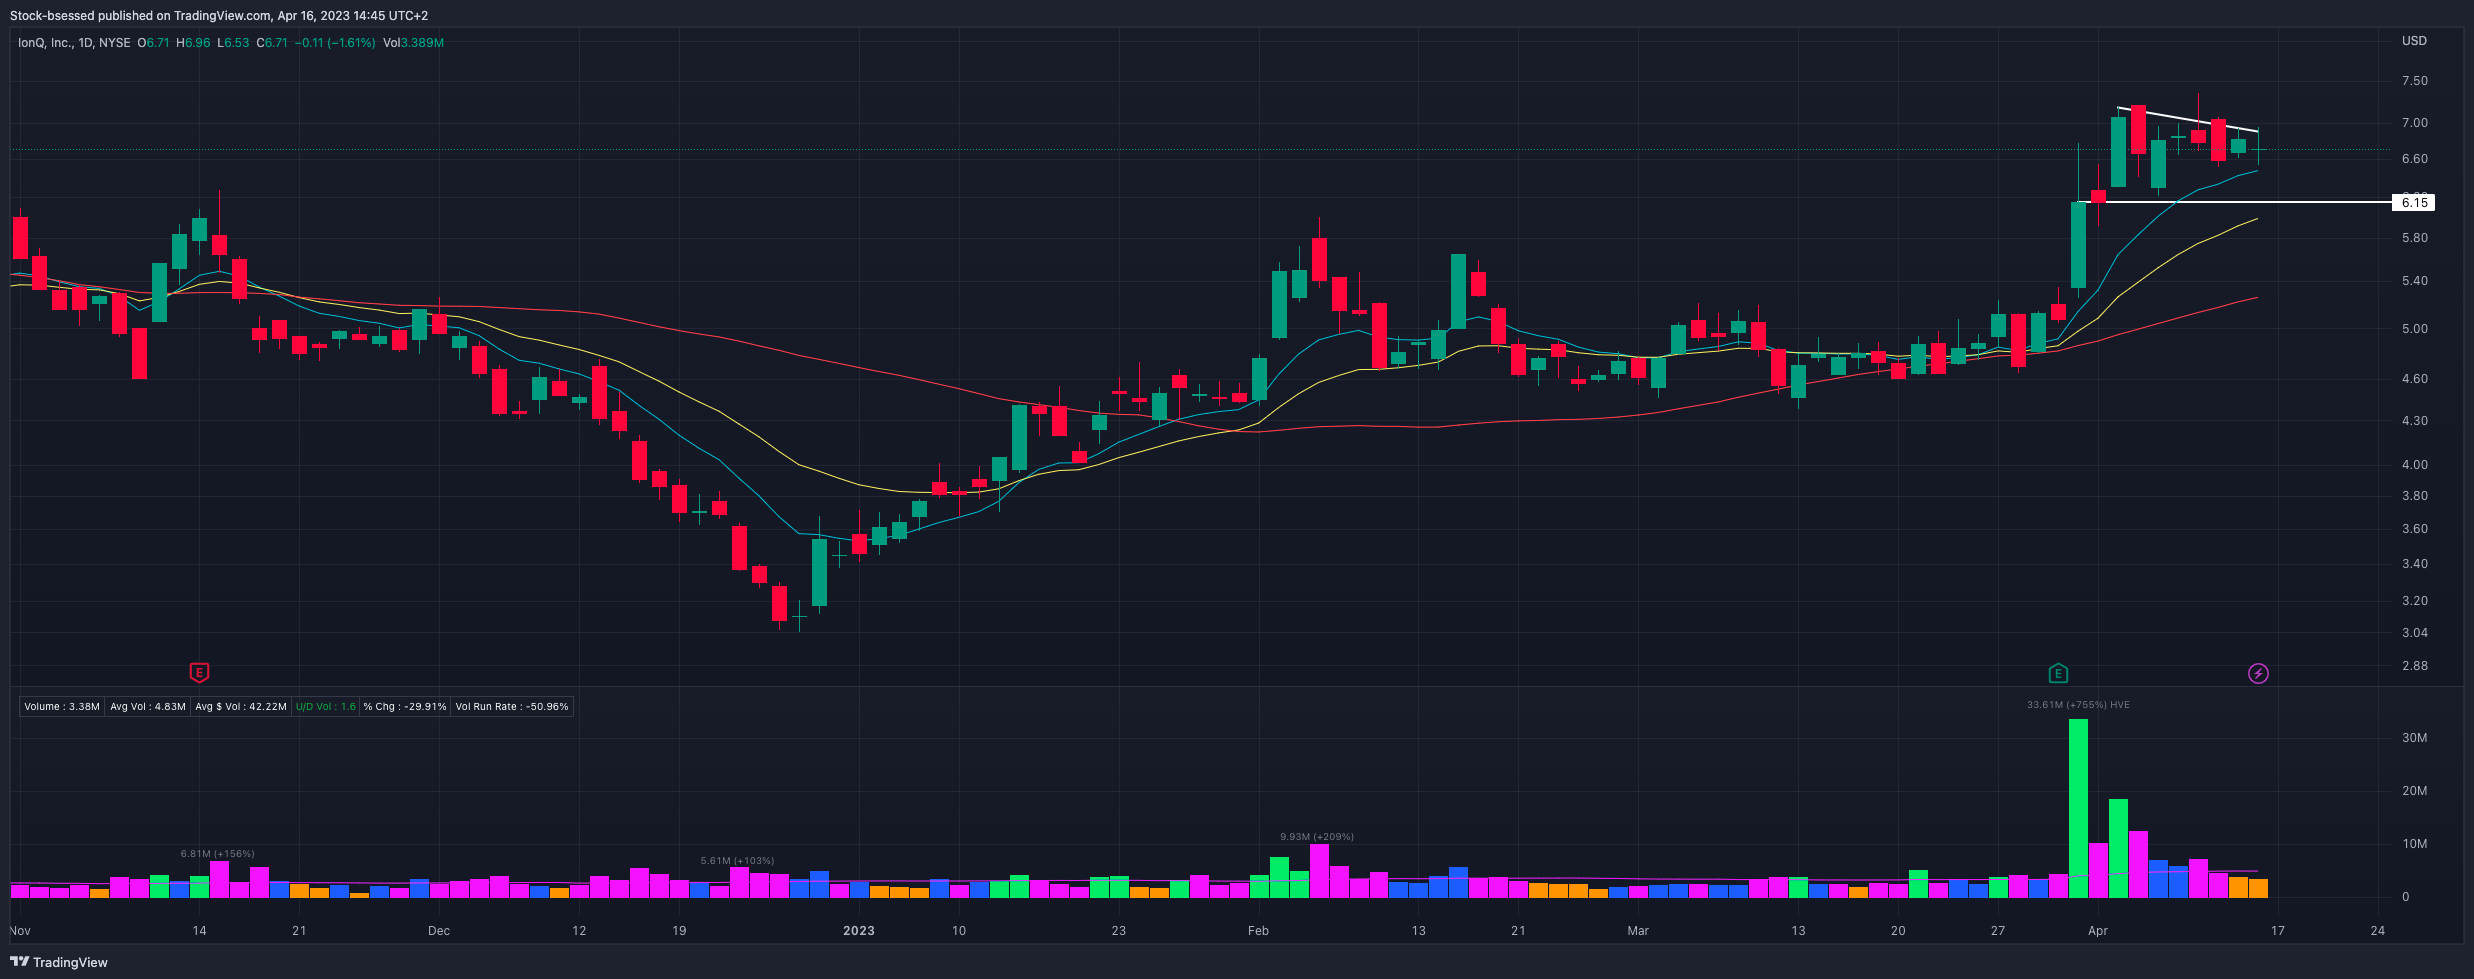
IONQ 0.00%↑ Watching for some additional tightness here:
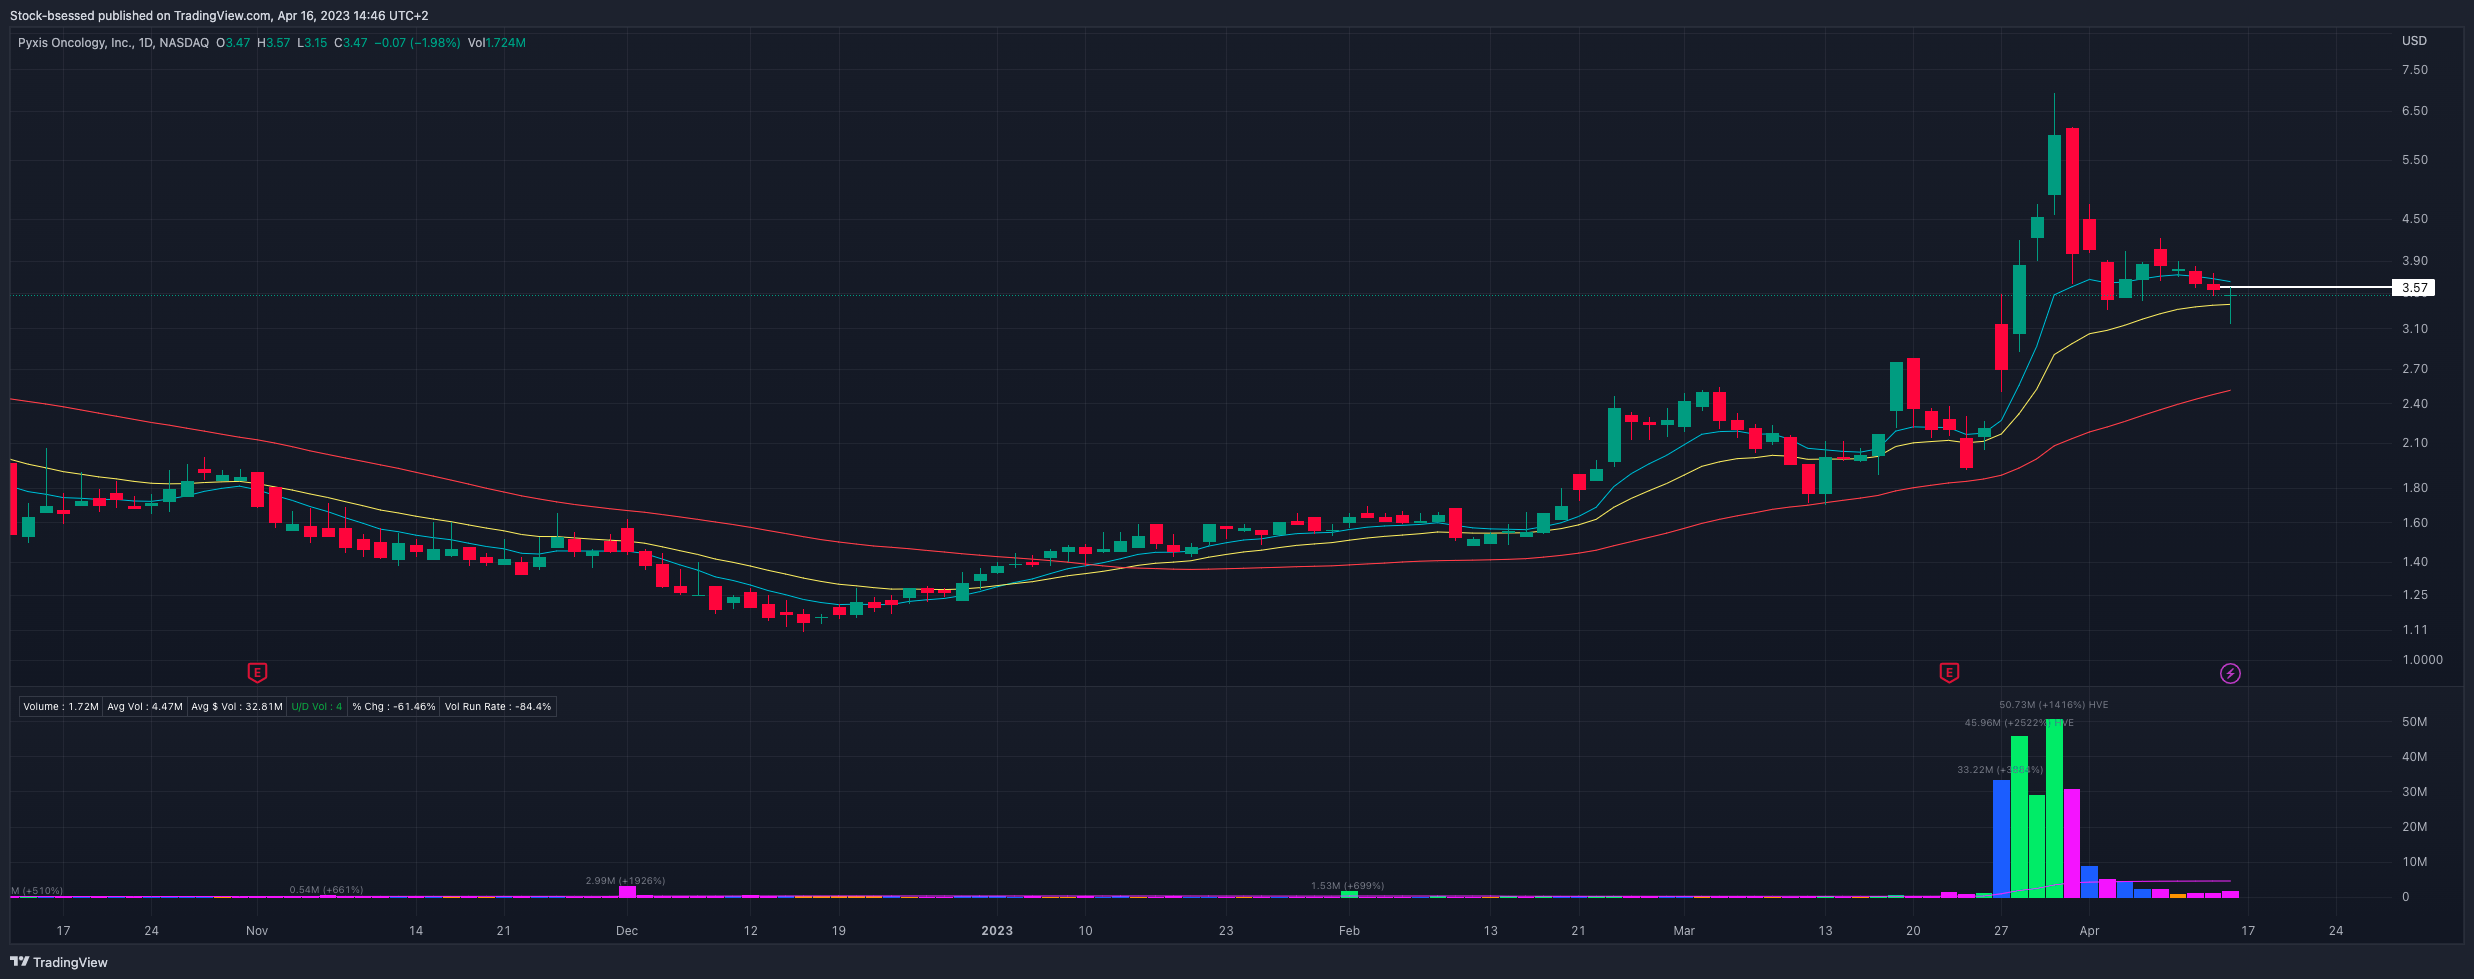
PYXS 0.00%↑ Watching for a potential mean-reversion trade on this pullback:
High Volume Close


Also, Let me know your thoughts on $SONY W&D TFs?
Nice writeup. Are you on twitter?