

Weekly review & focus list for week of 24th april
Weekly review & focus list for week of 24th april
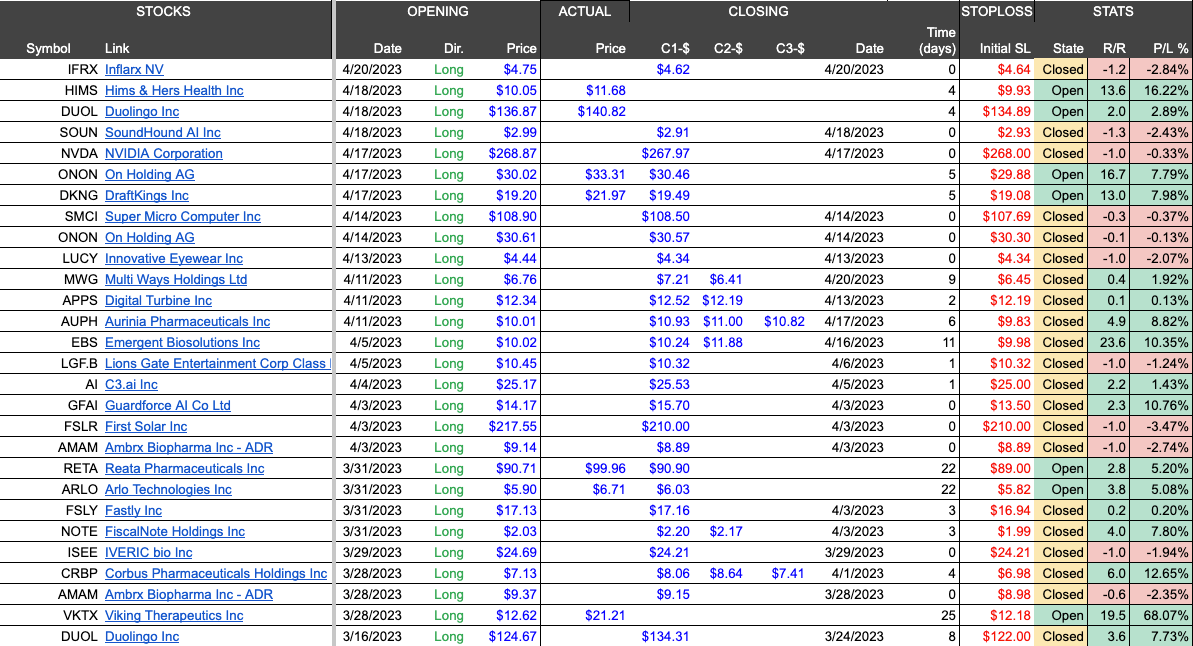
Open positions and leading stocks with strong action

Hi all! 👋
In this article I will cover:
General Market Overview
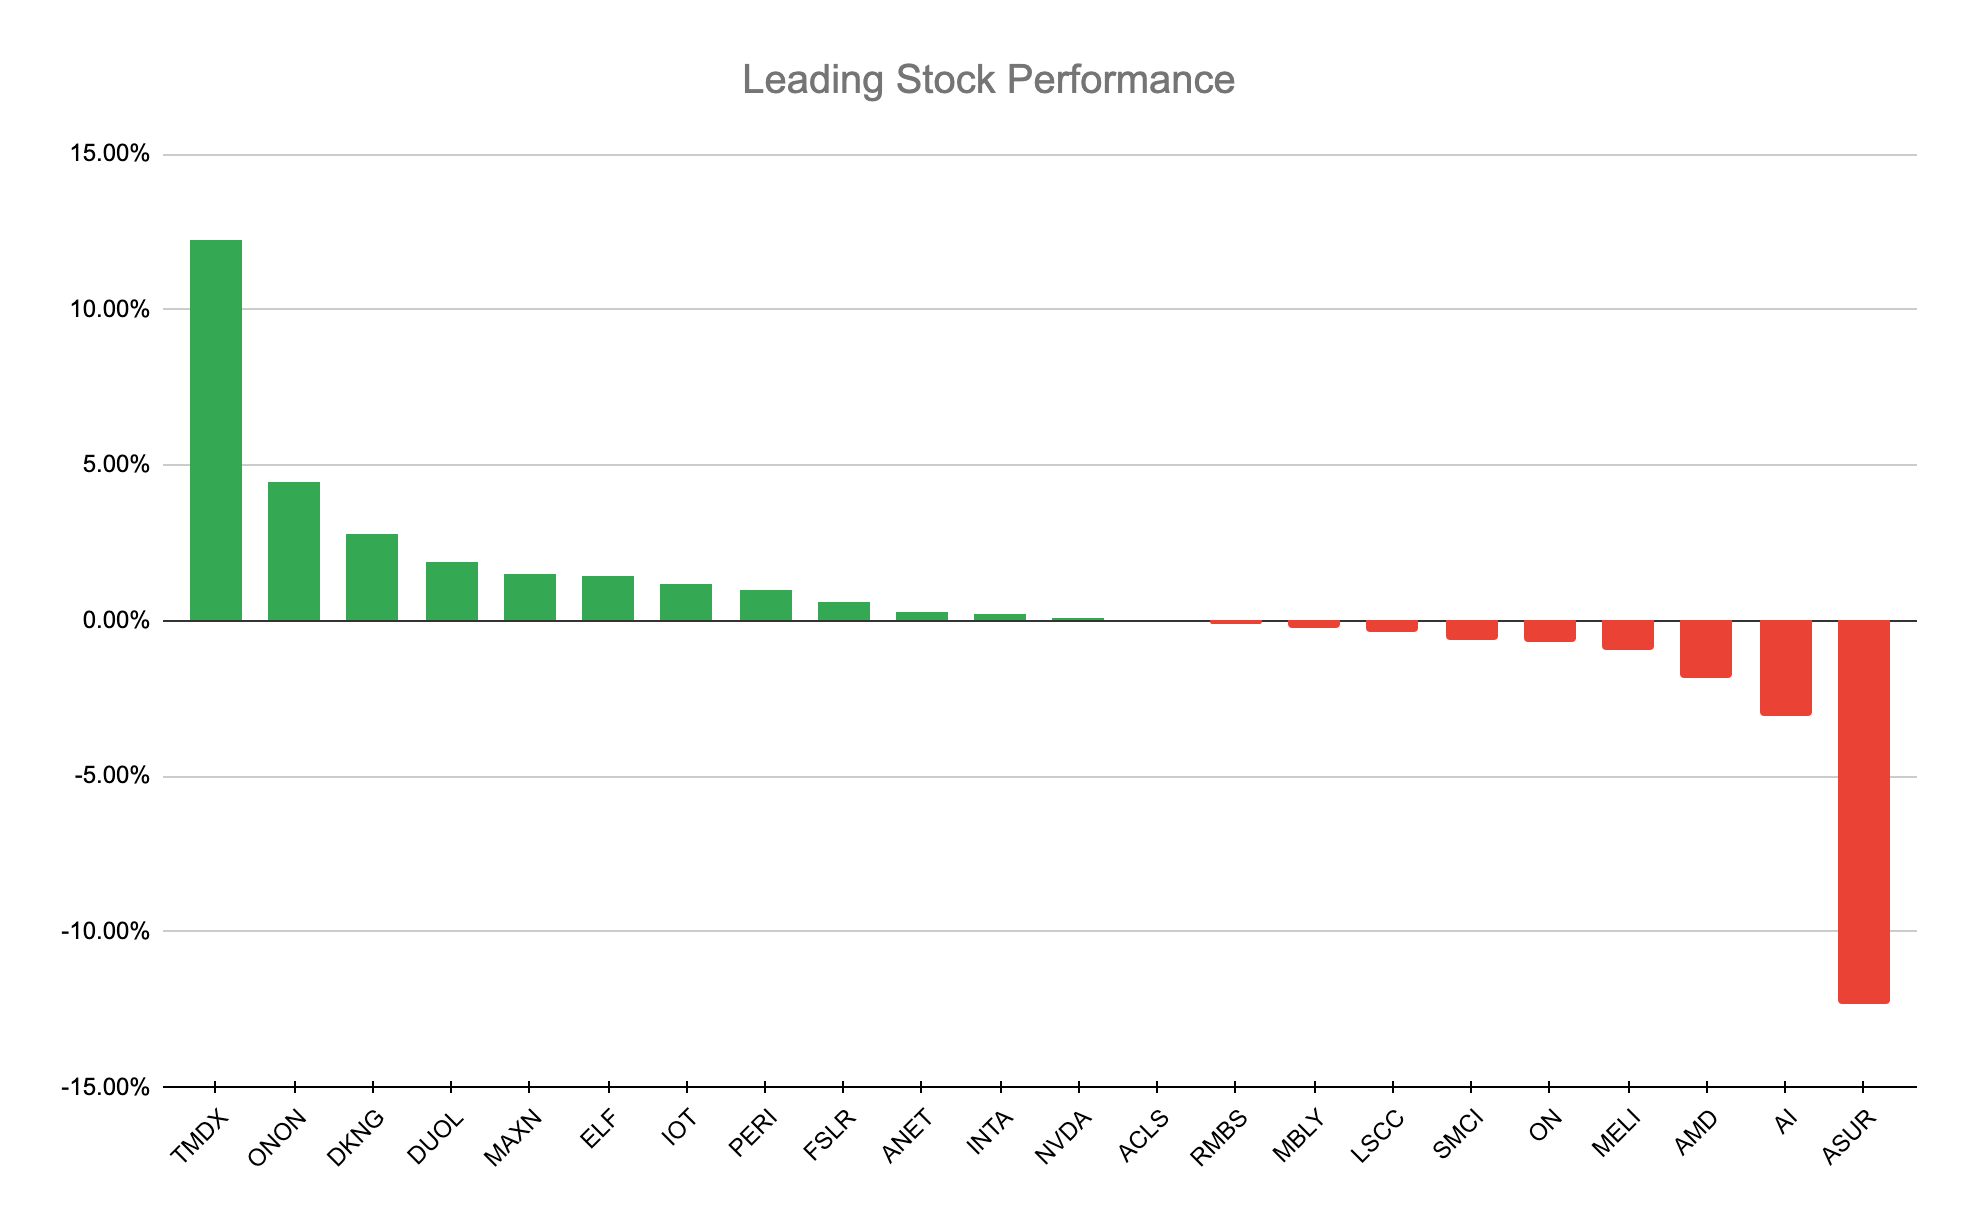
The action displayed by leading stocks with TML potential
Individual Sector Analysis - Which groups are breaking down vs showing relative strength
4 Helpful Scans to get potential leaders on our radar
Links to TradingView watchlists
Personal Portfolio Update
Stocks currently on my focus list with actionable trade ideas
Stockbsessed is neither an investment or financial advisor. Stockbsessed does not provide financial advice and none of the information being provided is to be seen as such.
Check out my new website here - stockbsessed.com
General Market Overview
Lots of intraday volatility this week but I would be lying if I said things were not looking positive and very encouraging with the way we closed this week.
Buyers showed up once more at key areas to support leading stocks, individual sectors and the indexes to close the week - the market has had every reason and opportunity to break down yet it keeps shrugging off weakness and getting bought up while holding key spots.
Certainly still seeing signs for the other side of things as I want to see an improvement in overall breadth - it still remains somewhat of a stock-pickers market with select stocks working and several others failing to follow through on breakouts, but this is a start.
Open positions acting very well and have been my primary focus to block out the noise and divert my attention away from the indexes. What is most important to me is:
How open positions are acting
How leading stocks are acting
Considering all of the above positions closed up excellently both on the day and week - I will continue following my plan of giving these the time and space to work, expecting pullbacks along the way and trimming into strength when getting too extended while moving my stops up along the way.

Net decliners on the session but positive action in the fact that all indexes closed positive on the session but what is most encouraging is that they all went out near the highs of the day - it is very good to see that they have ability to shrug off intra-day weakness as buyers came in to close strong.
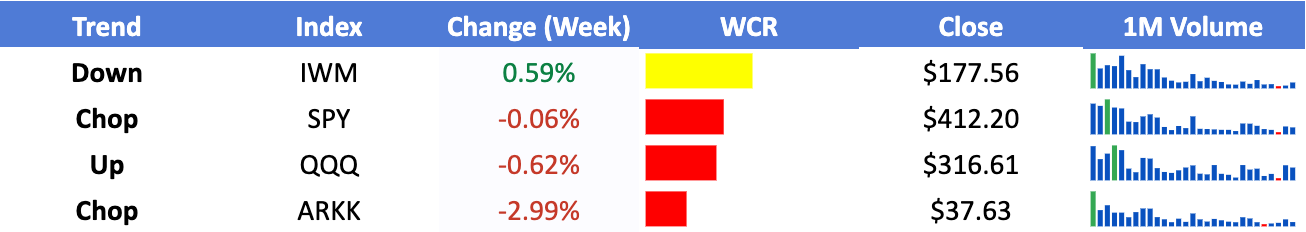
More tight weekly closes all around besides ARKK 0.00%↑ - would have preferred stronger closes on a weekly basis but key levels were held once more.
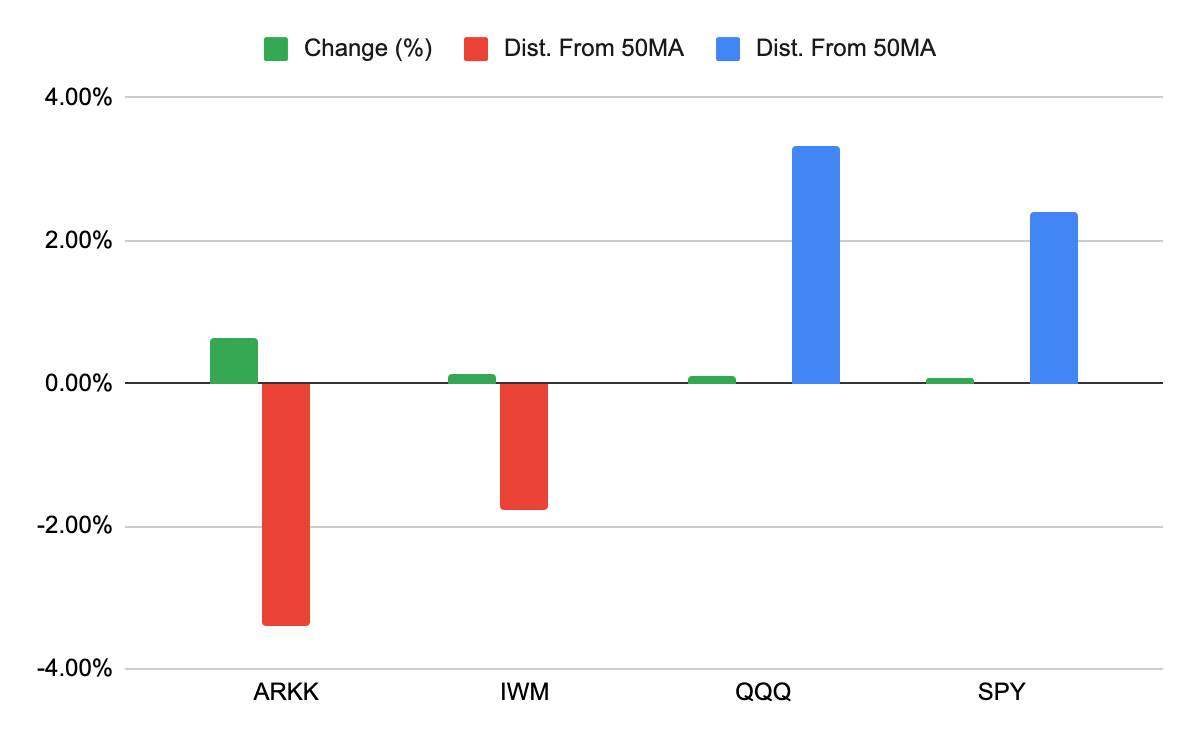
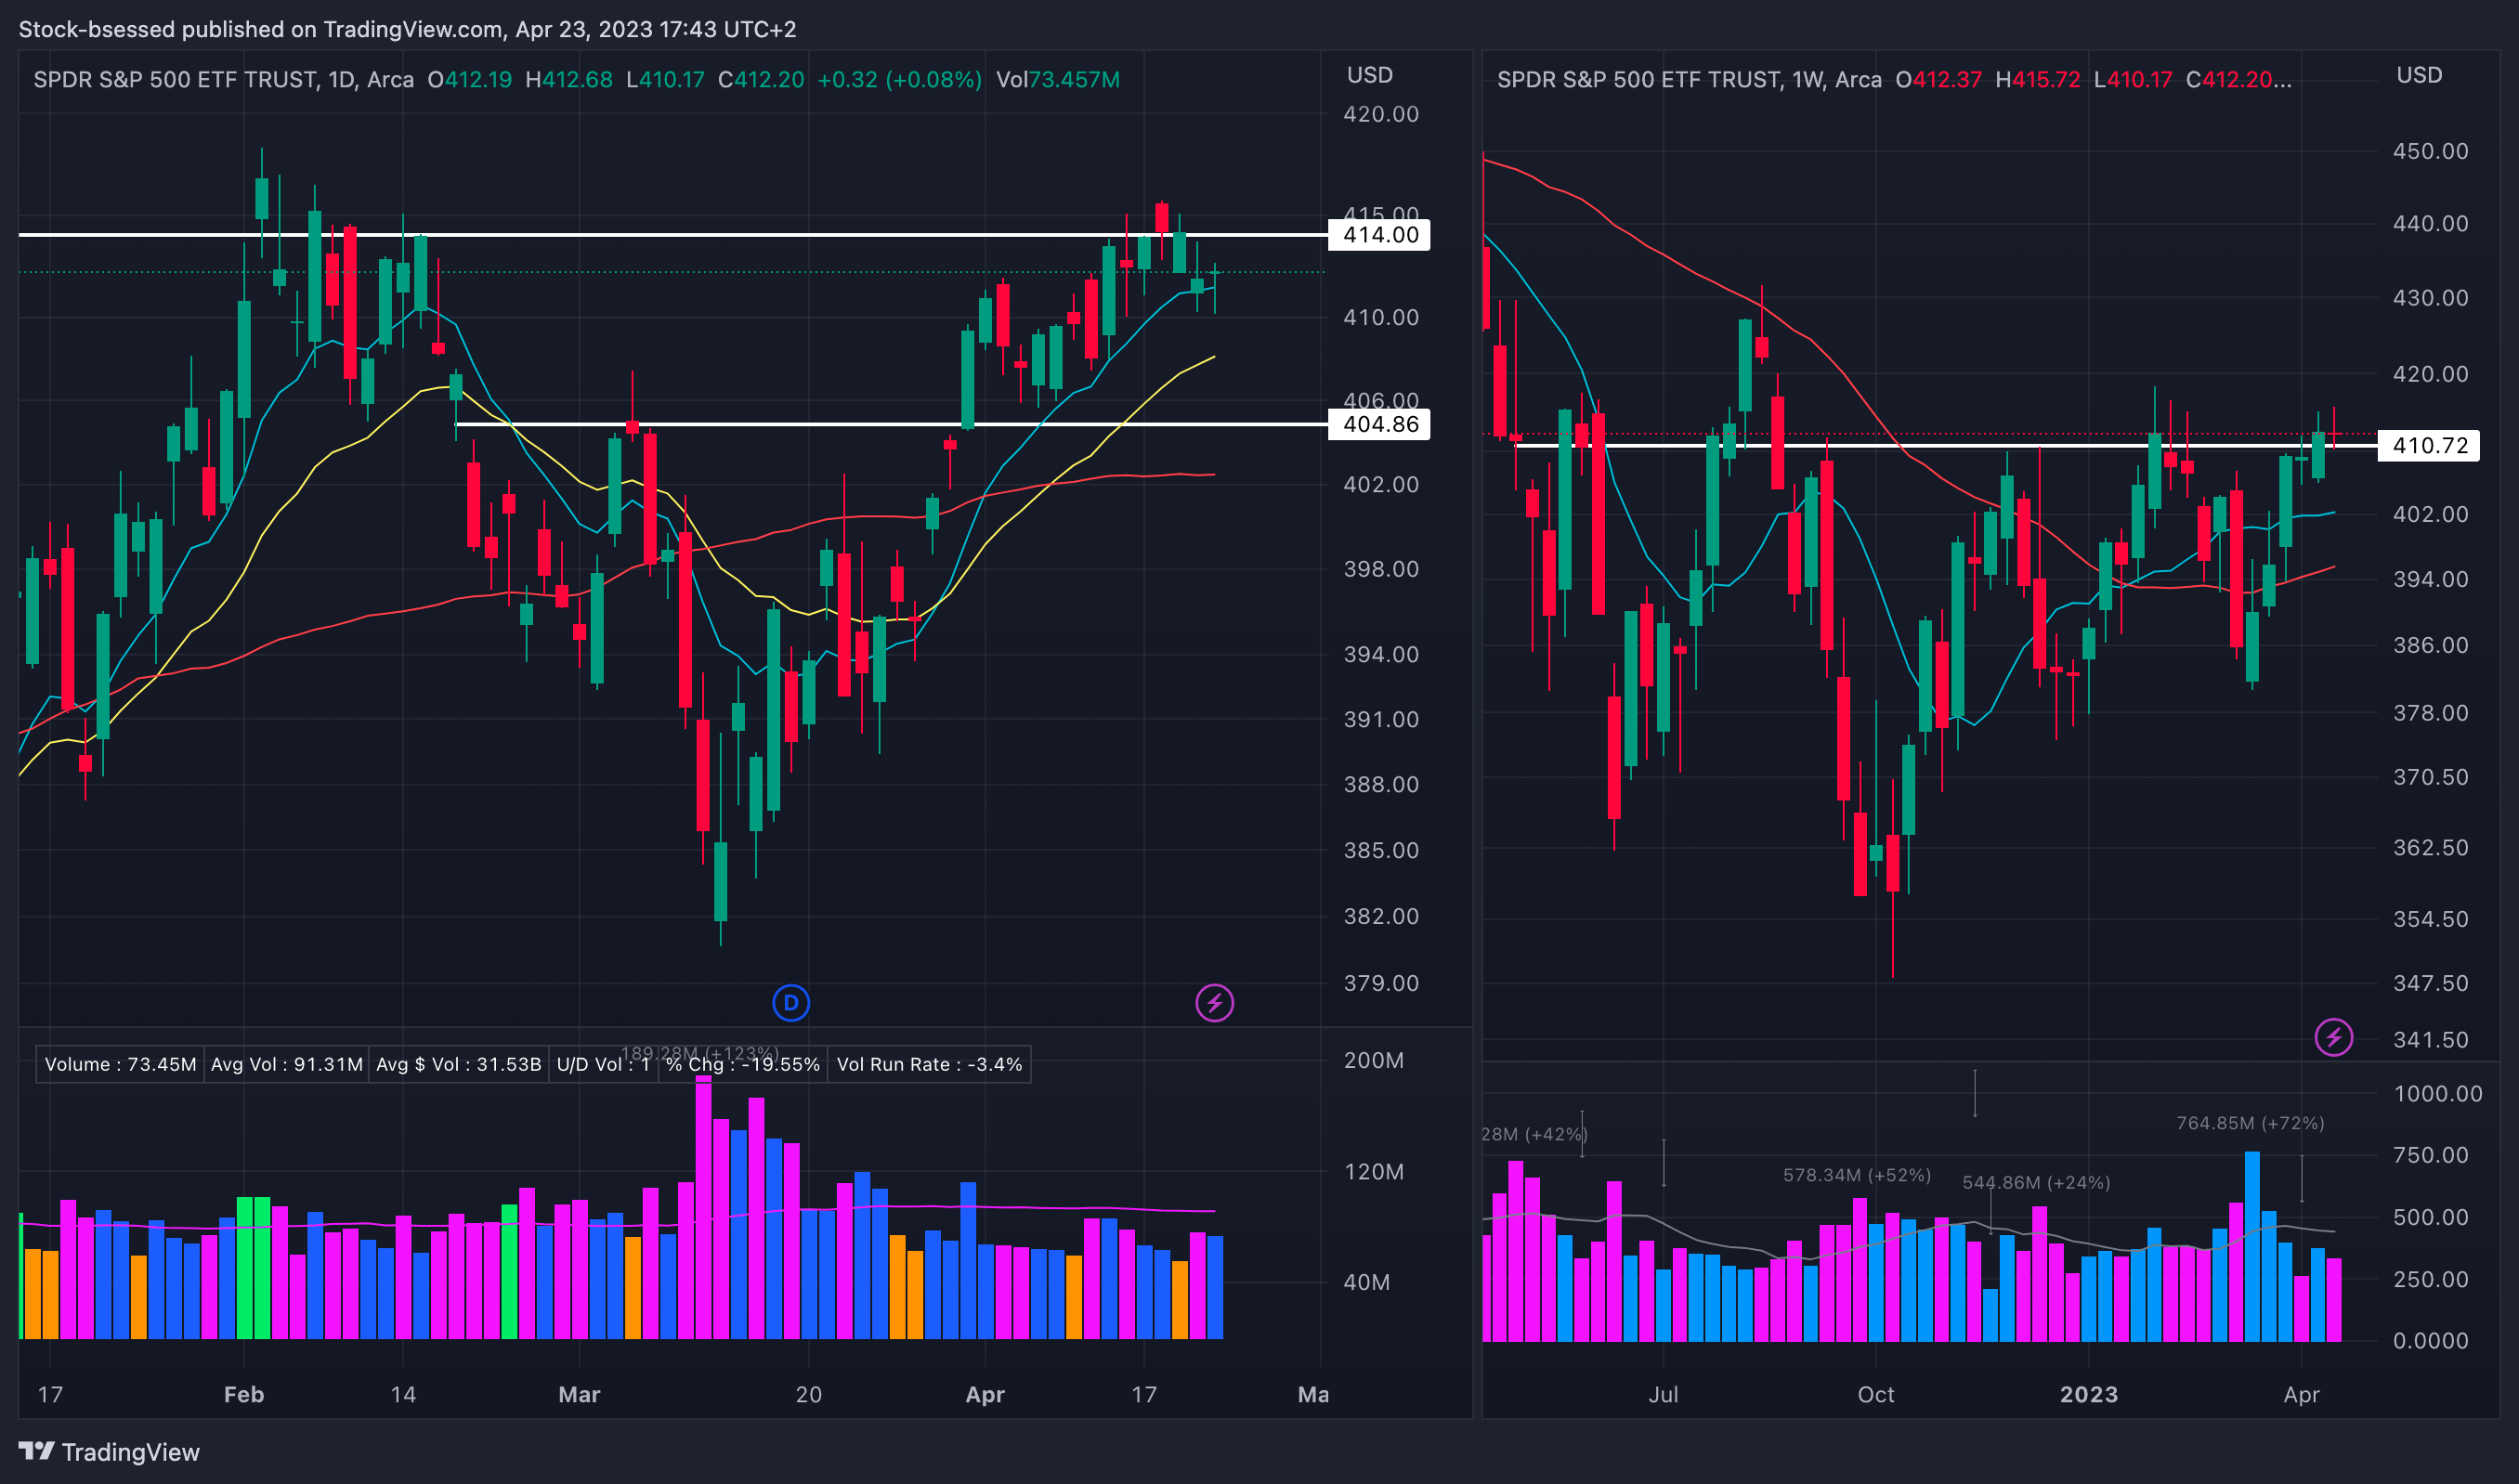
SPY 0.00%↑ Nice shakeout and close above the 10EMA. Holds the key 410 area:
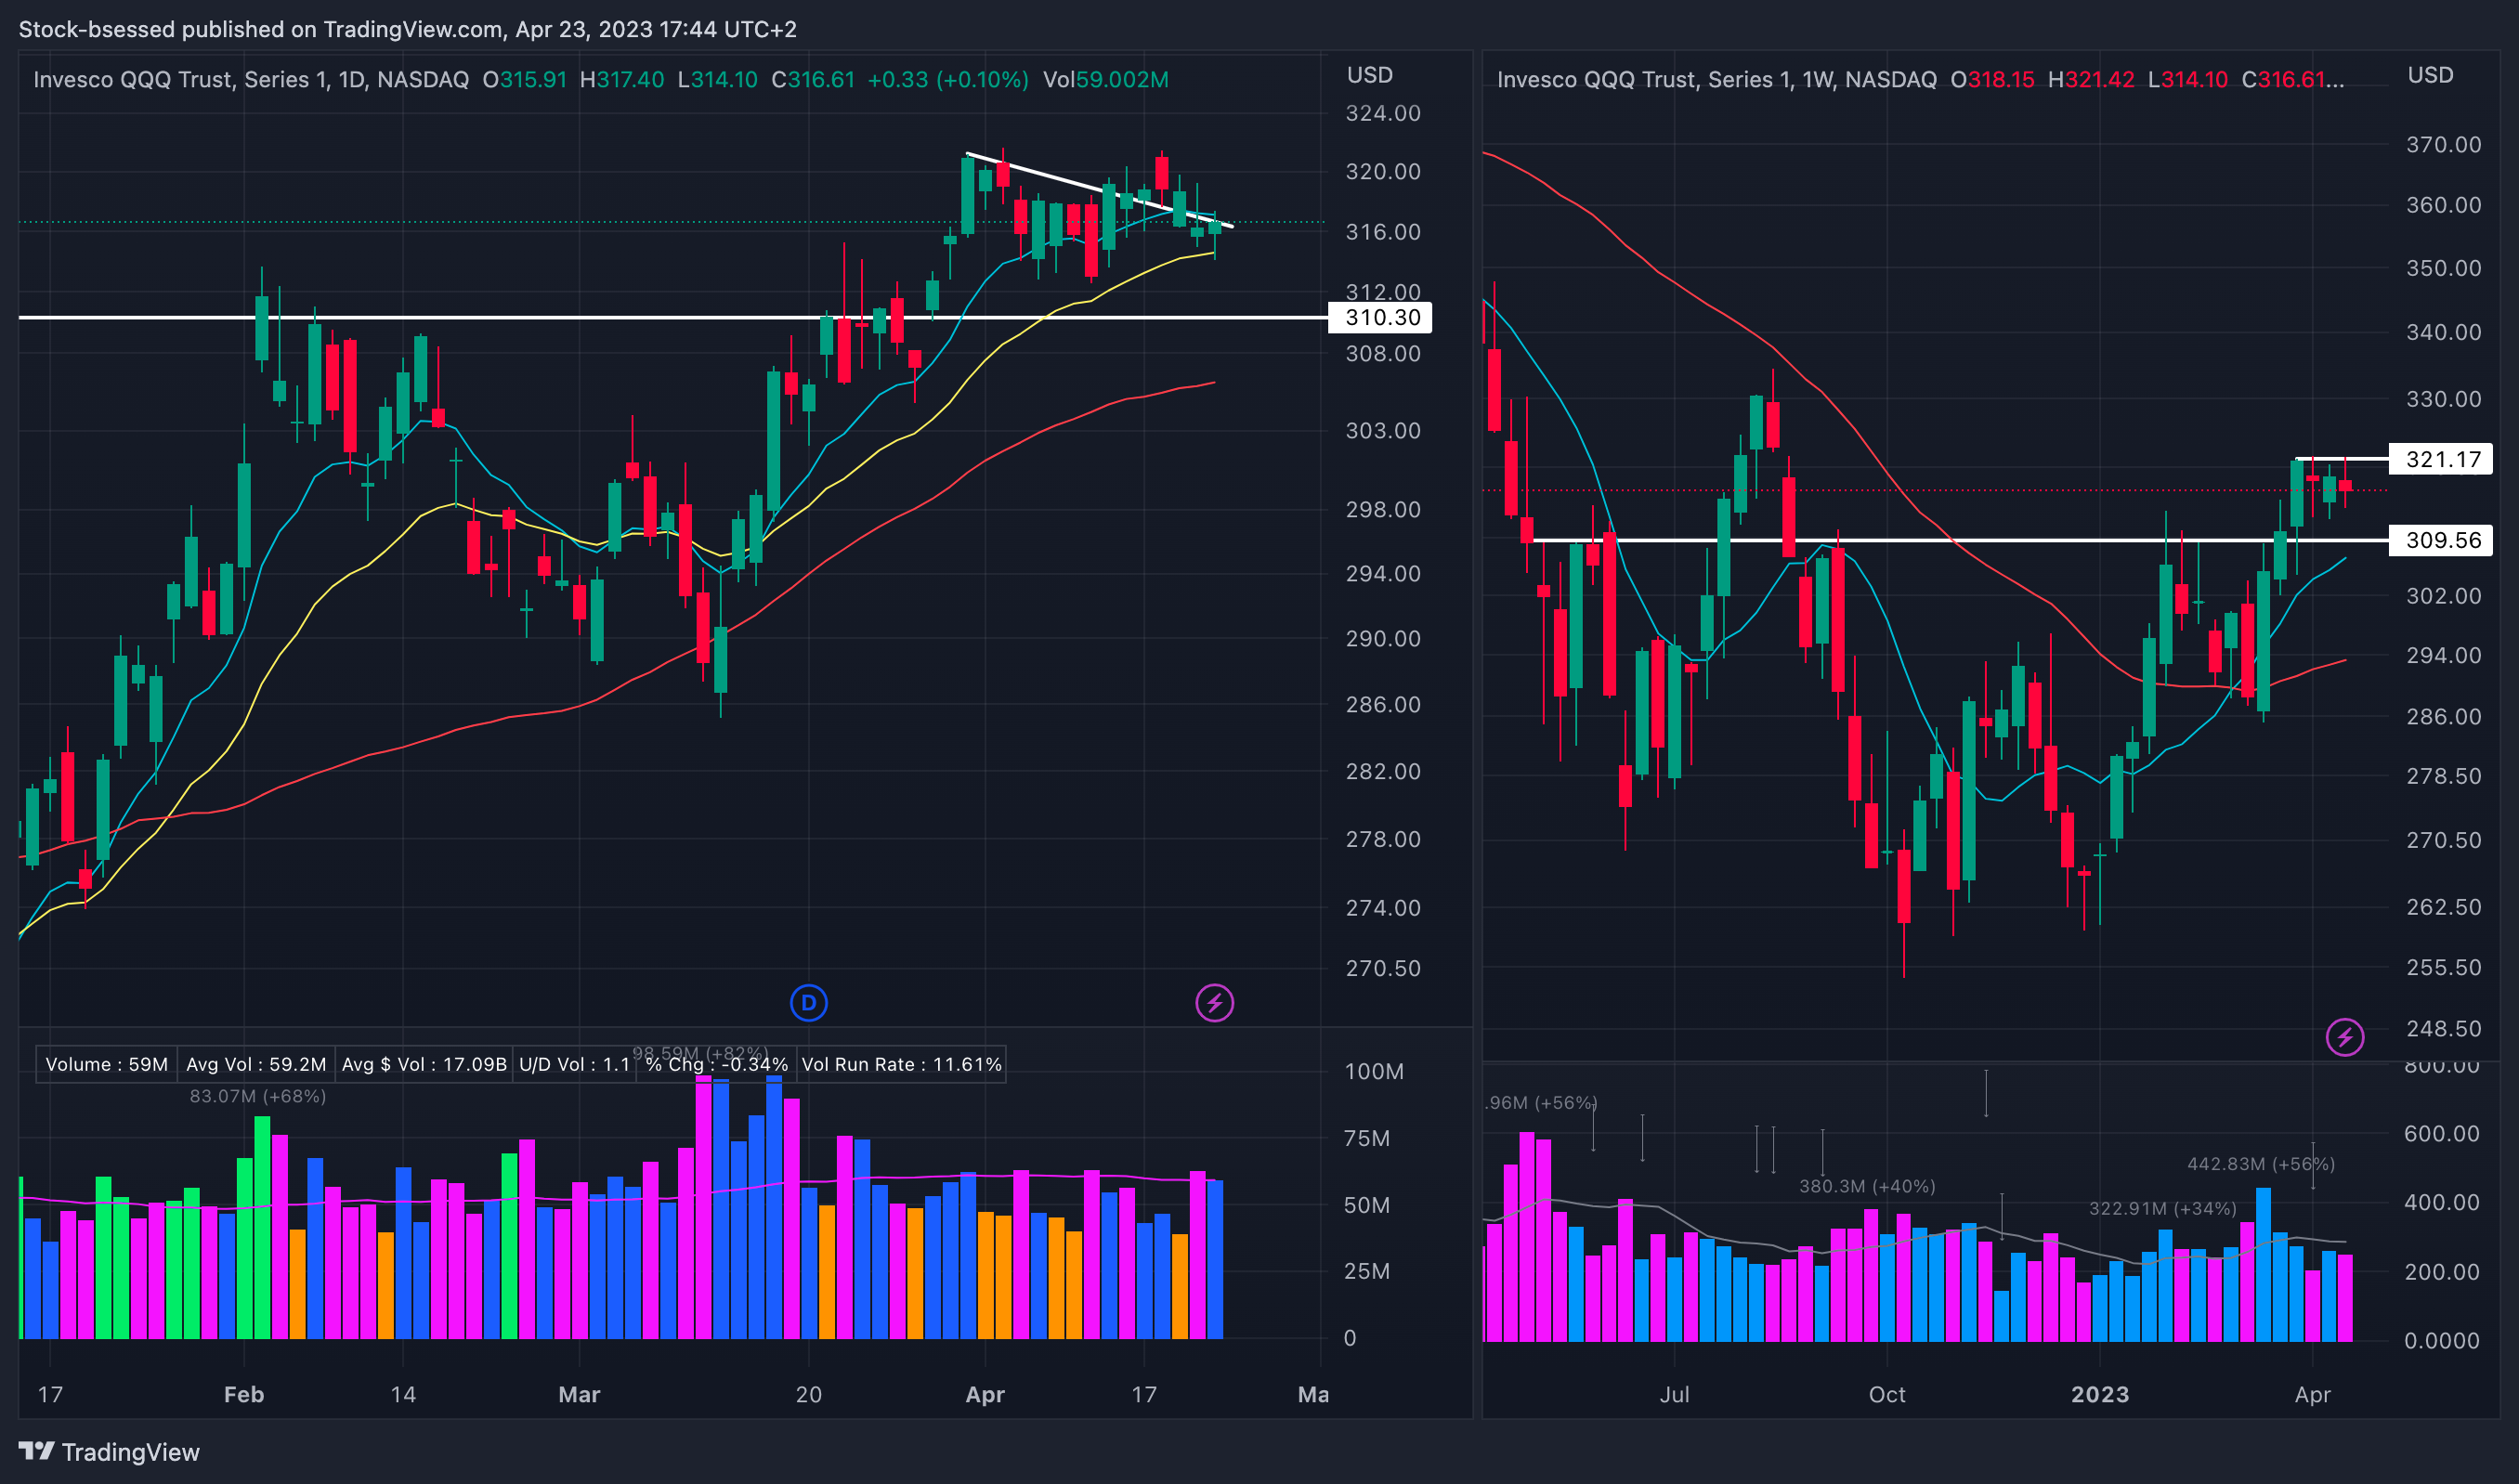
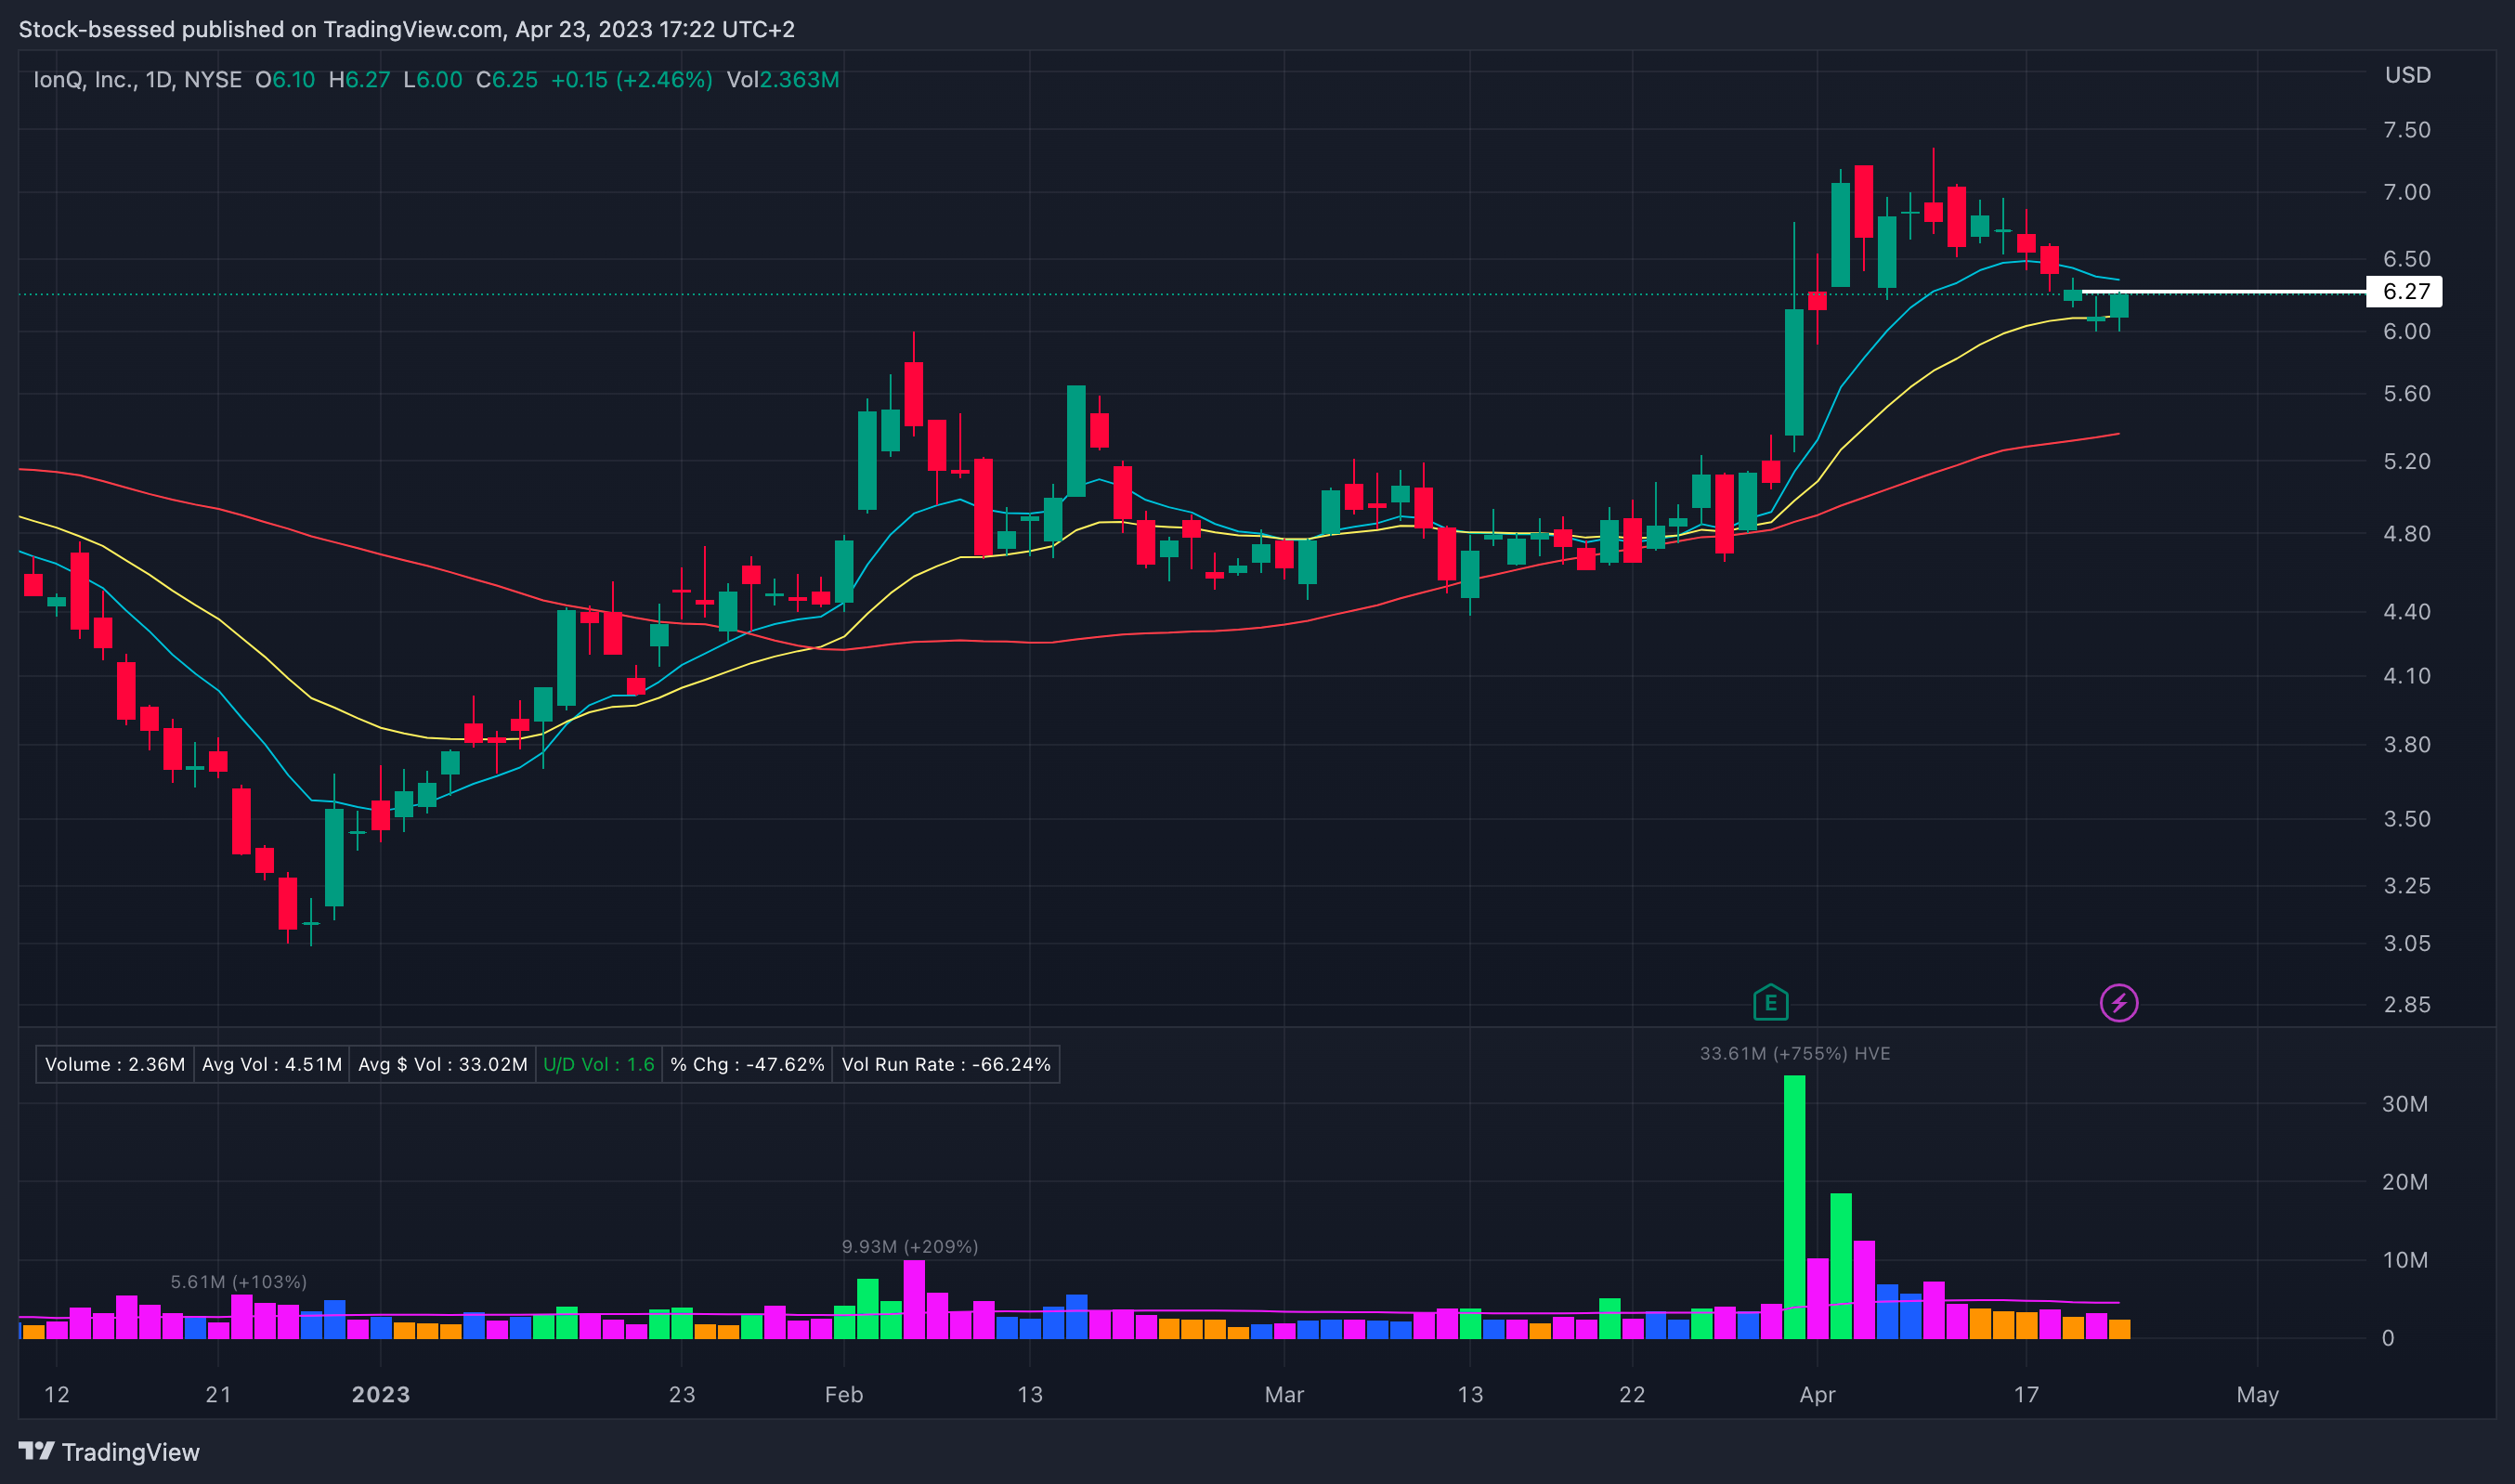
QQQ 0.00%↑ Flagging out very nicely here as buyers came in at the 20EMA - holds above key 309.50 area and now tightening up below the 321 level:
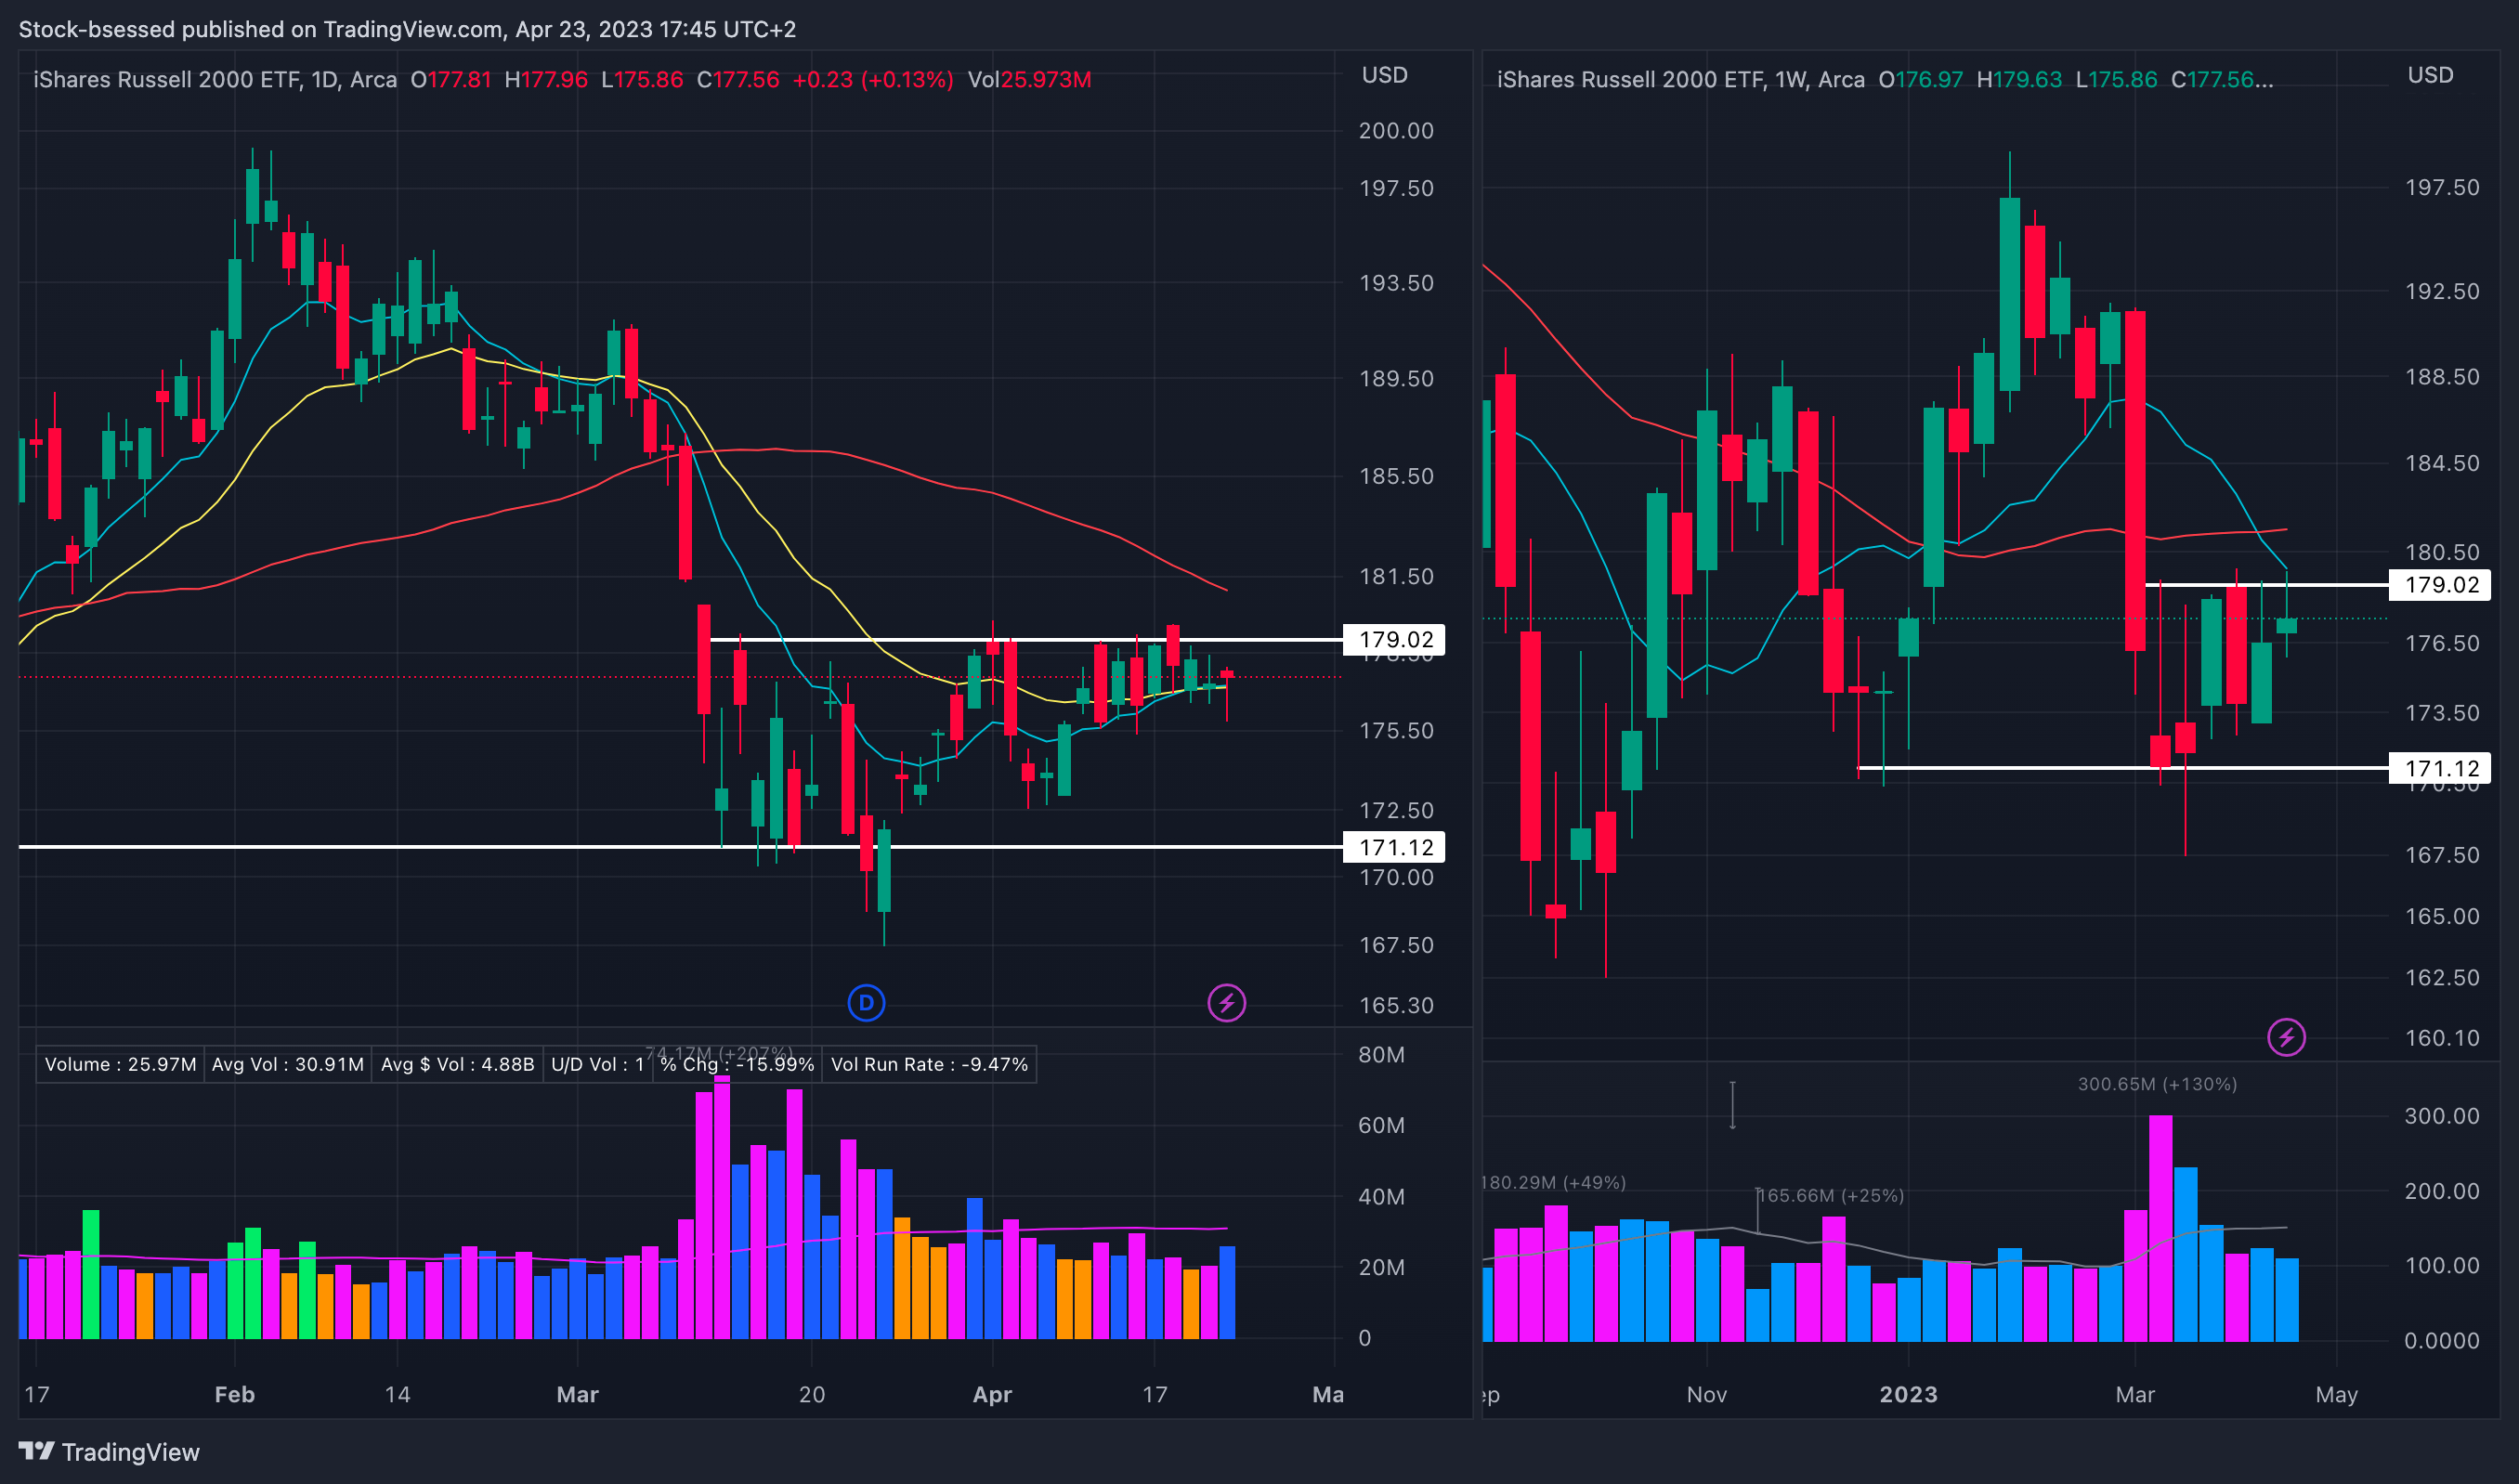
IWM 0.00%↑ Remains range-bound over the last few weeks and want to see it push above ~179 on strength:
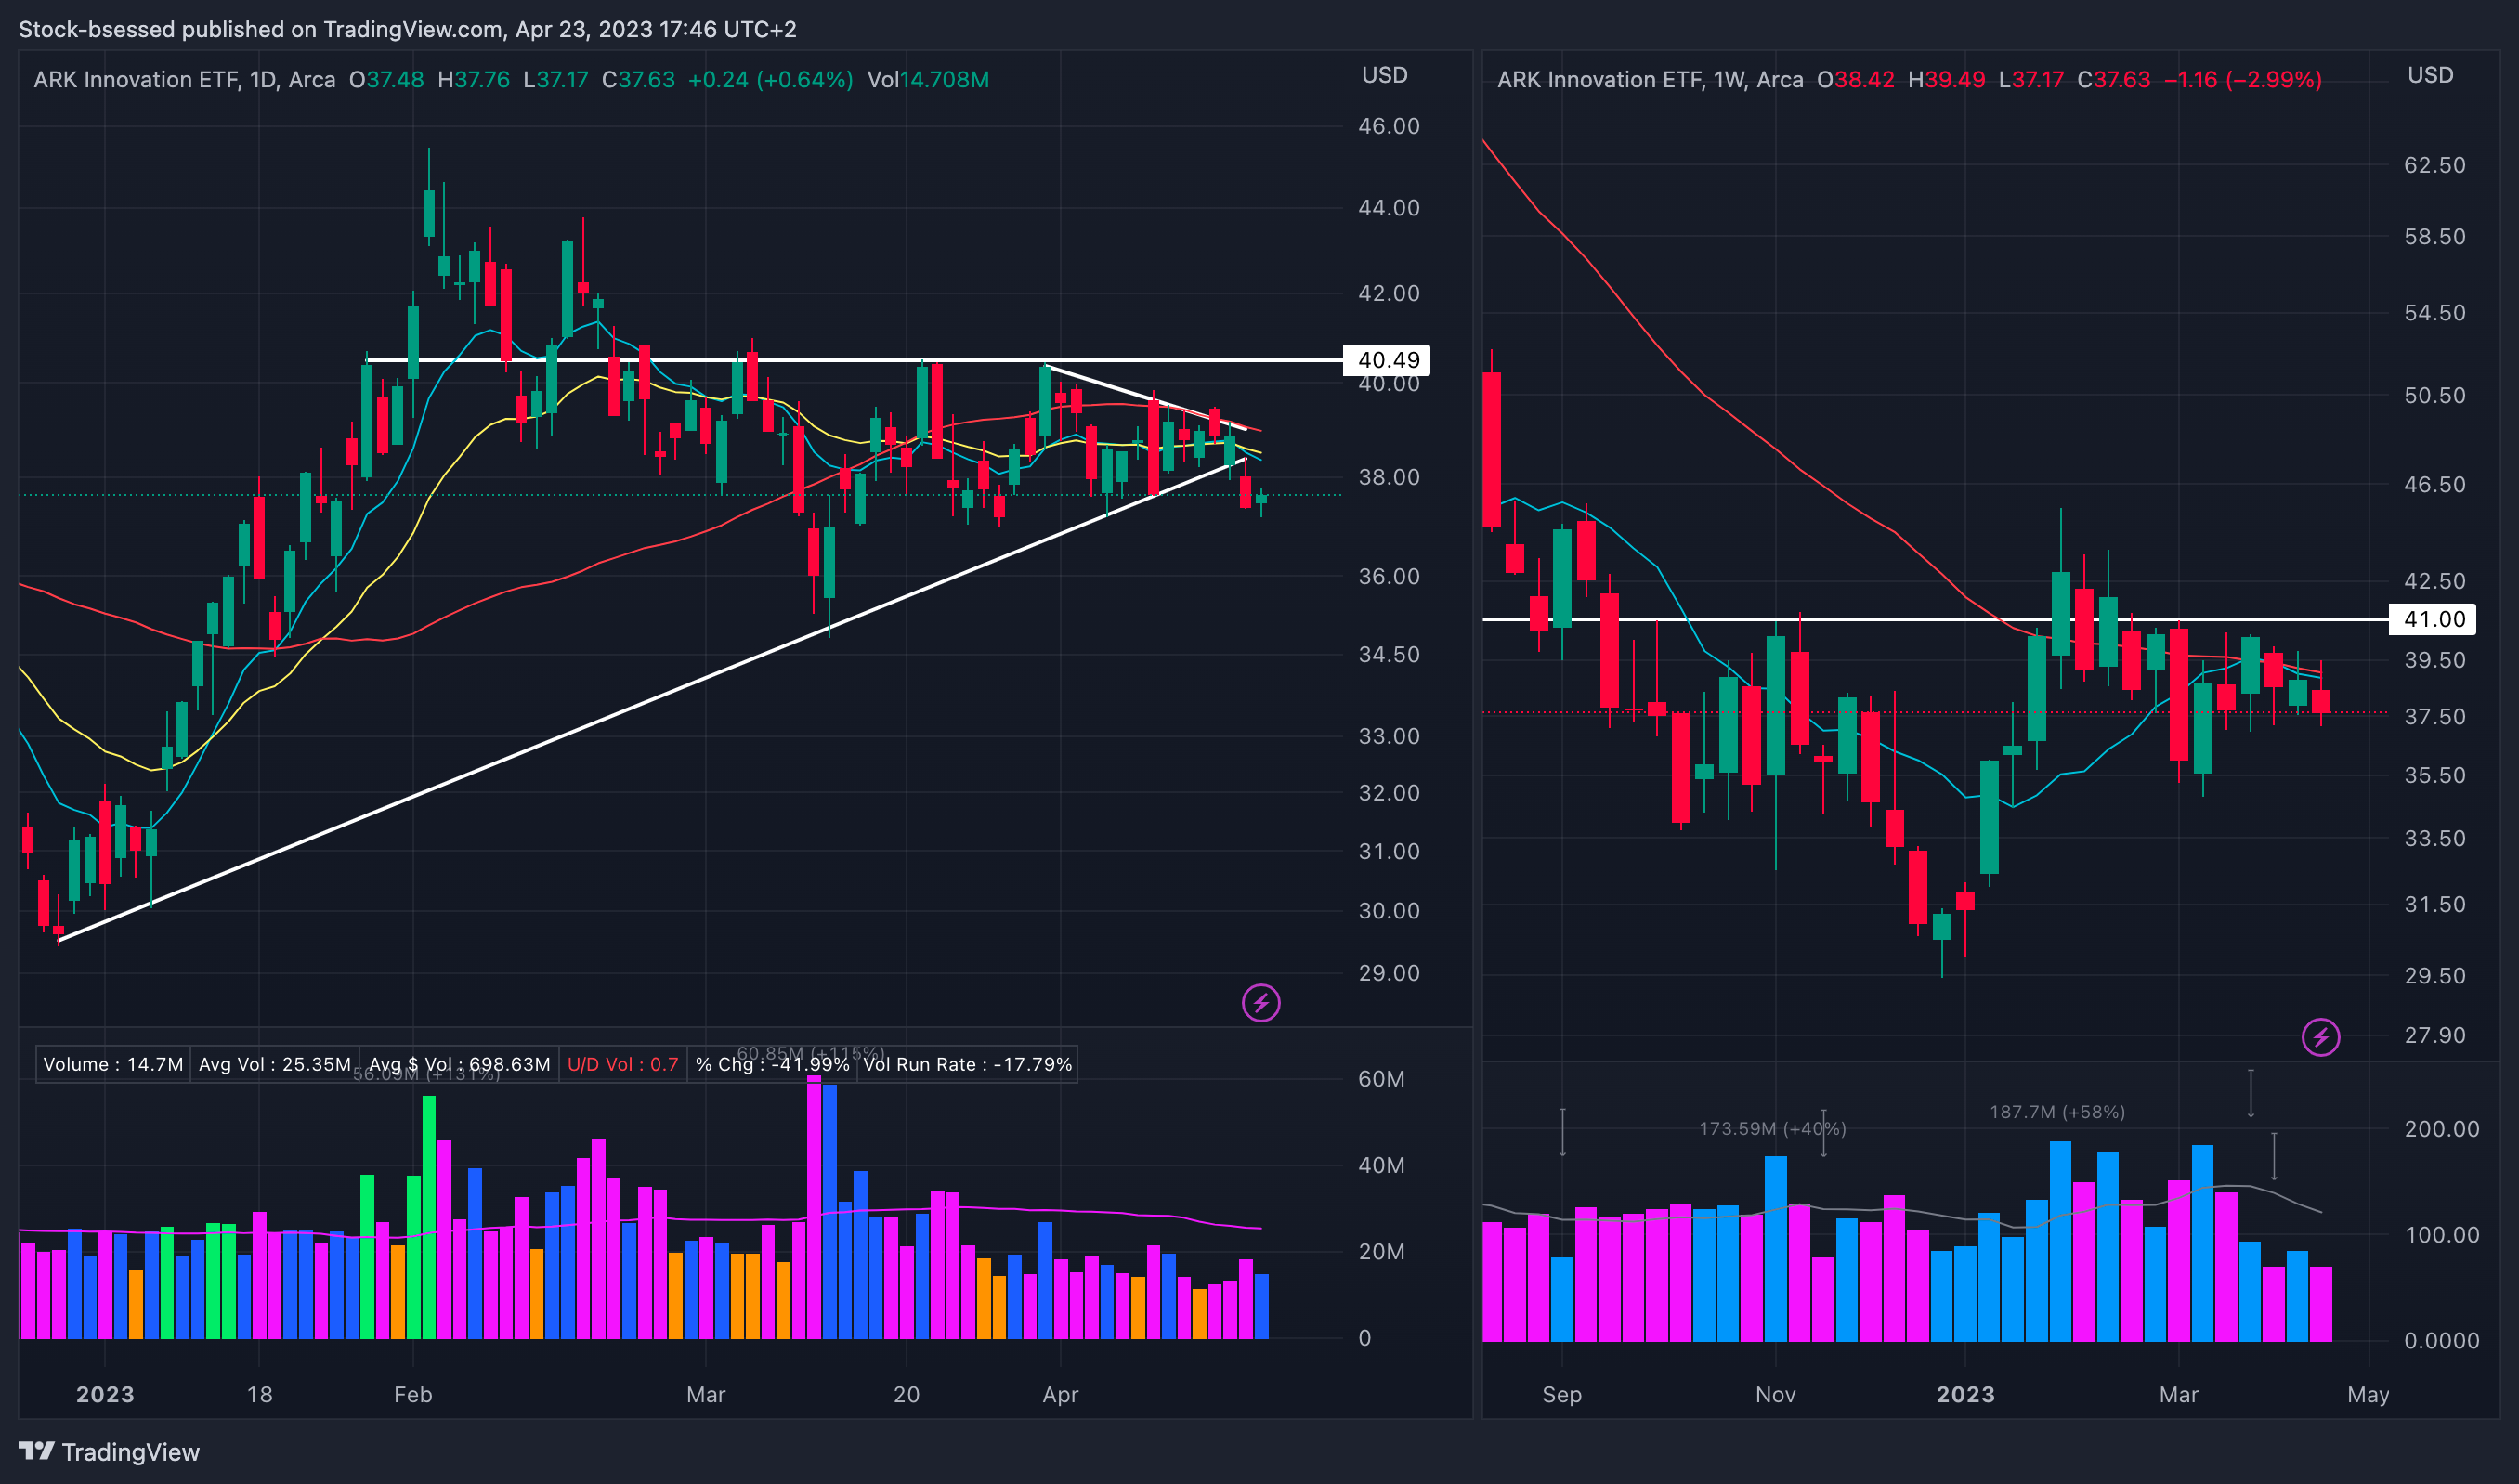
ARKK 0.00%↑ Loses this key trend line it has been respecting - components have been showing relative weakness and may indicate potential trouble ahead:
Leading Stocks Analysis
Checkout some detailed chart mark-ups I’ve done here:
Daily:
I am linking the leaders watchlist in tradingview for your convenience, here
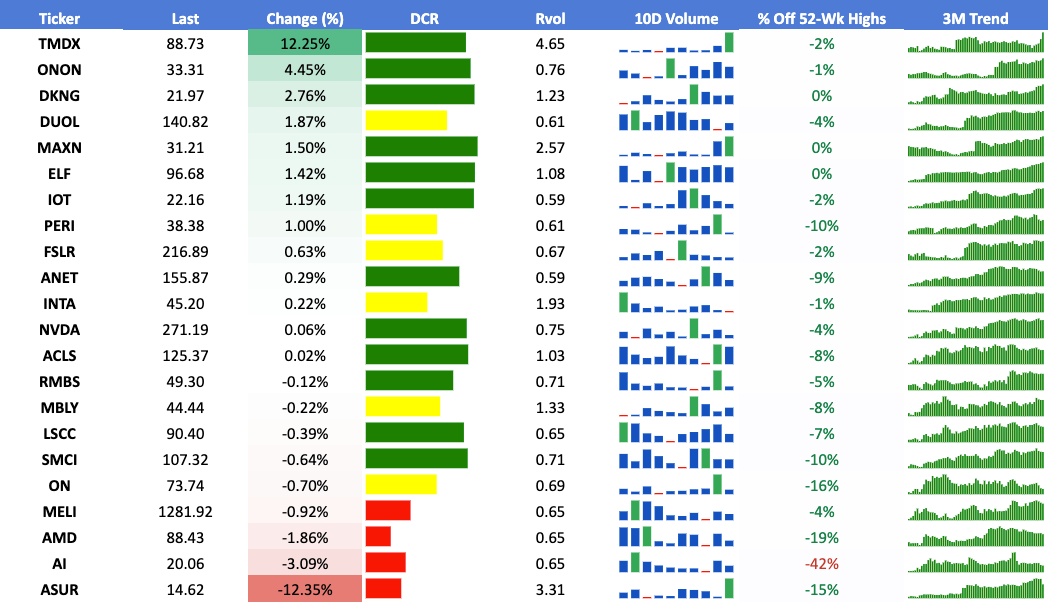
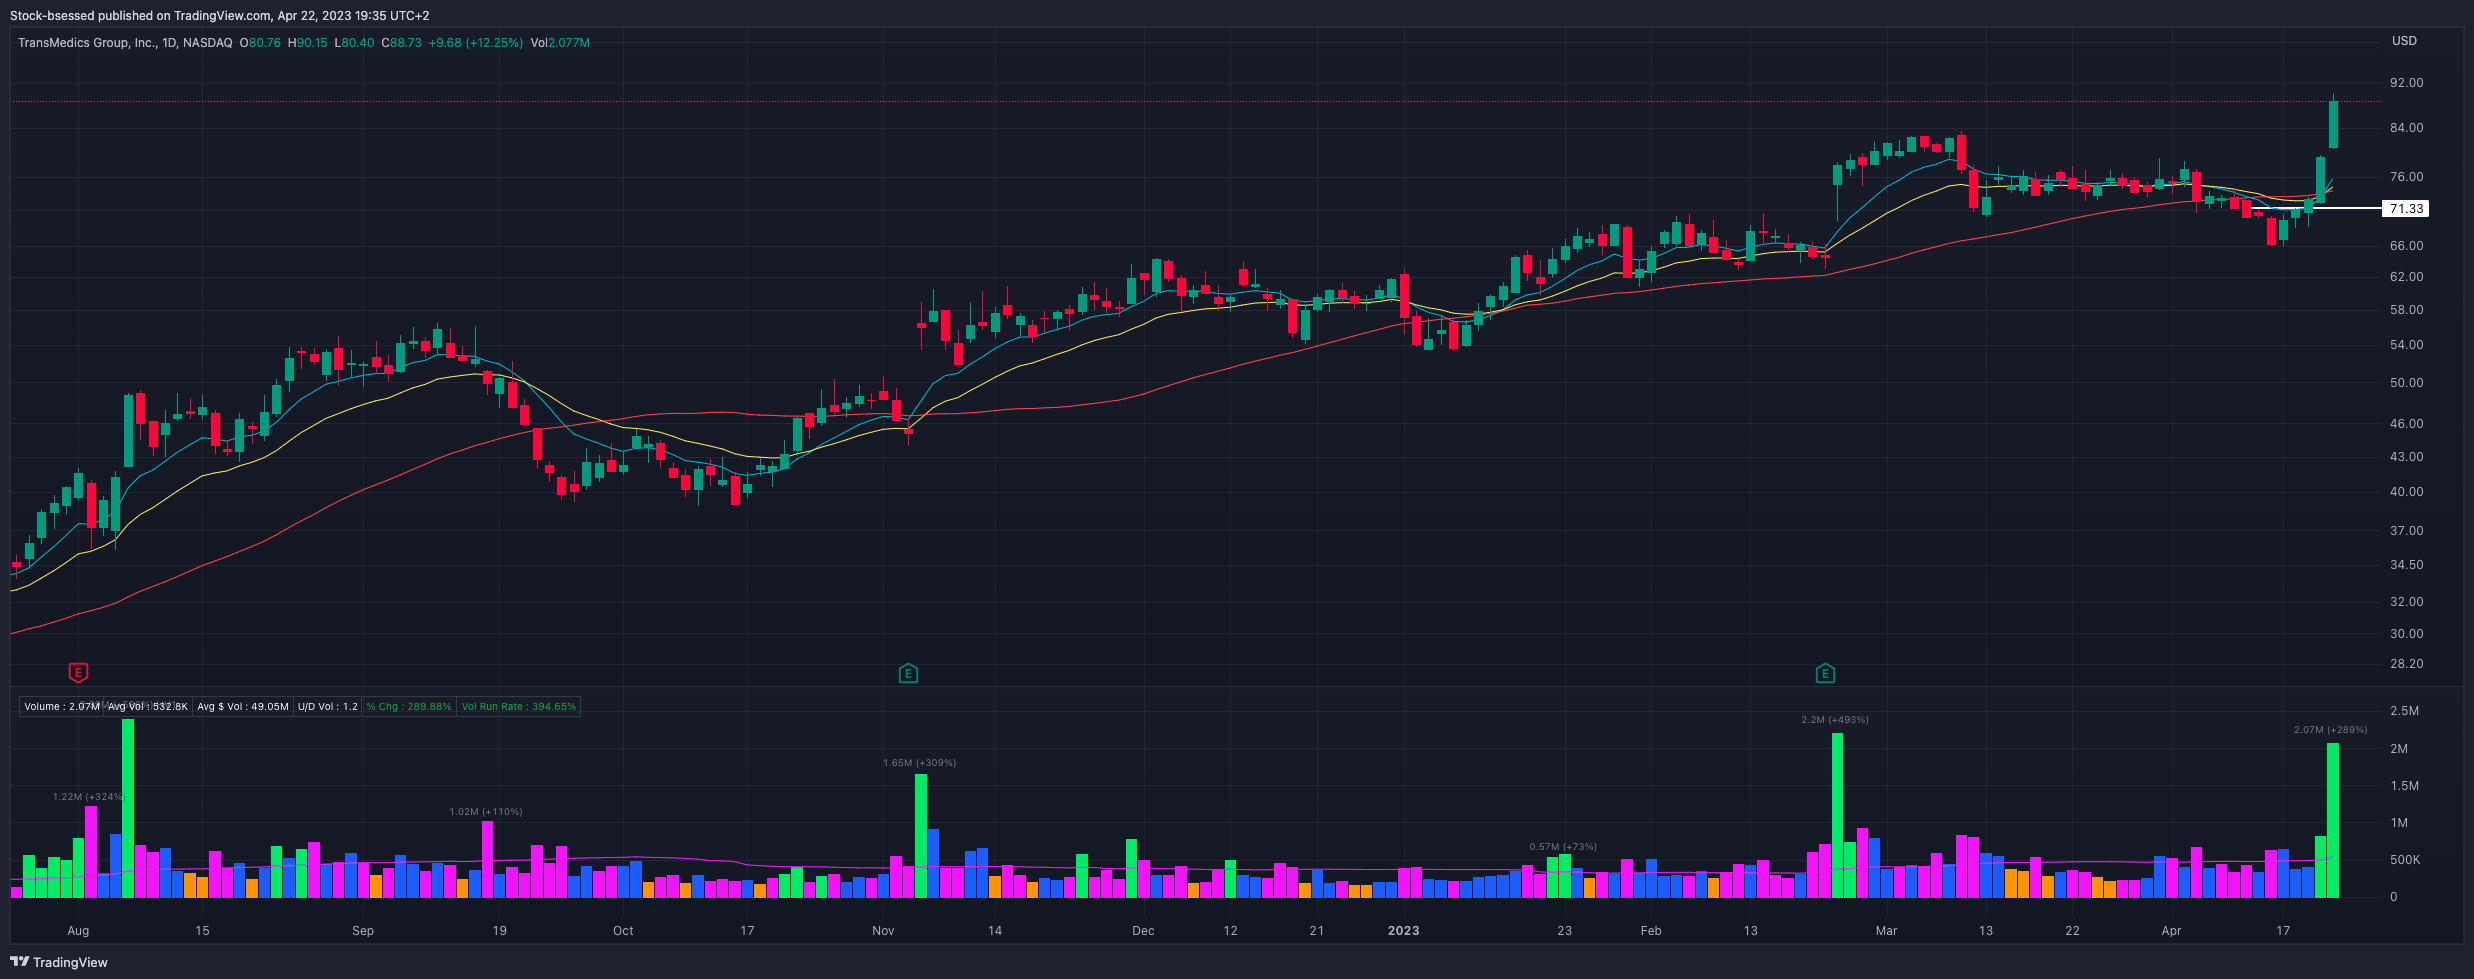
TMDX 0.00%↑ Follows through on this push above the short-term pivot around 71.33 and quickly makes its way to the top of its base and new all time highs. Great volume pickup the last 2 sessions and encouraging to see such strong closes:
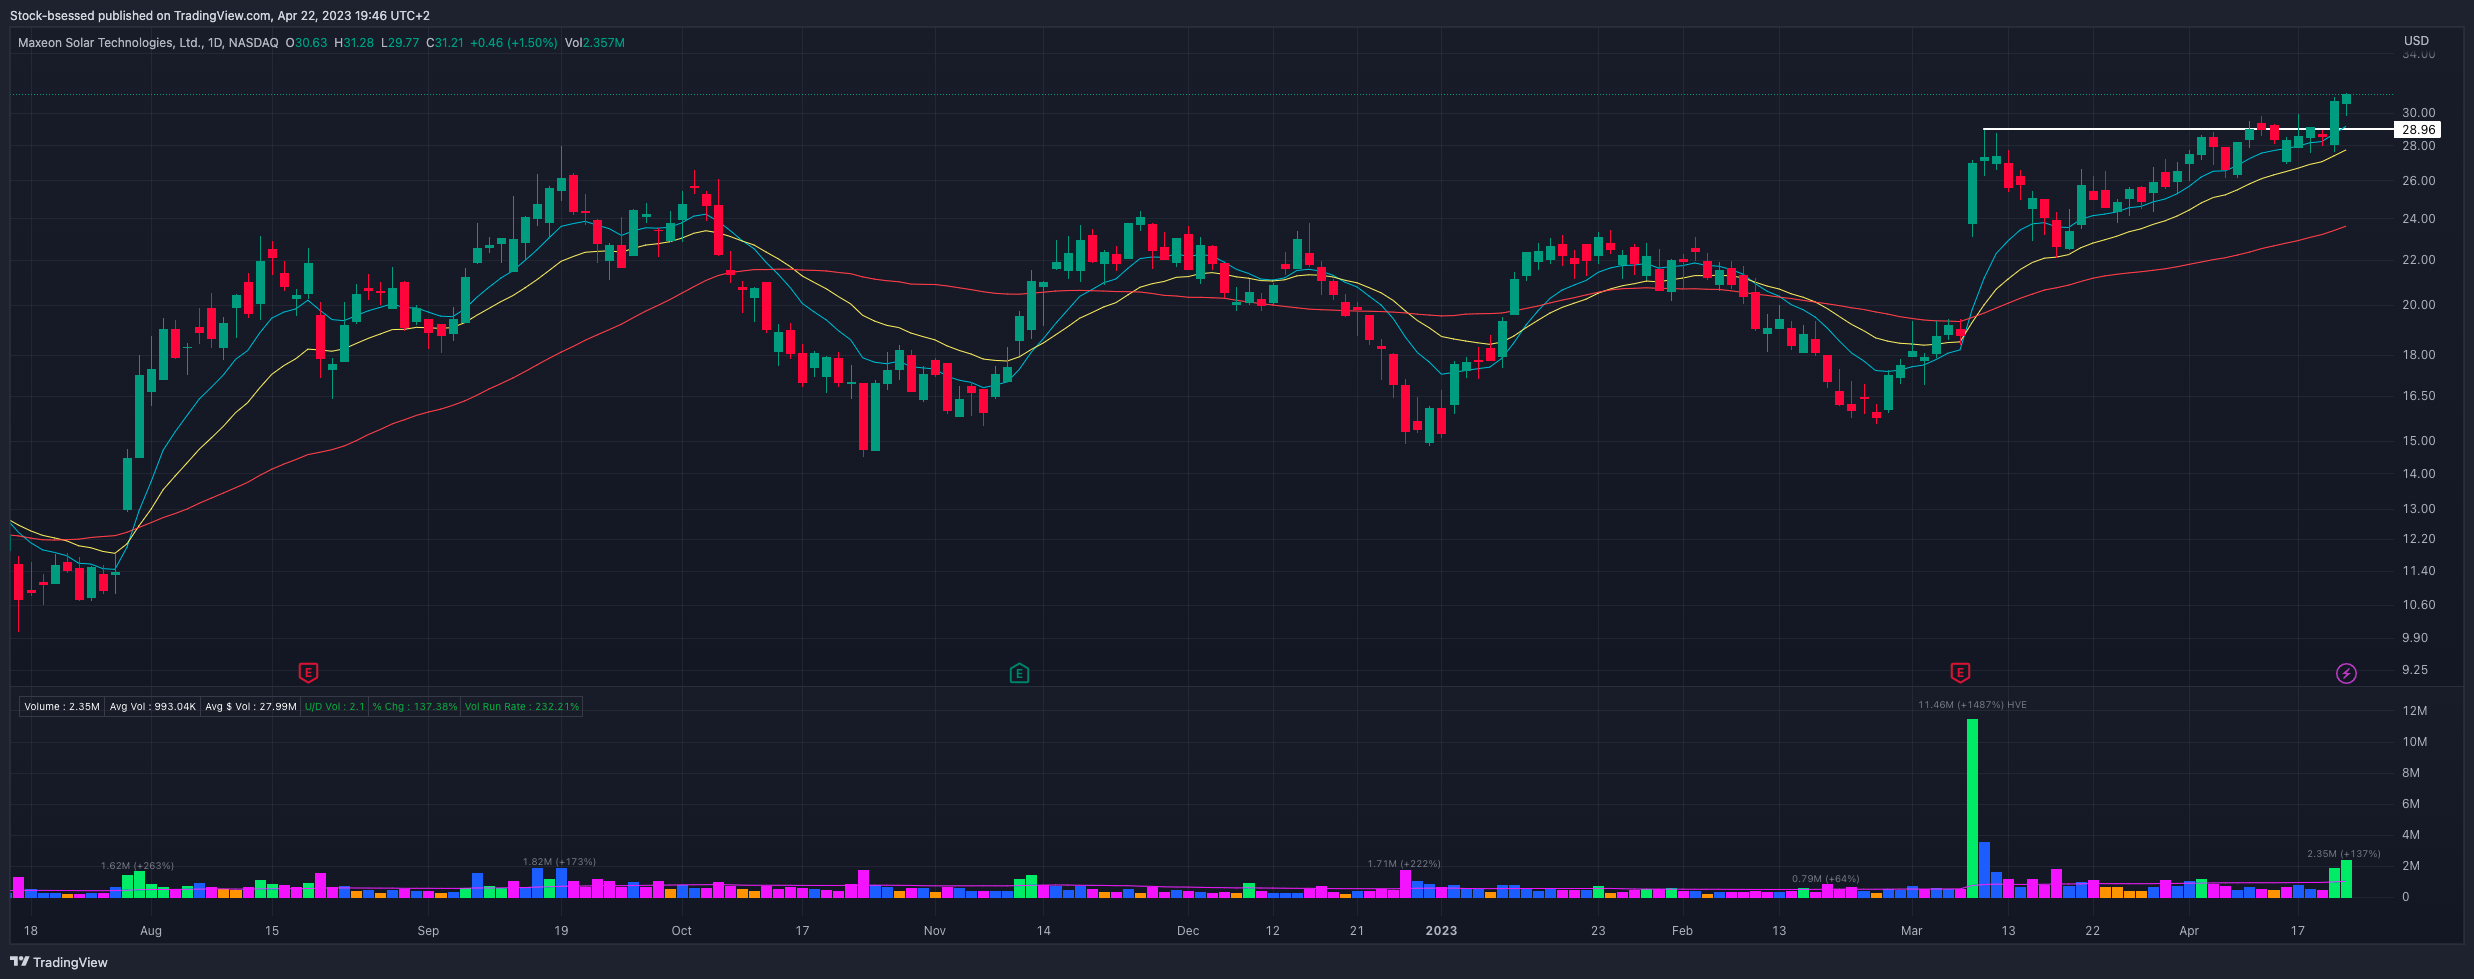
MAXN 0.00%↑ Good to see some follow through on volume with intra-day weakness getting bought up and closing strong on the session:
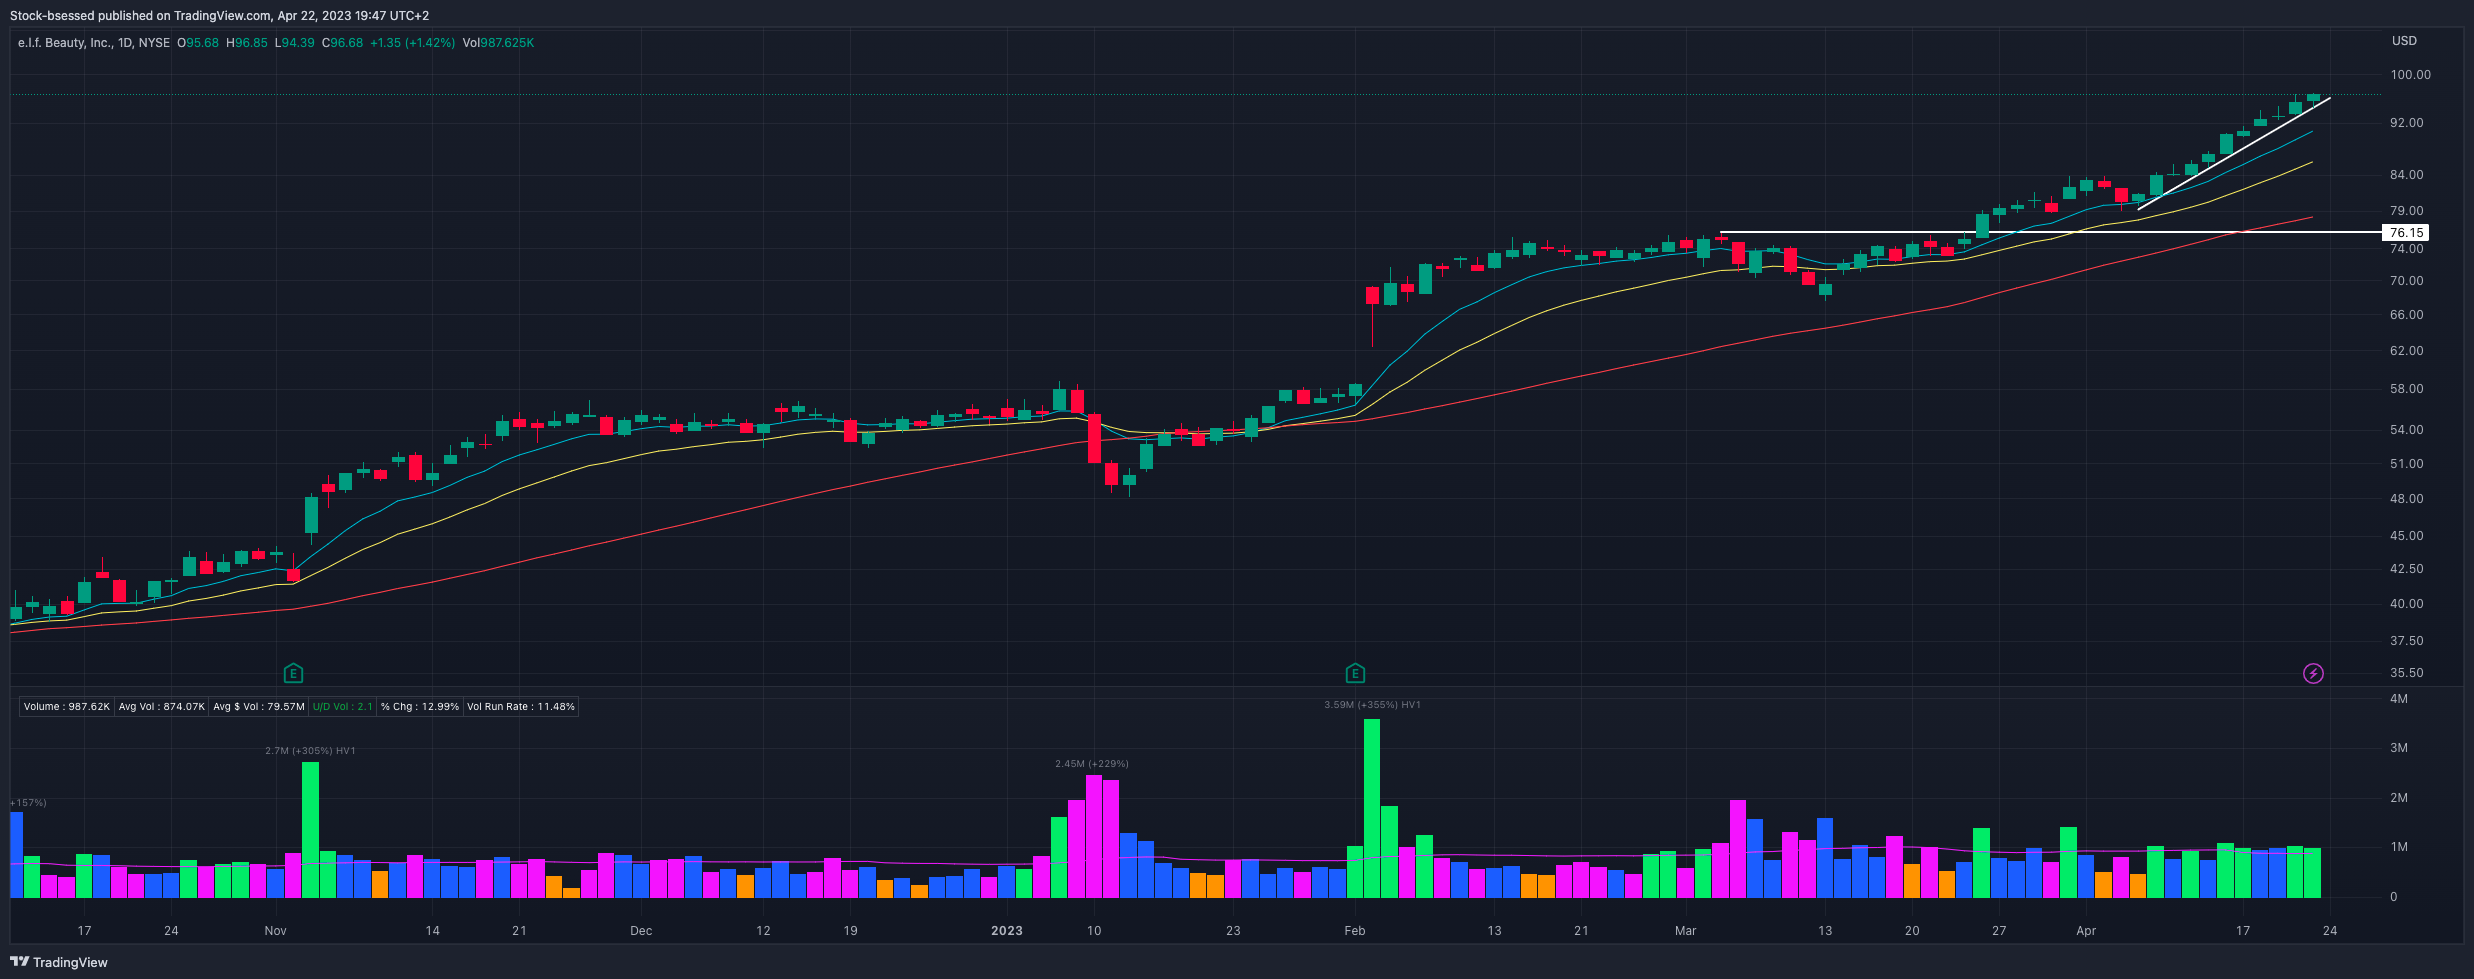
ELF 0.00%↑ Getting extended now with 11 up sessions in a row - watching this trend line for a potential change in trend but am not ruling out an orderly consolidation to allow key moving averages to catch up to price:
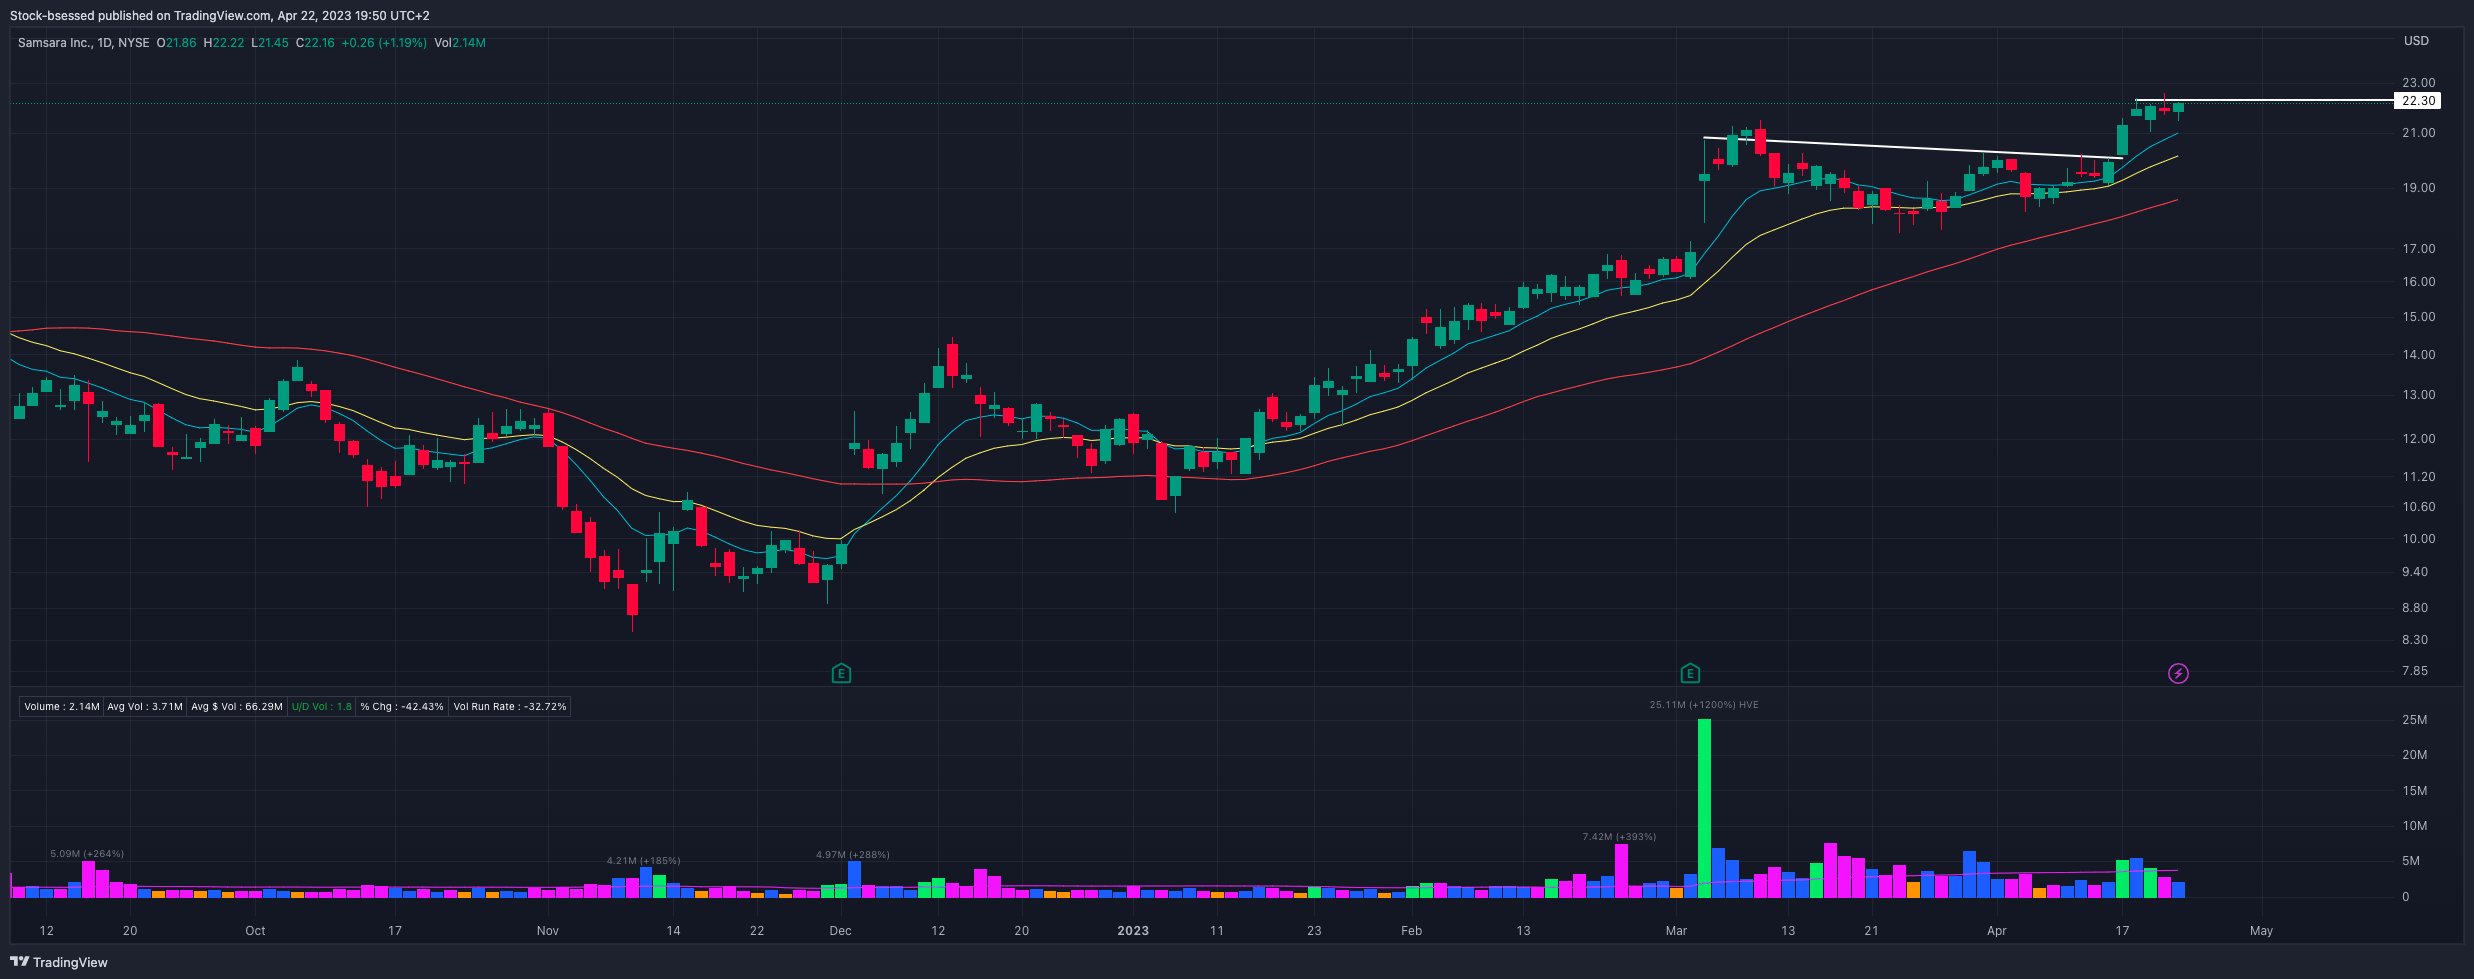
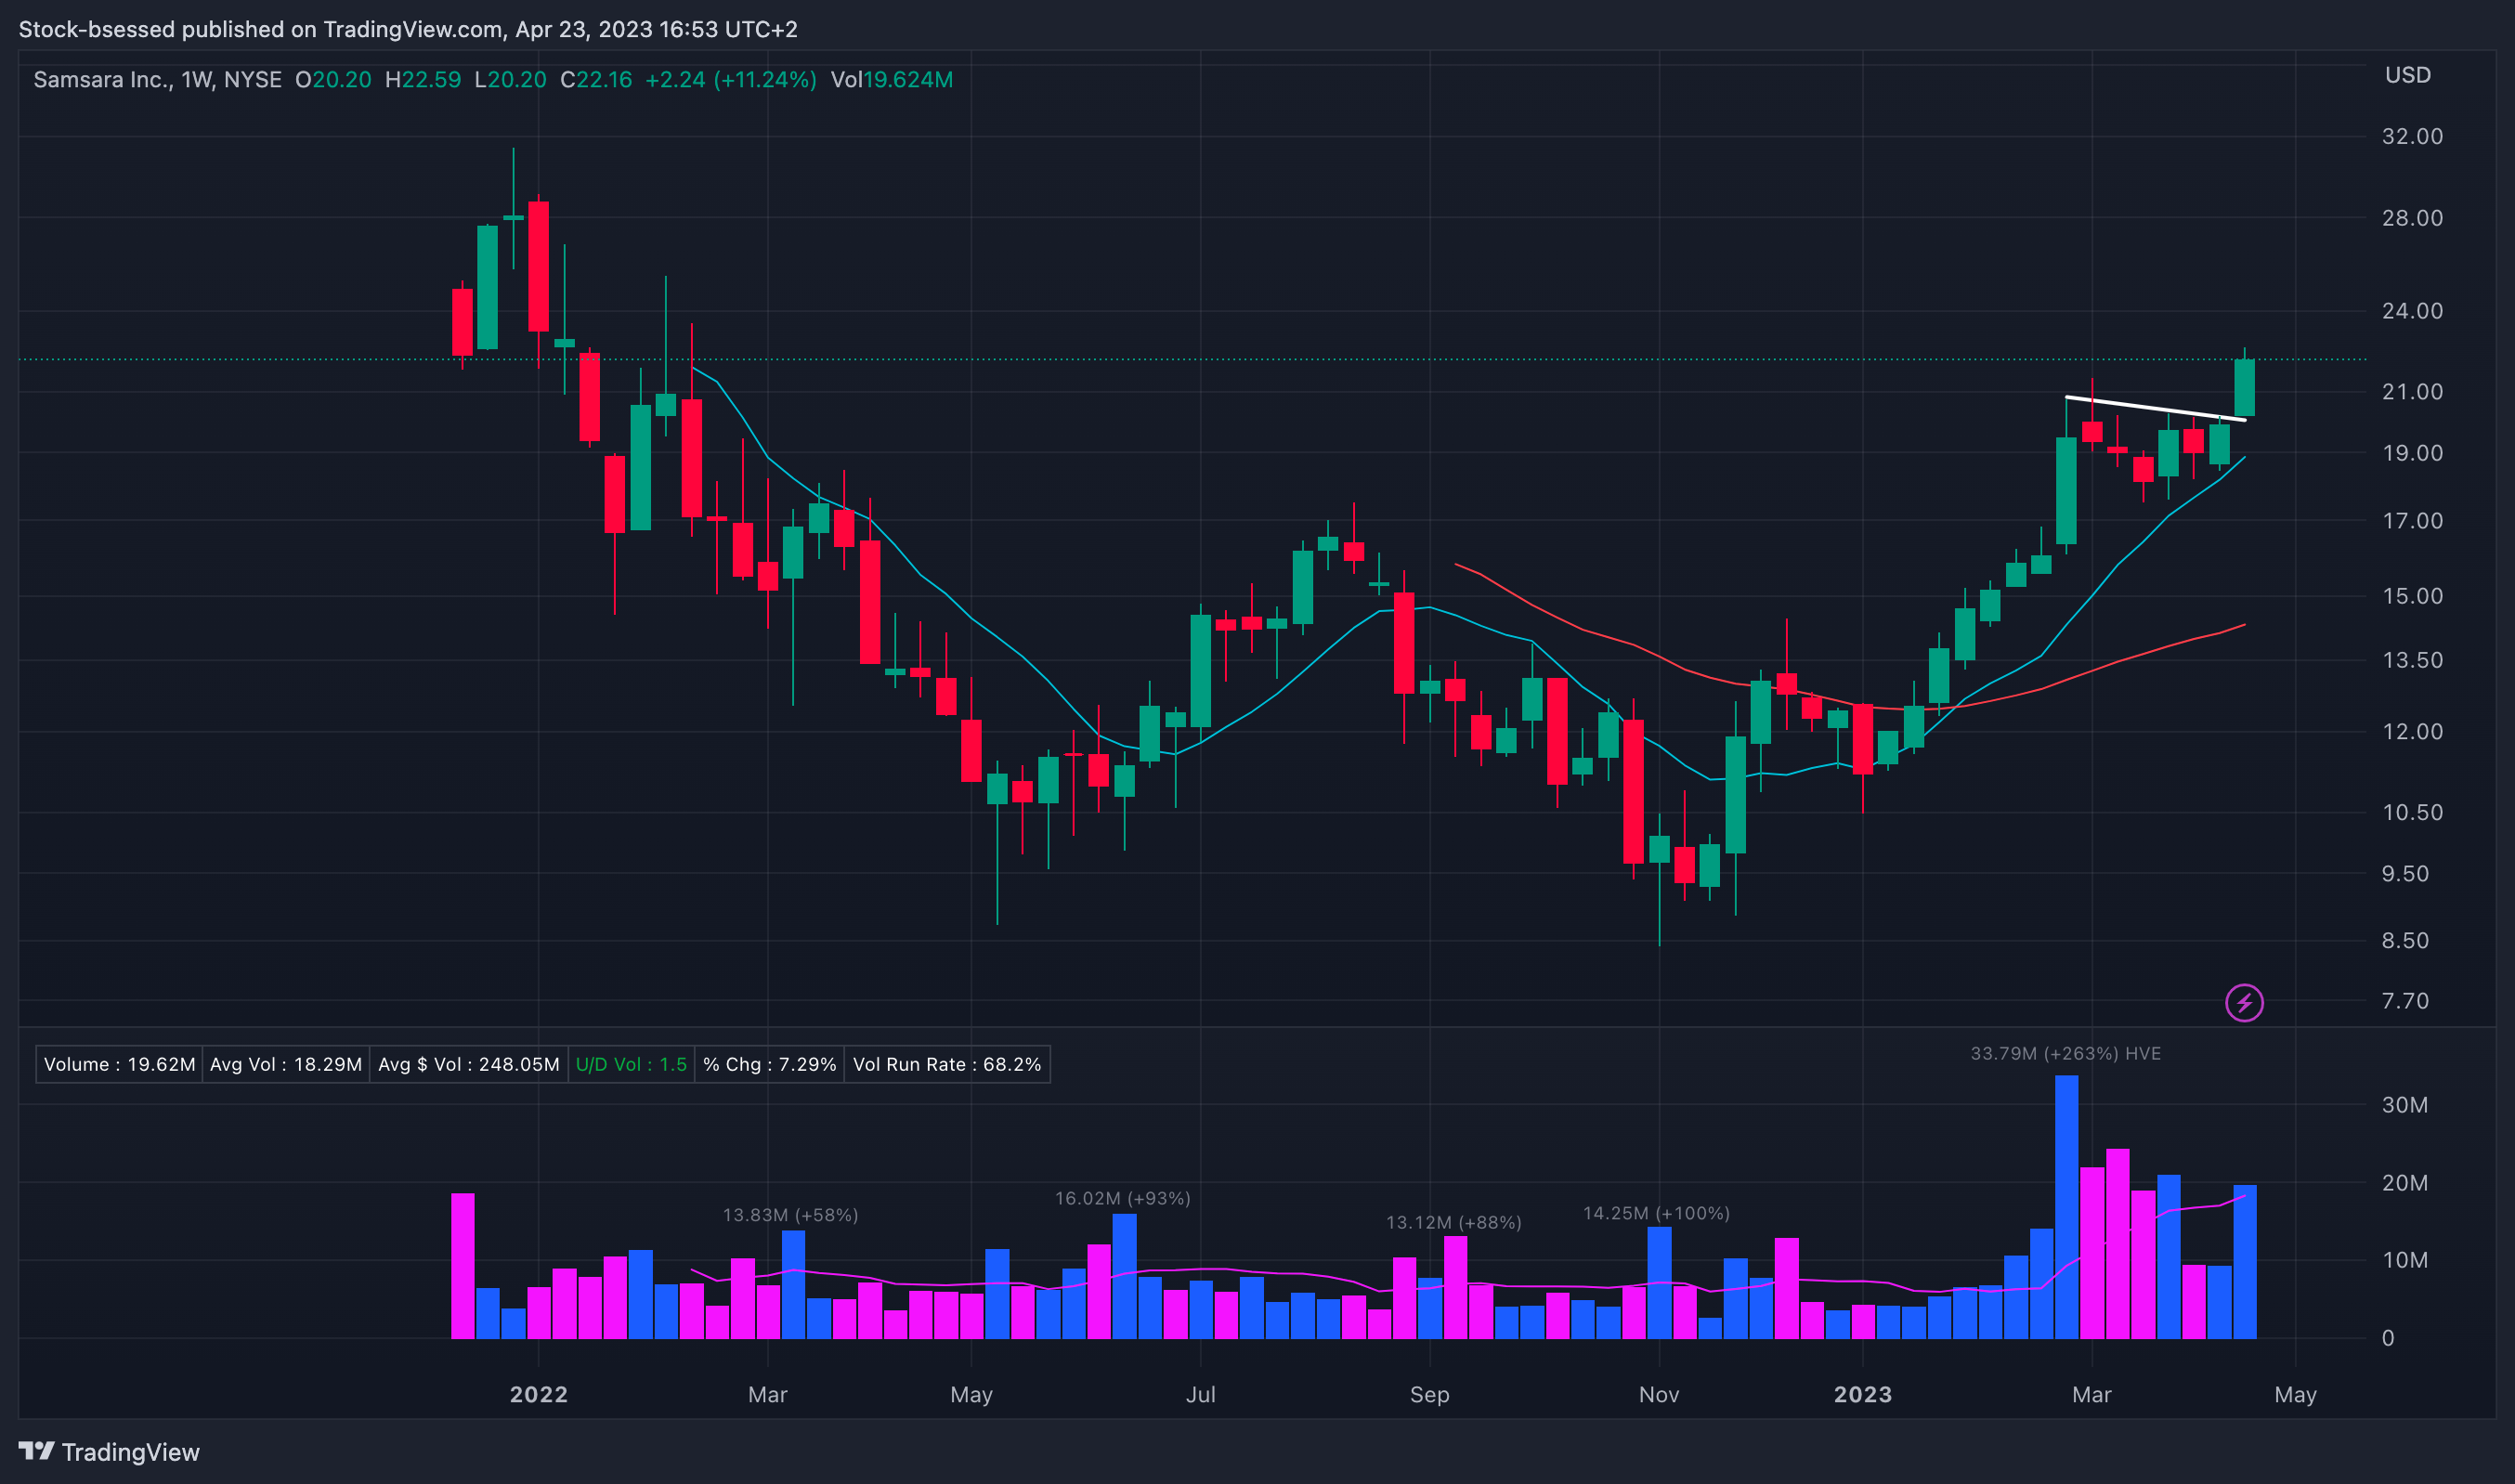
IOT 0.00%↑ This is the kind of action we want to see a proliferation of - immediate follow through after a strong breakout of this descending trend line and another strong close last session as weakness gets bought up. Now potentially setting up another spot under this 22.30 area:
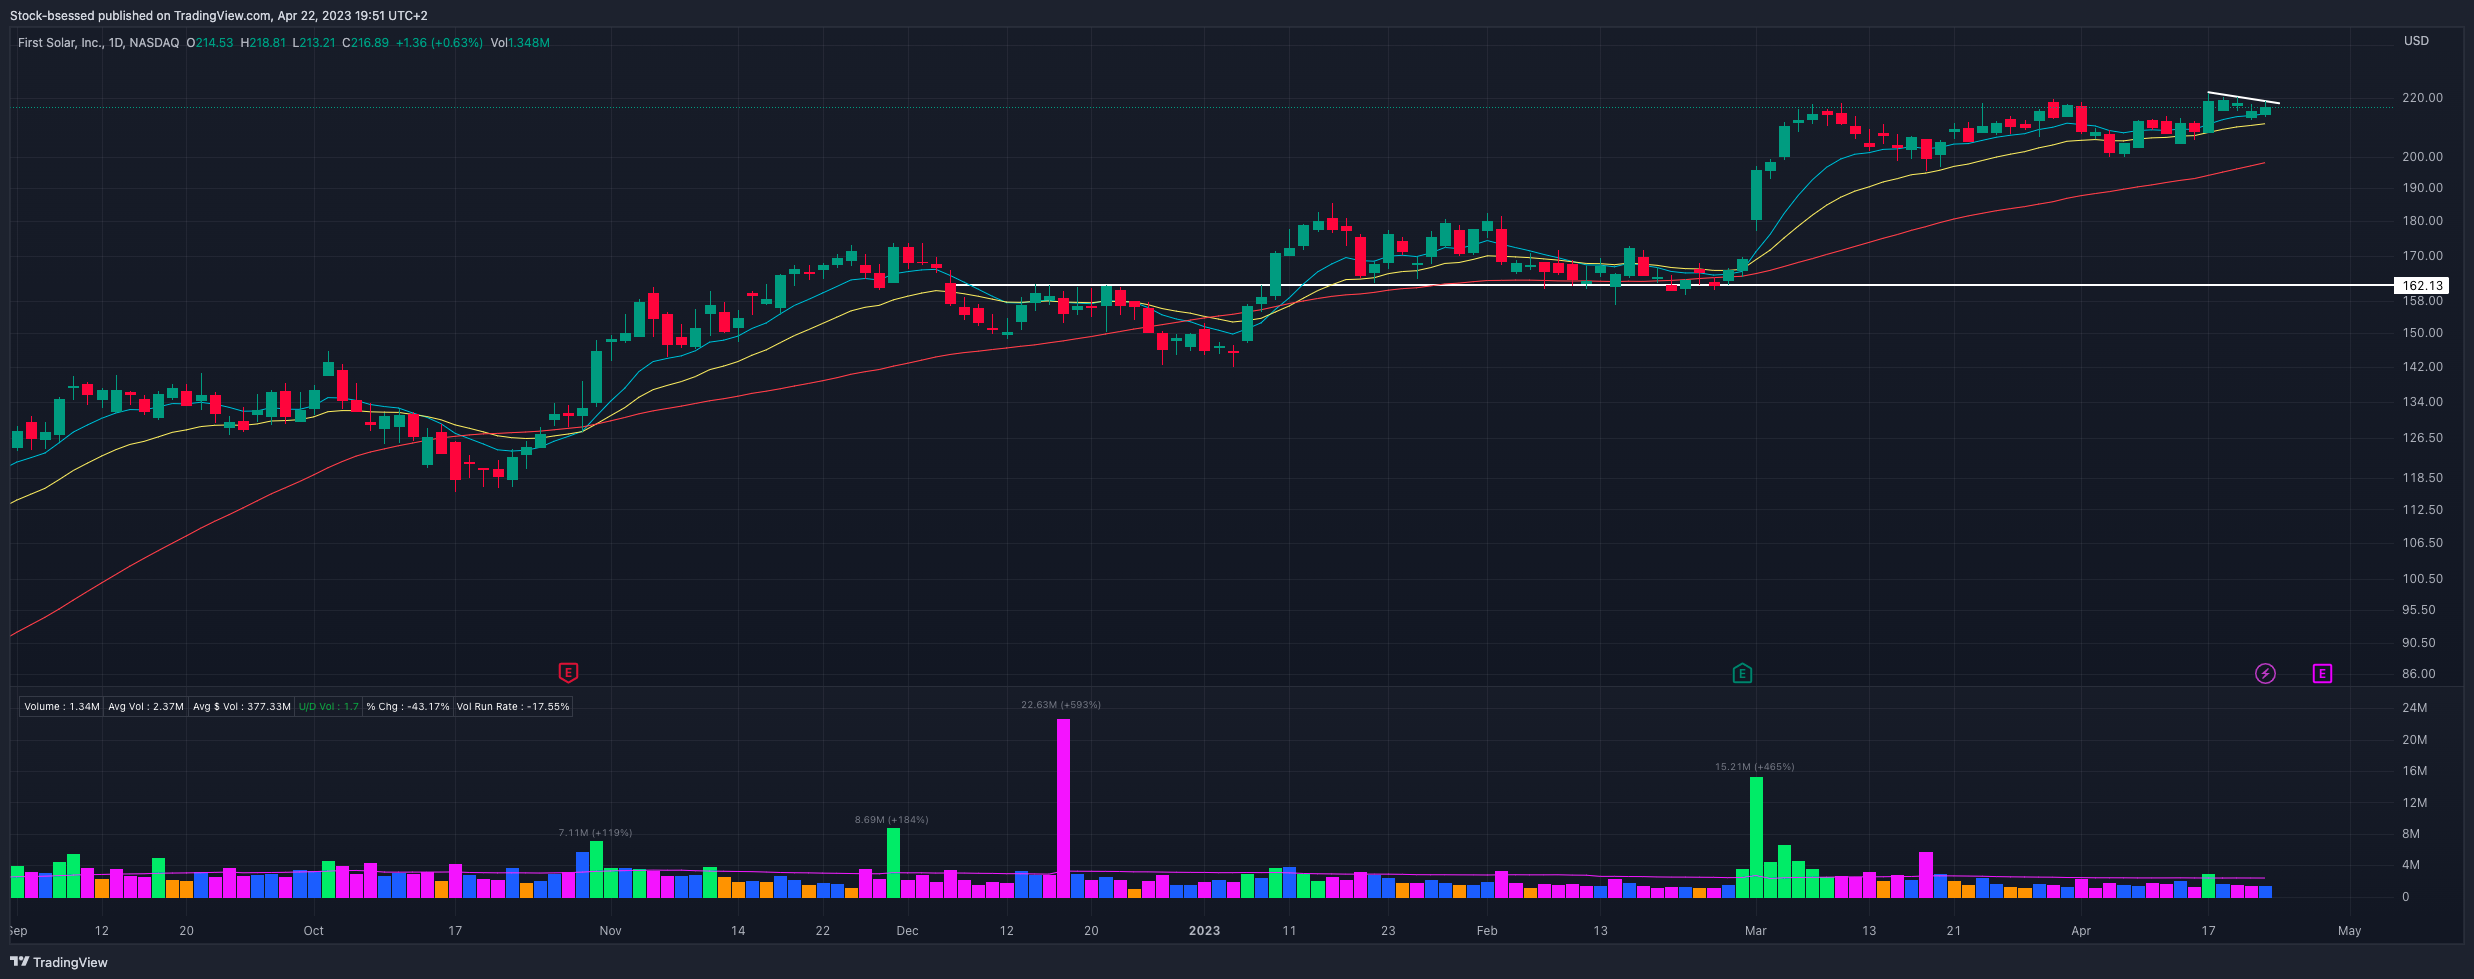
FSLR 0.00%↑ Watching this one closely into next week as I like how it is consolidating at the highs with buyers showing up at KMAs to close strong once more while resting under this descending trend line:
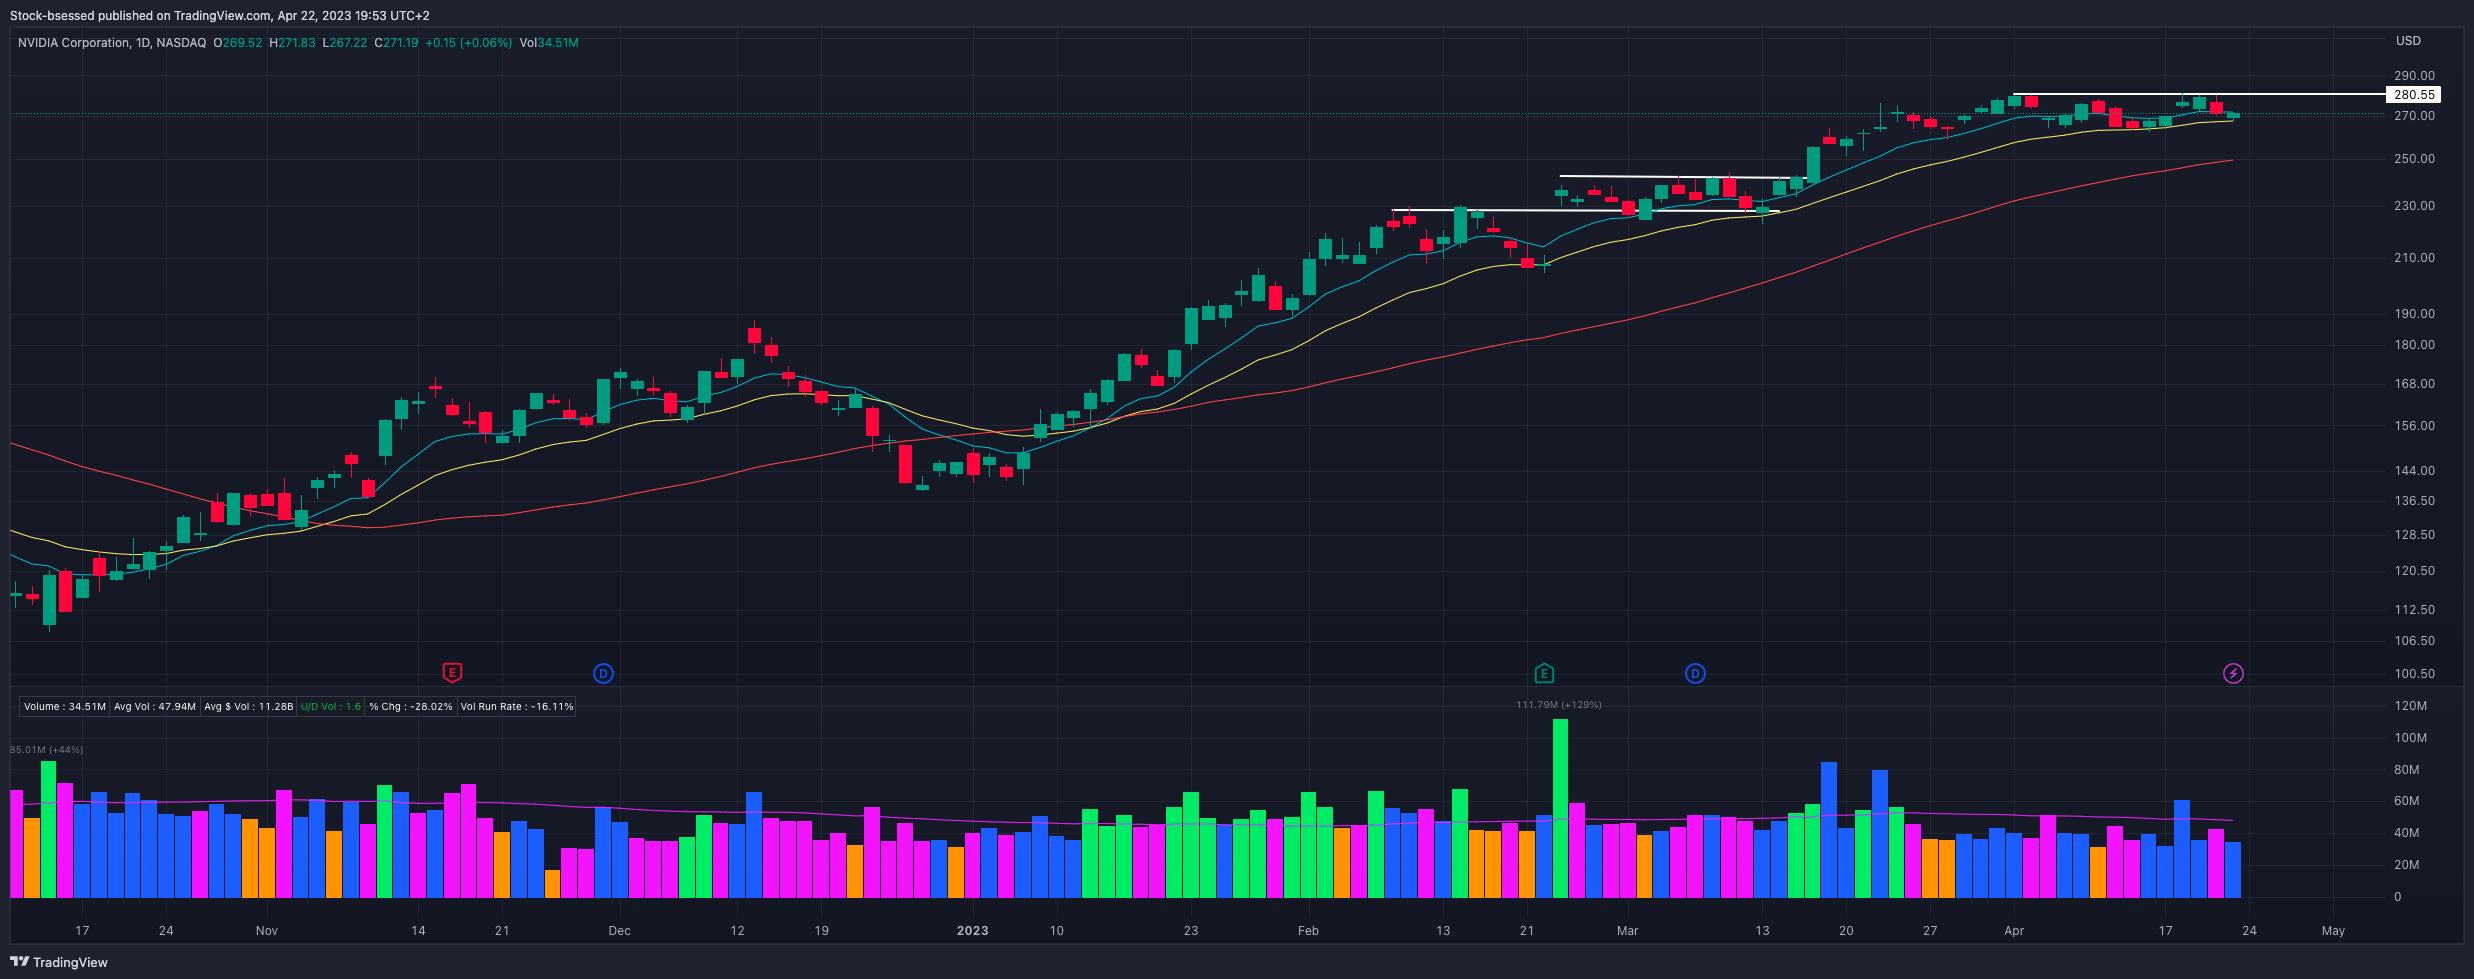
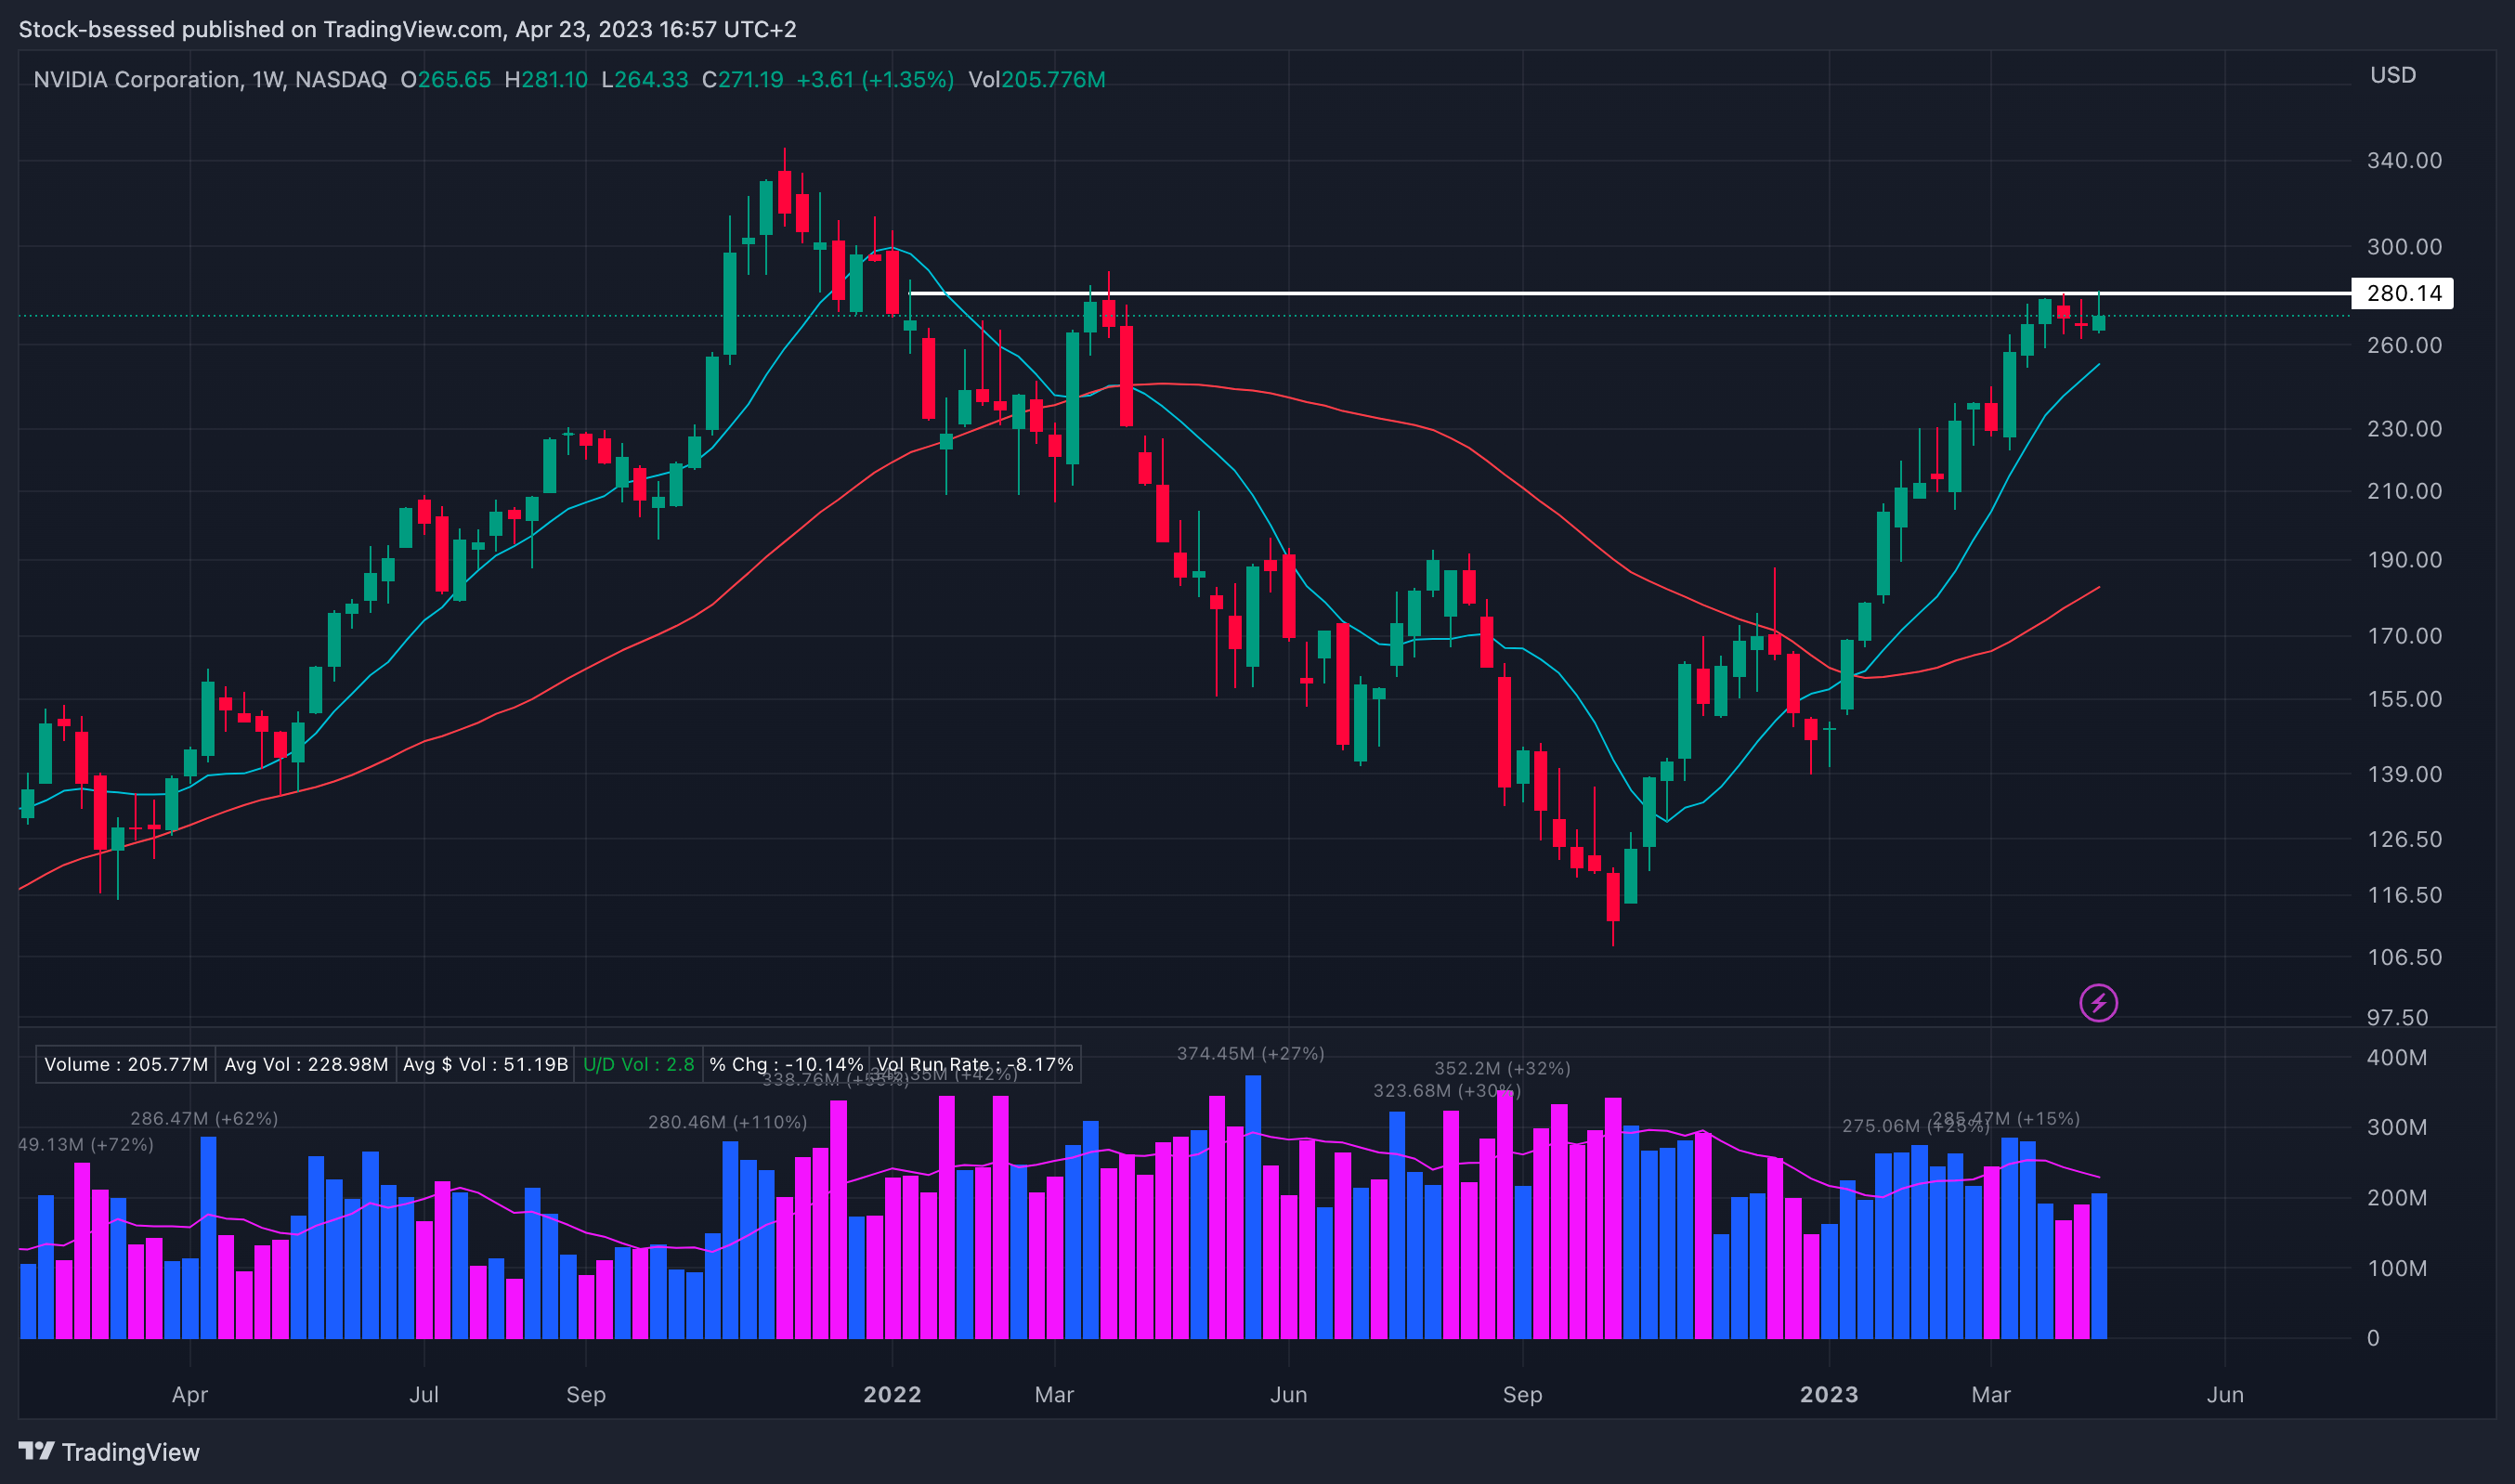
NVDA 0.00%↑ Buyers showing up at a key area once more as the 20EMA proved to provide support. Would like to see this hold into next week and see the ability for buyers to push up from this area:
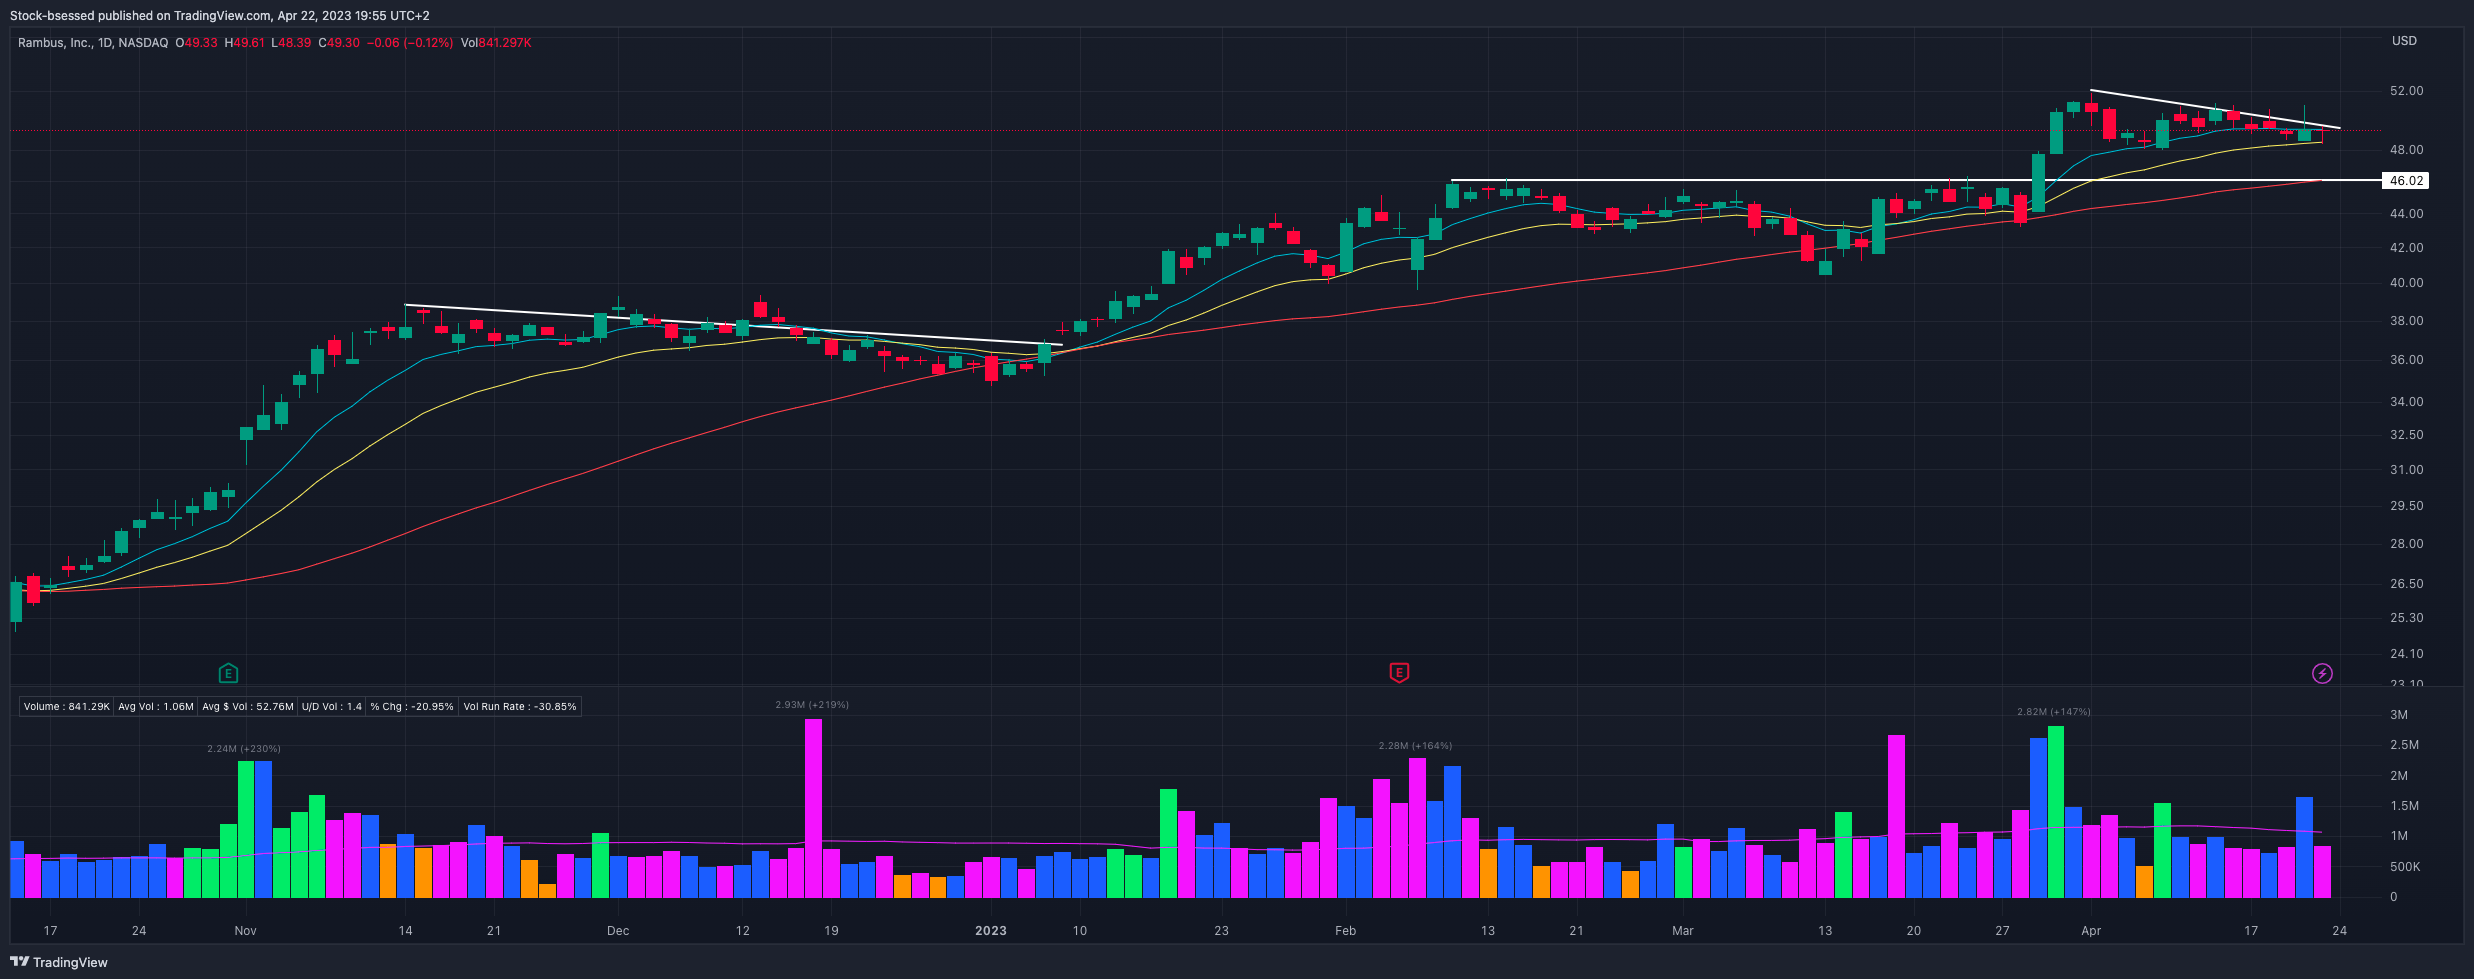
RMBS 0.00%↑ A recent relative strength leader - I like how buyers showed up at the 20EMA and close with a good DCR while consolidating under this descending trend line:
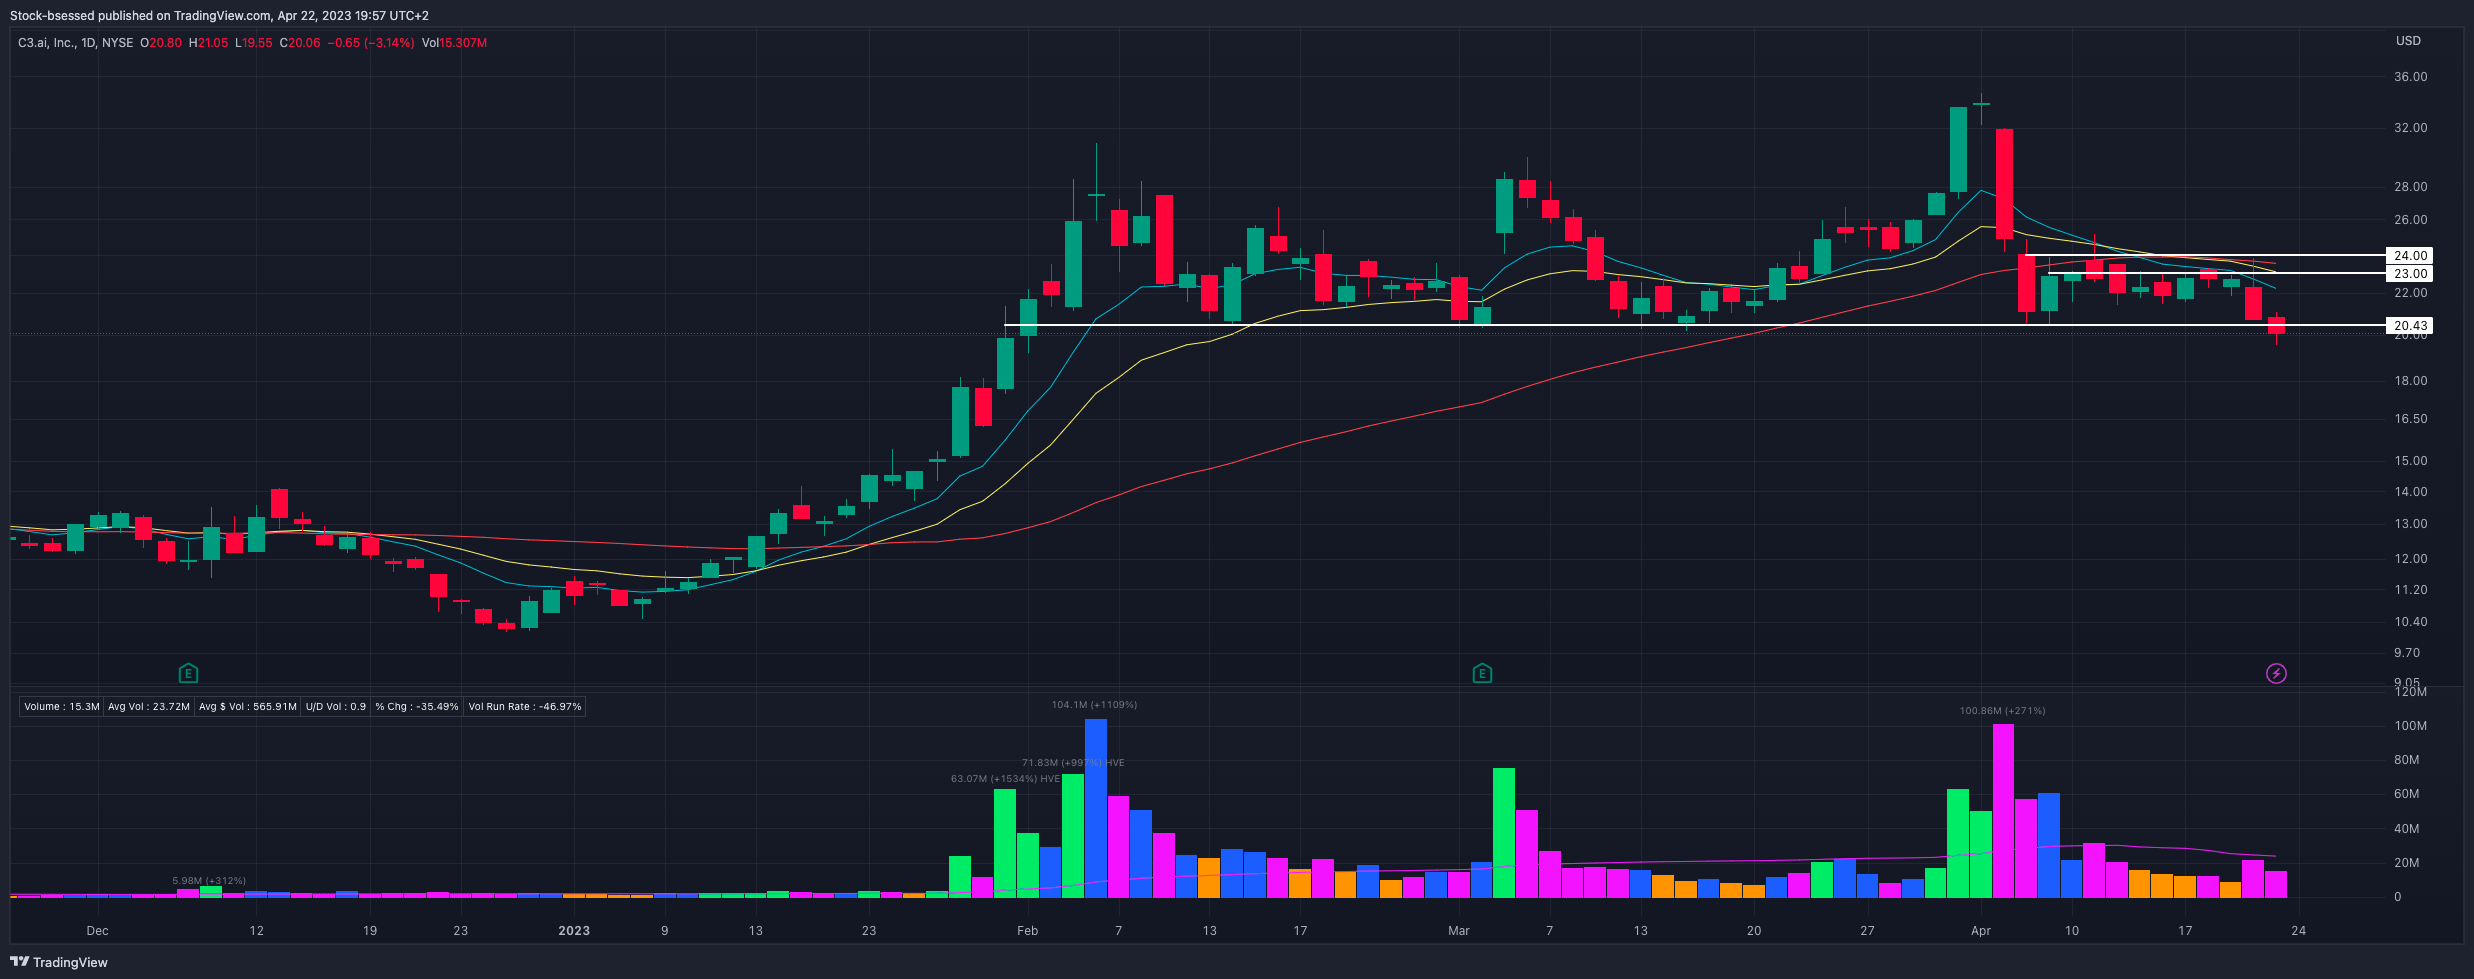
AI 0.00%↑ This and below are some of the warning signs I was talking about - not healthy action as follows through down on the reversal from Thursday to lose the key area of previous support. Positive to close above the 20.00 area but there are stronger names:
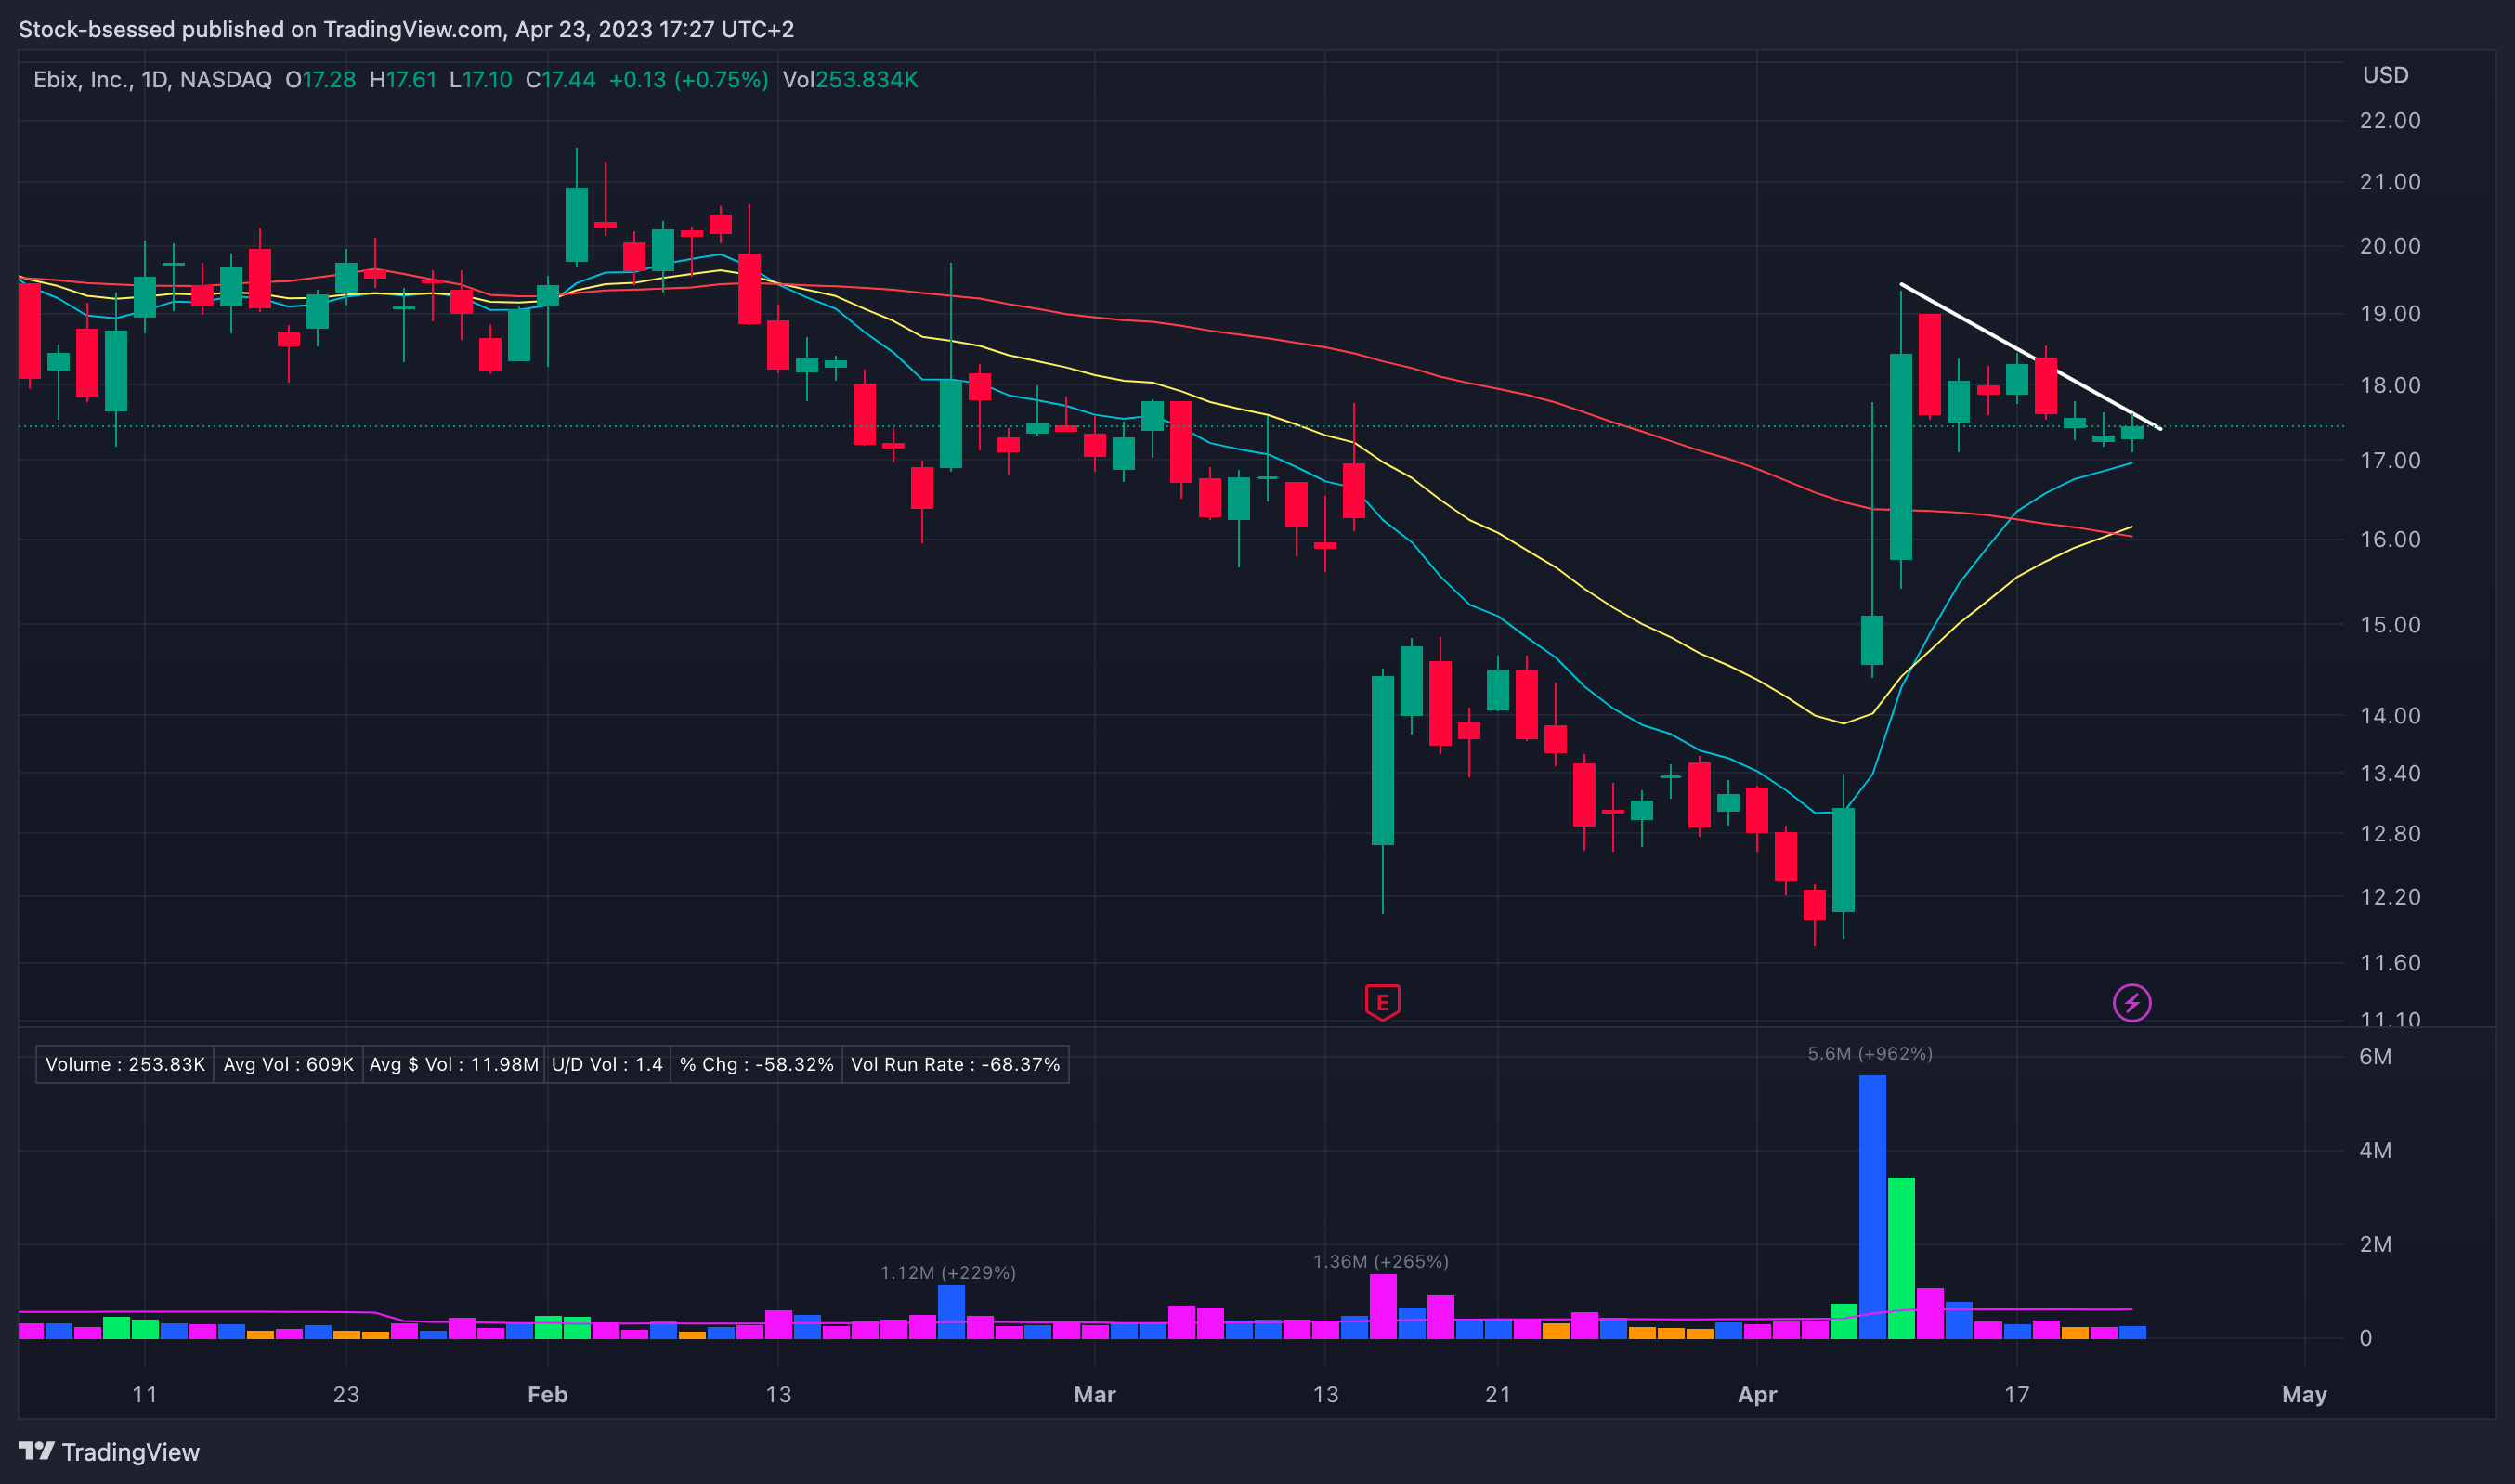
ASUR 0.00%↑ With a big reversal on heavy volume to close the session -12%. Held the 50-day moving average but not a fan of this heavy distribution on the session:

Weekly:
The IPO portion of the market is a measure of how aggressive investors are being - typically, when several IPOs are setting up and acting well this is an encouraging sign - really liking how these younger stocks are pushing key areas on their weekly charts:

ANET 0.00%↑ Flags down into the 10WMA following a recent base breakout. Closes poorly and would like to see this low hold:

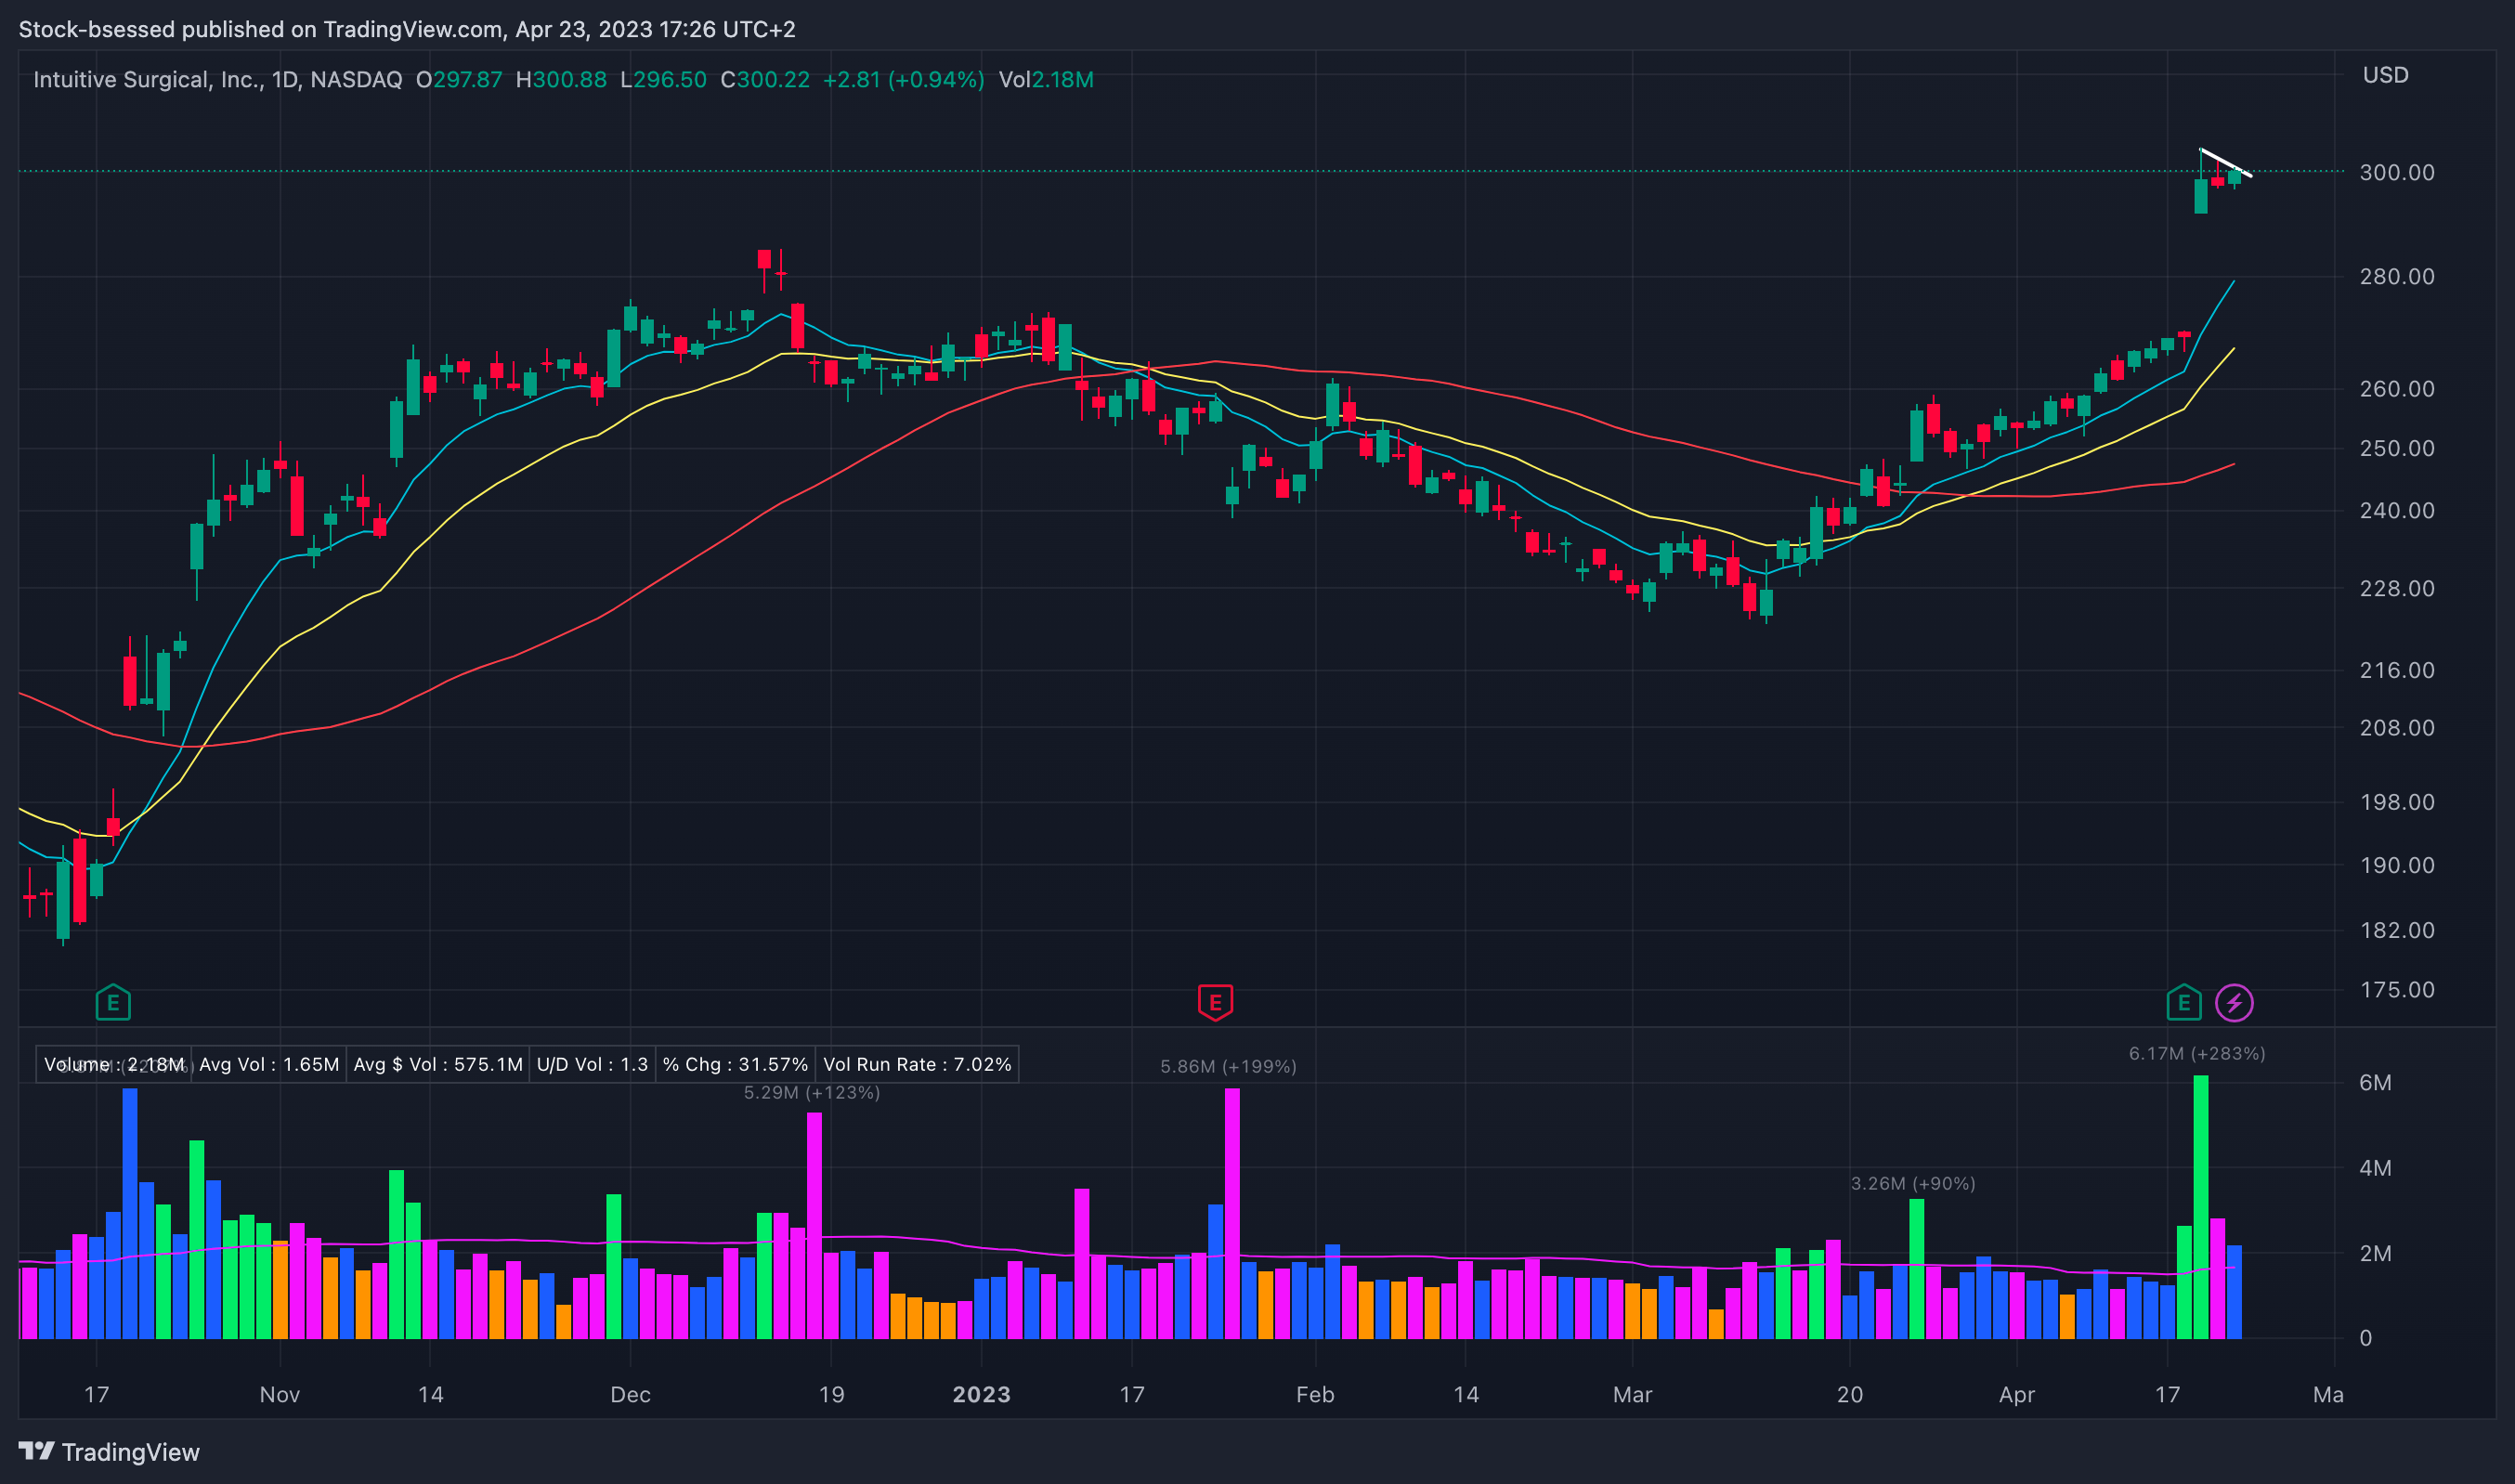
NVDA 0.00%↑ 280 is the key area to watch on the weekly chart:
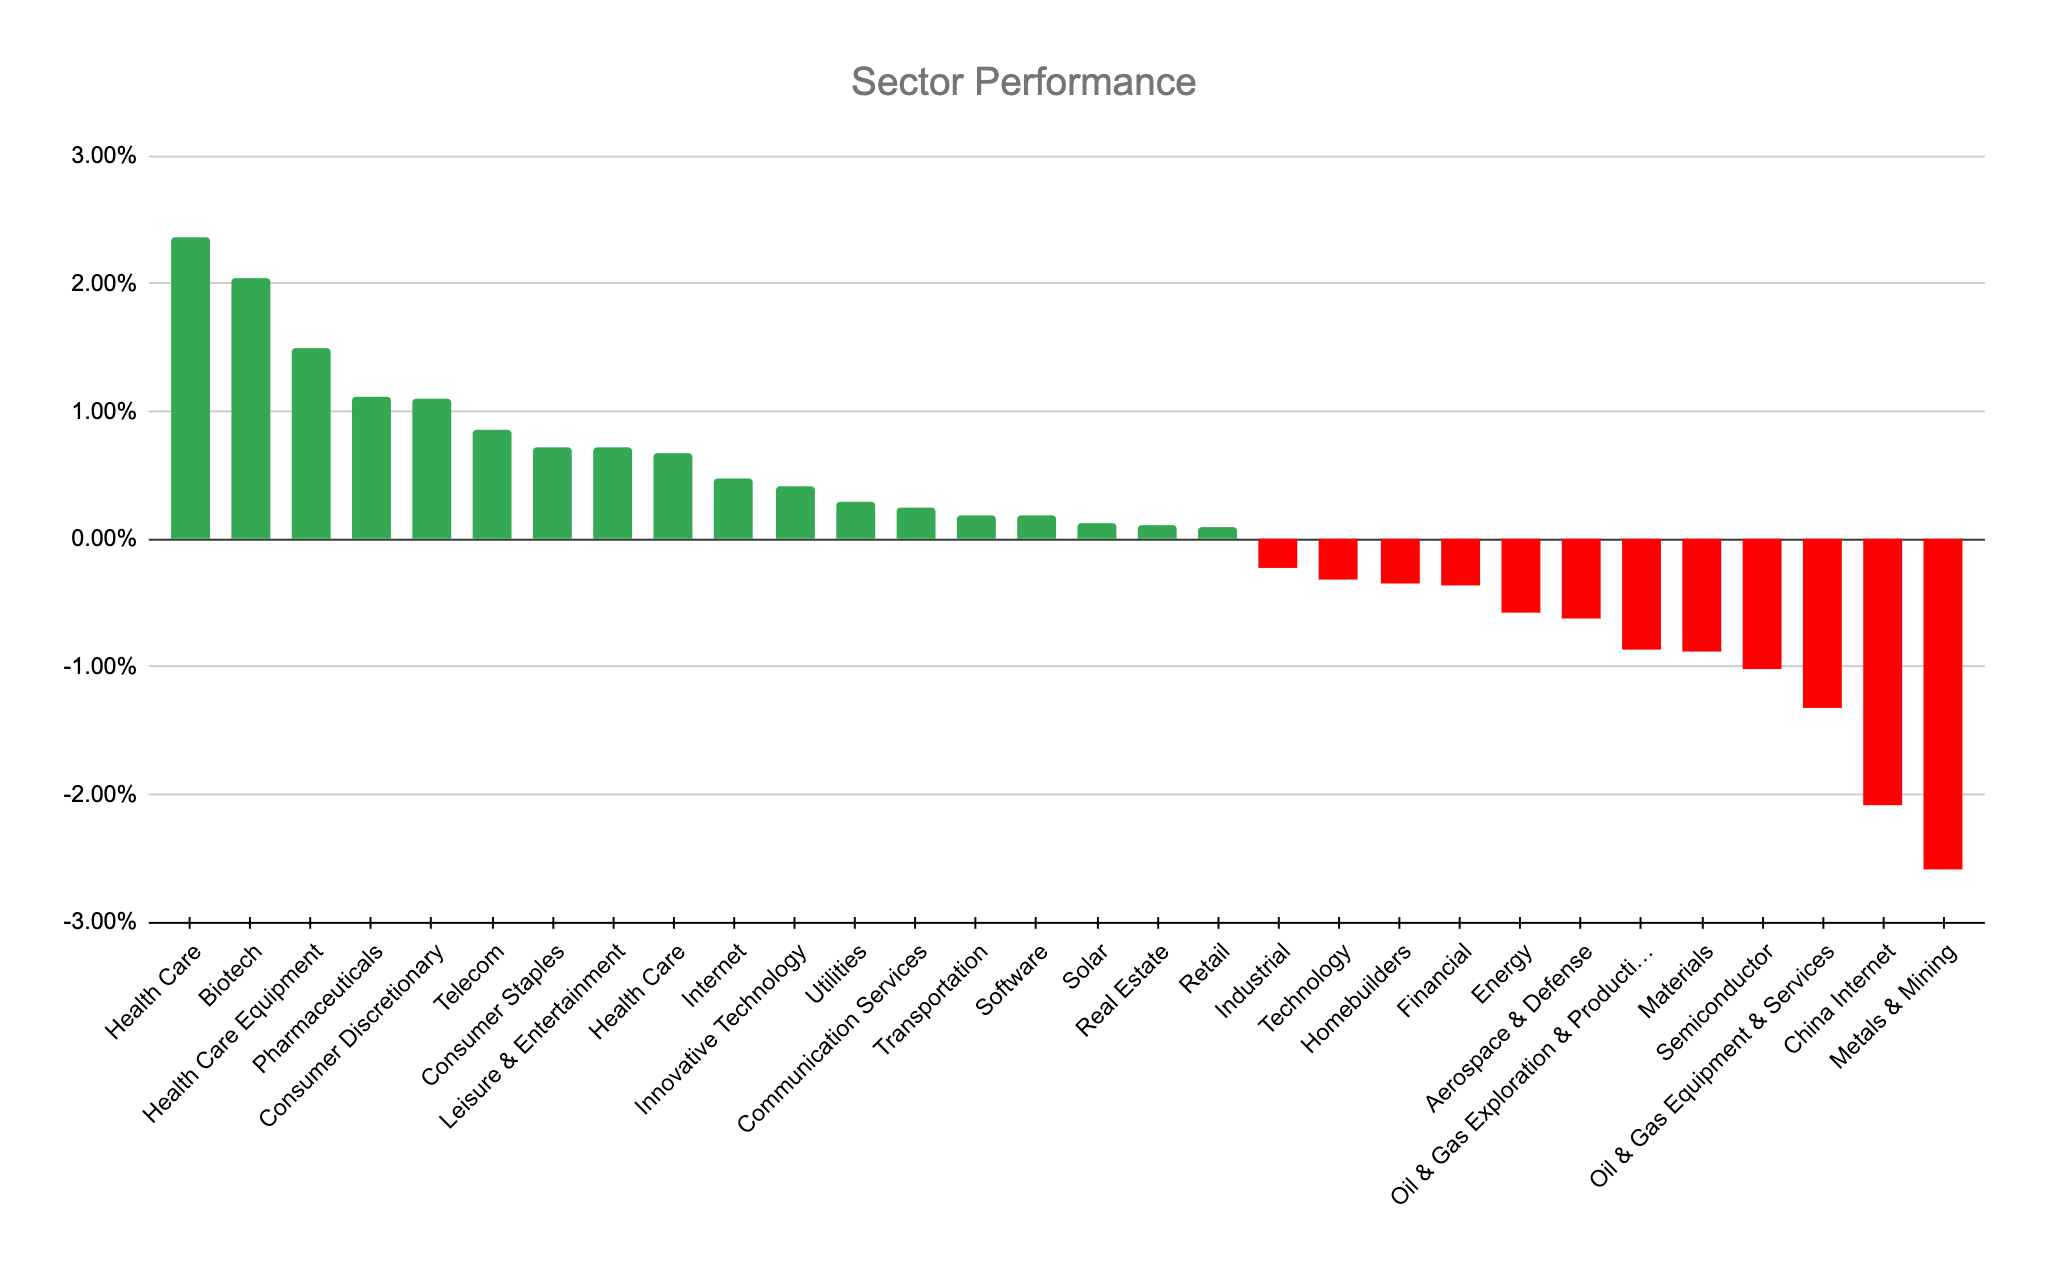
Individual Sector Analysis
Daily:

I am linking the sectors watchlist in tradingview for your convenience, here
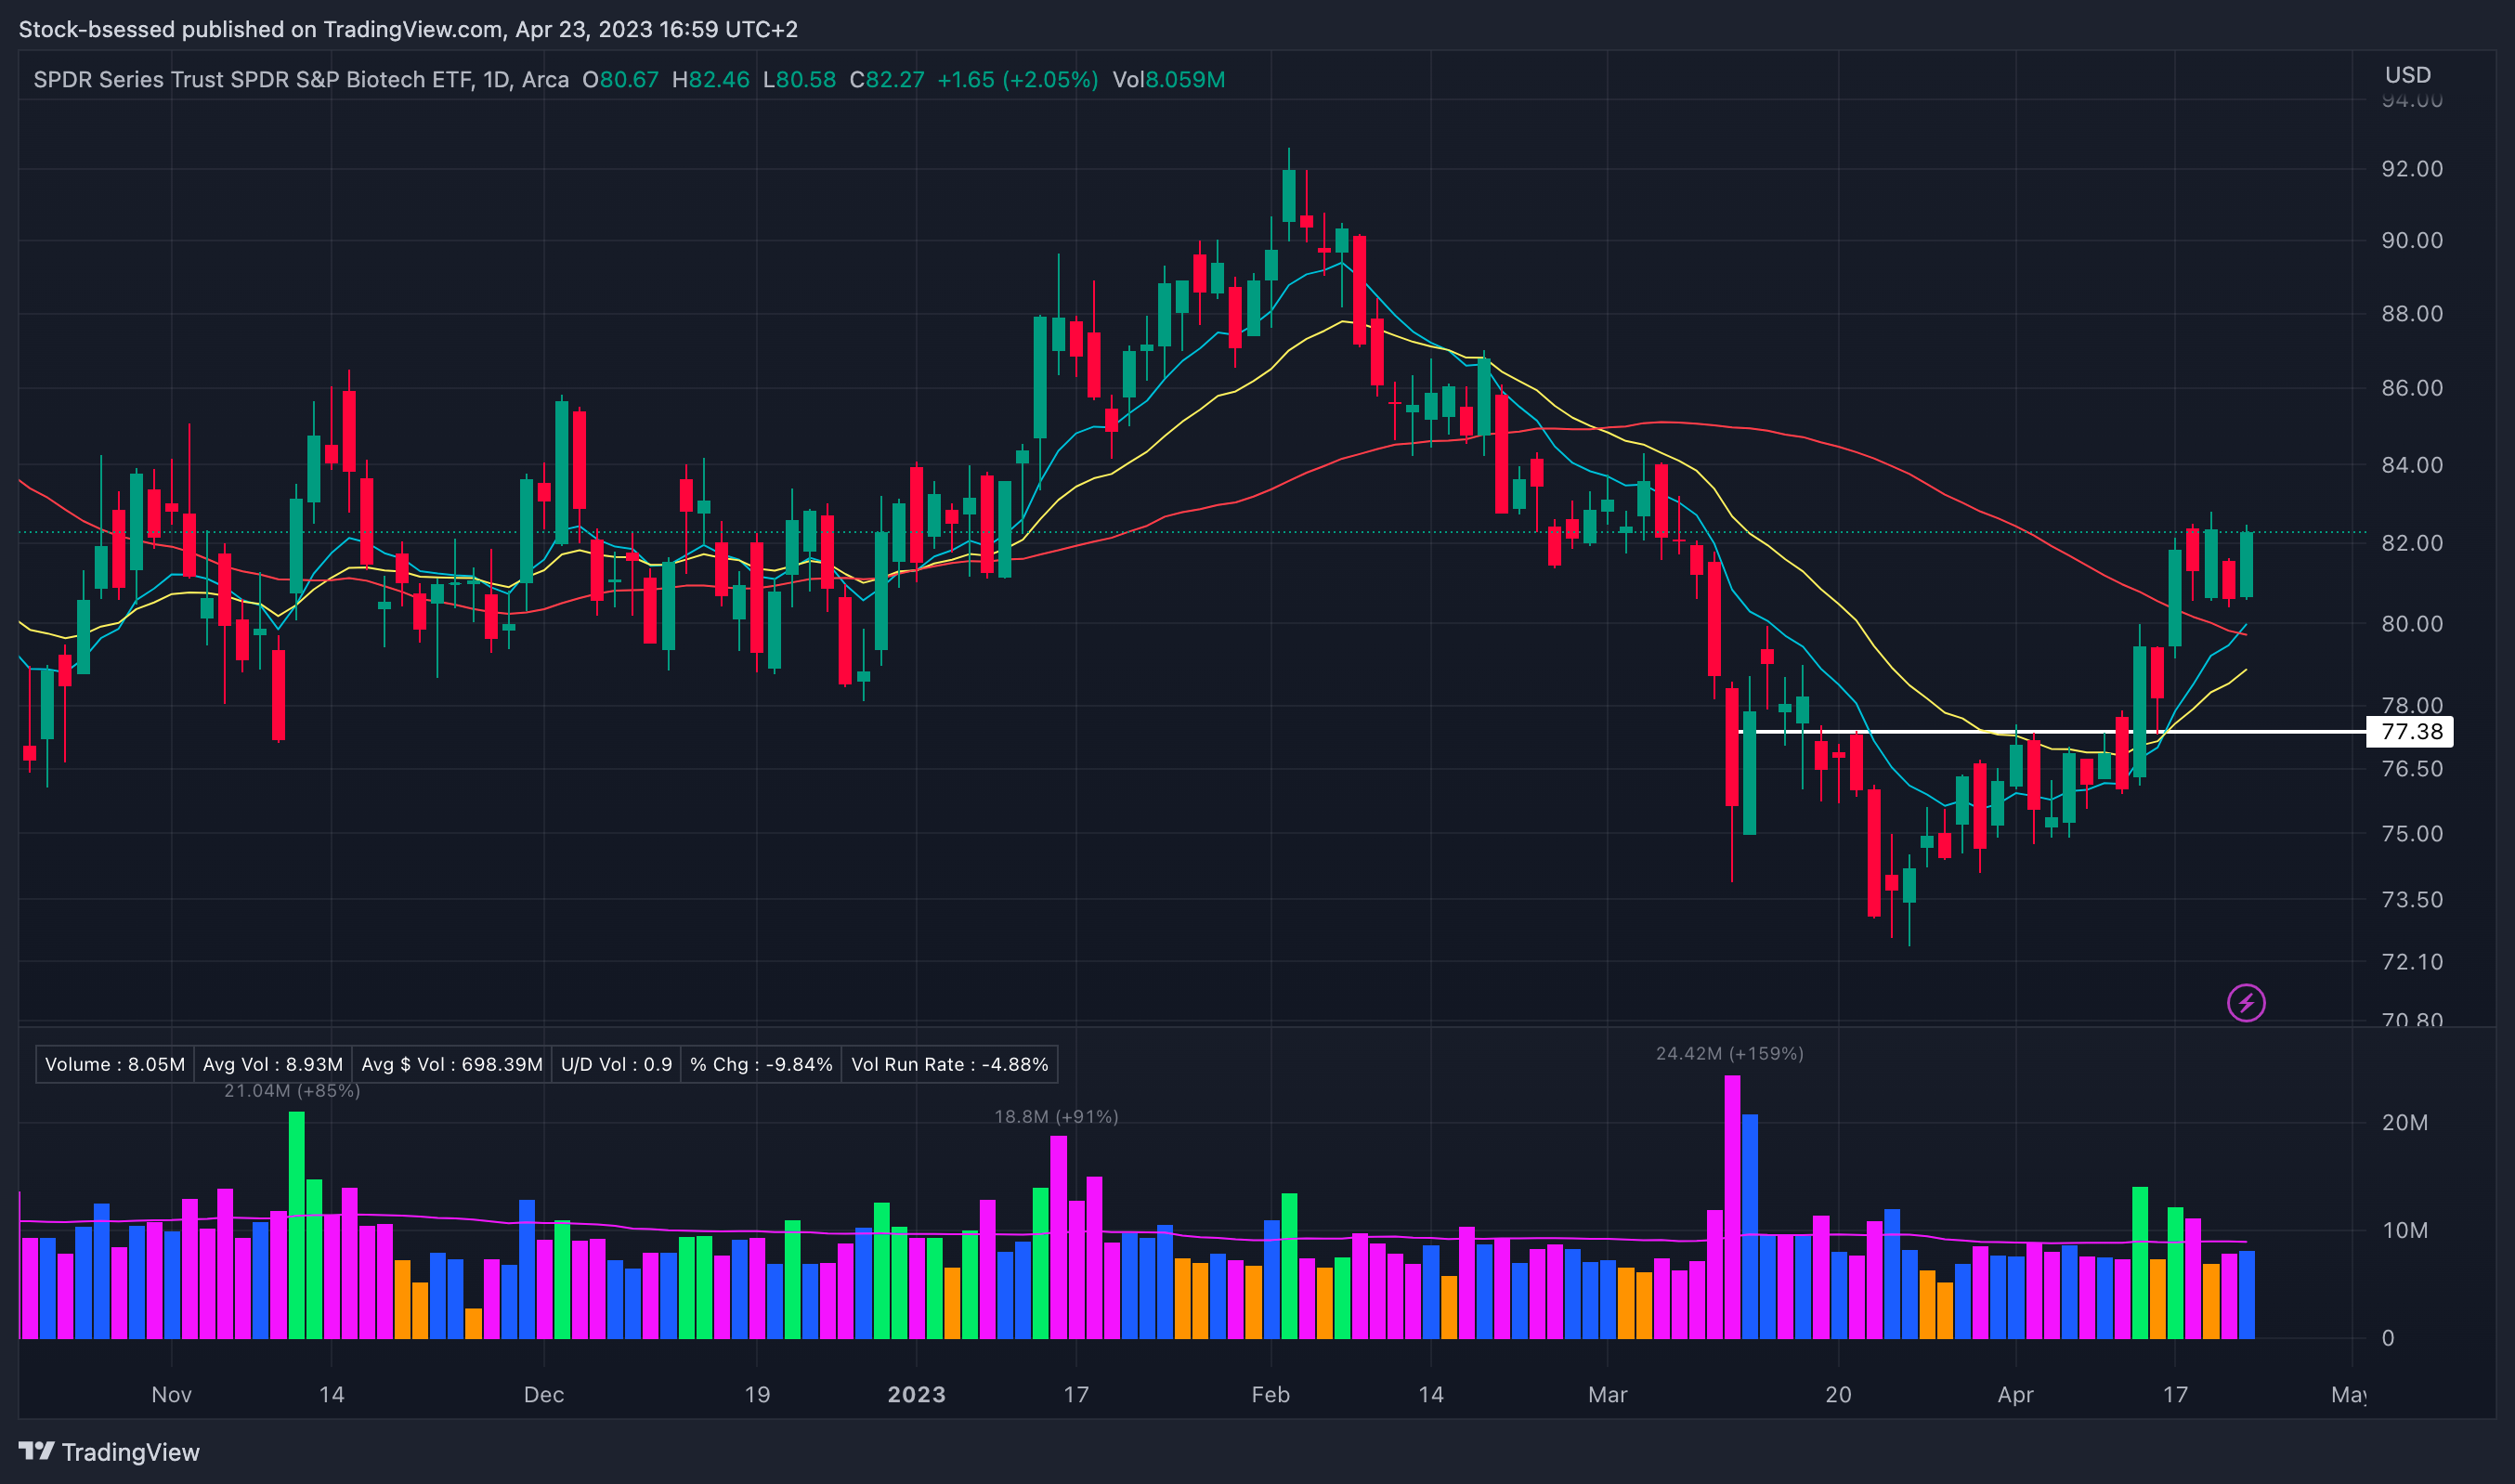
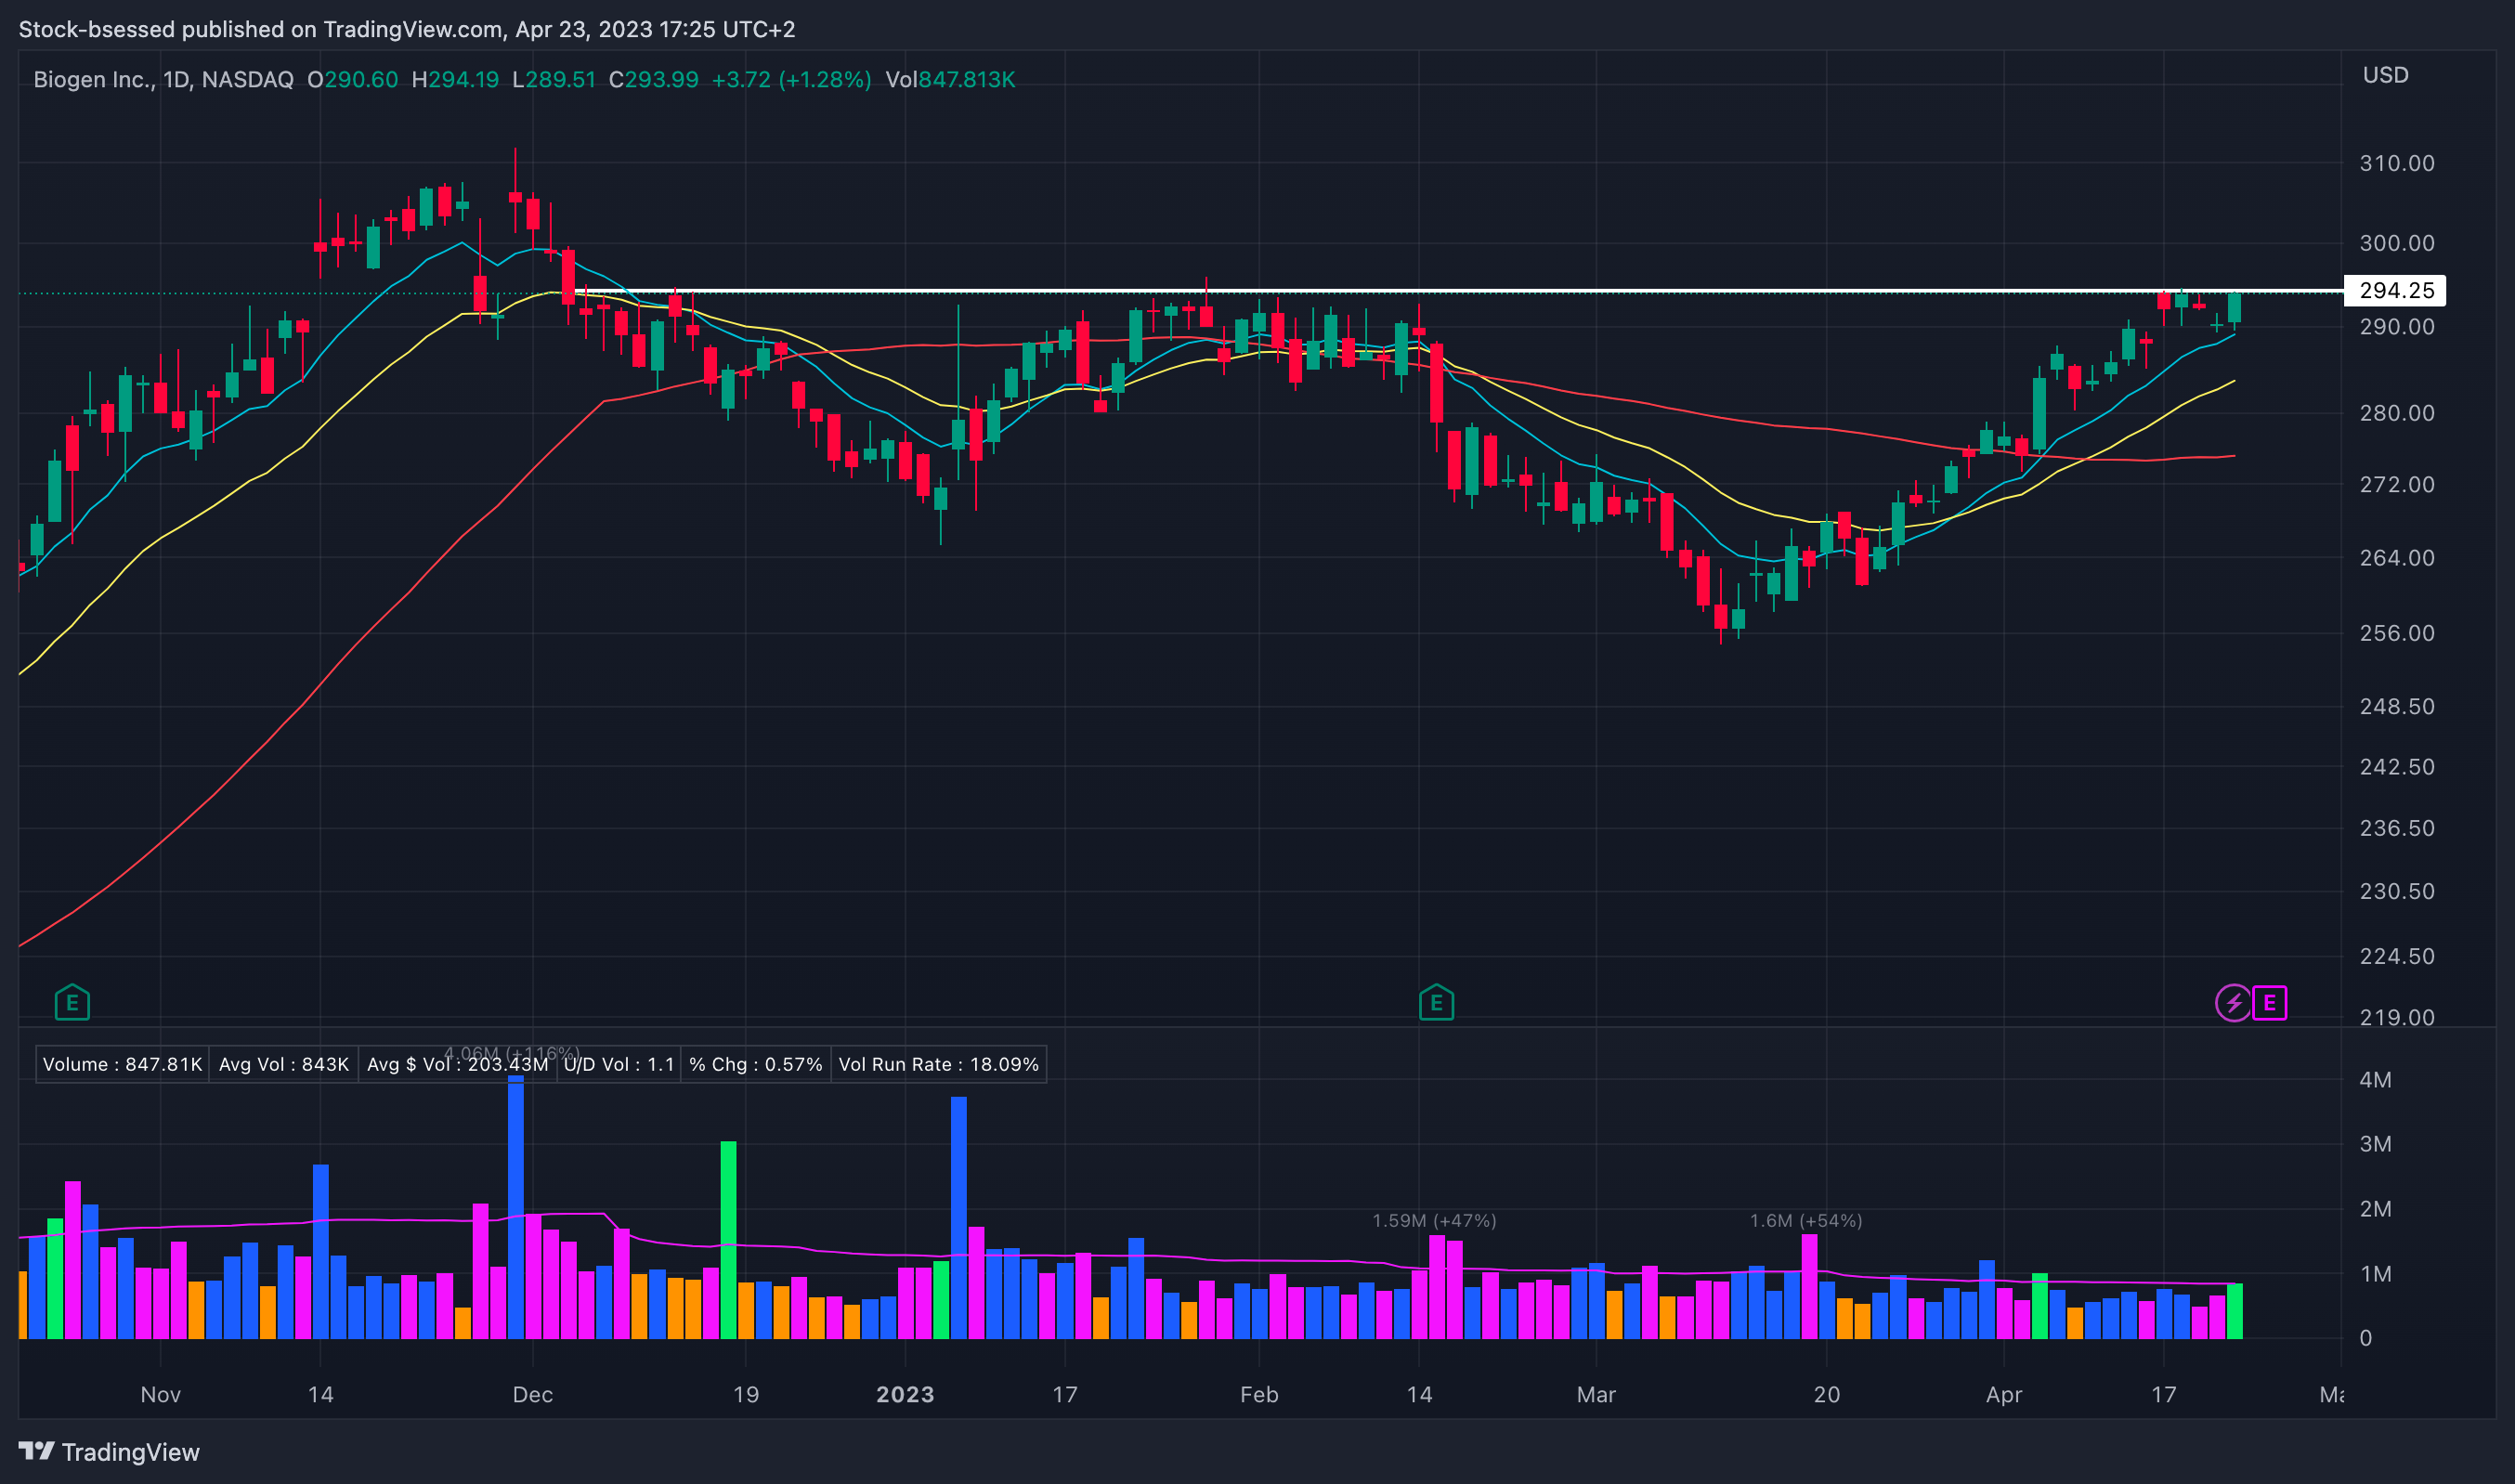
XBI 0.00%↑ Good action from biotechs here as buyers keep showing up on weakness and short-live pullbacks the last few sessions. 10 EMA now above the 50-day moving average and 20EMA also pushing upwards. Watching action vs ~82.50 on strength:
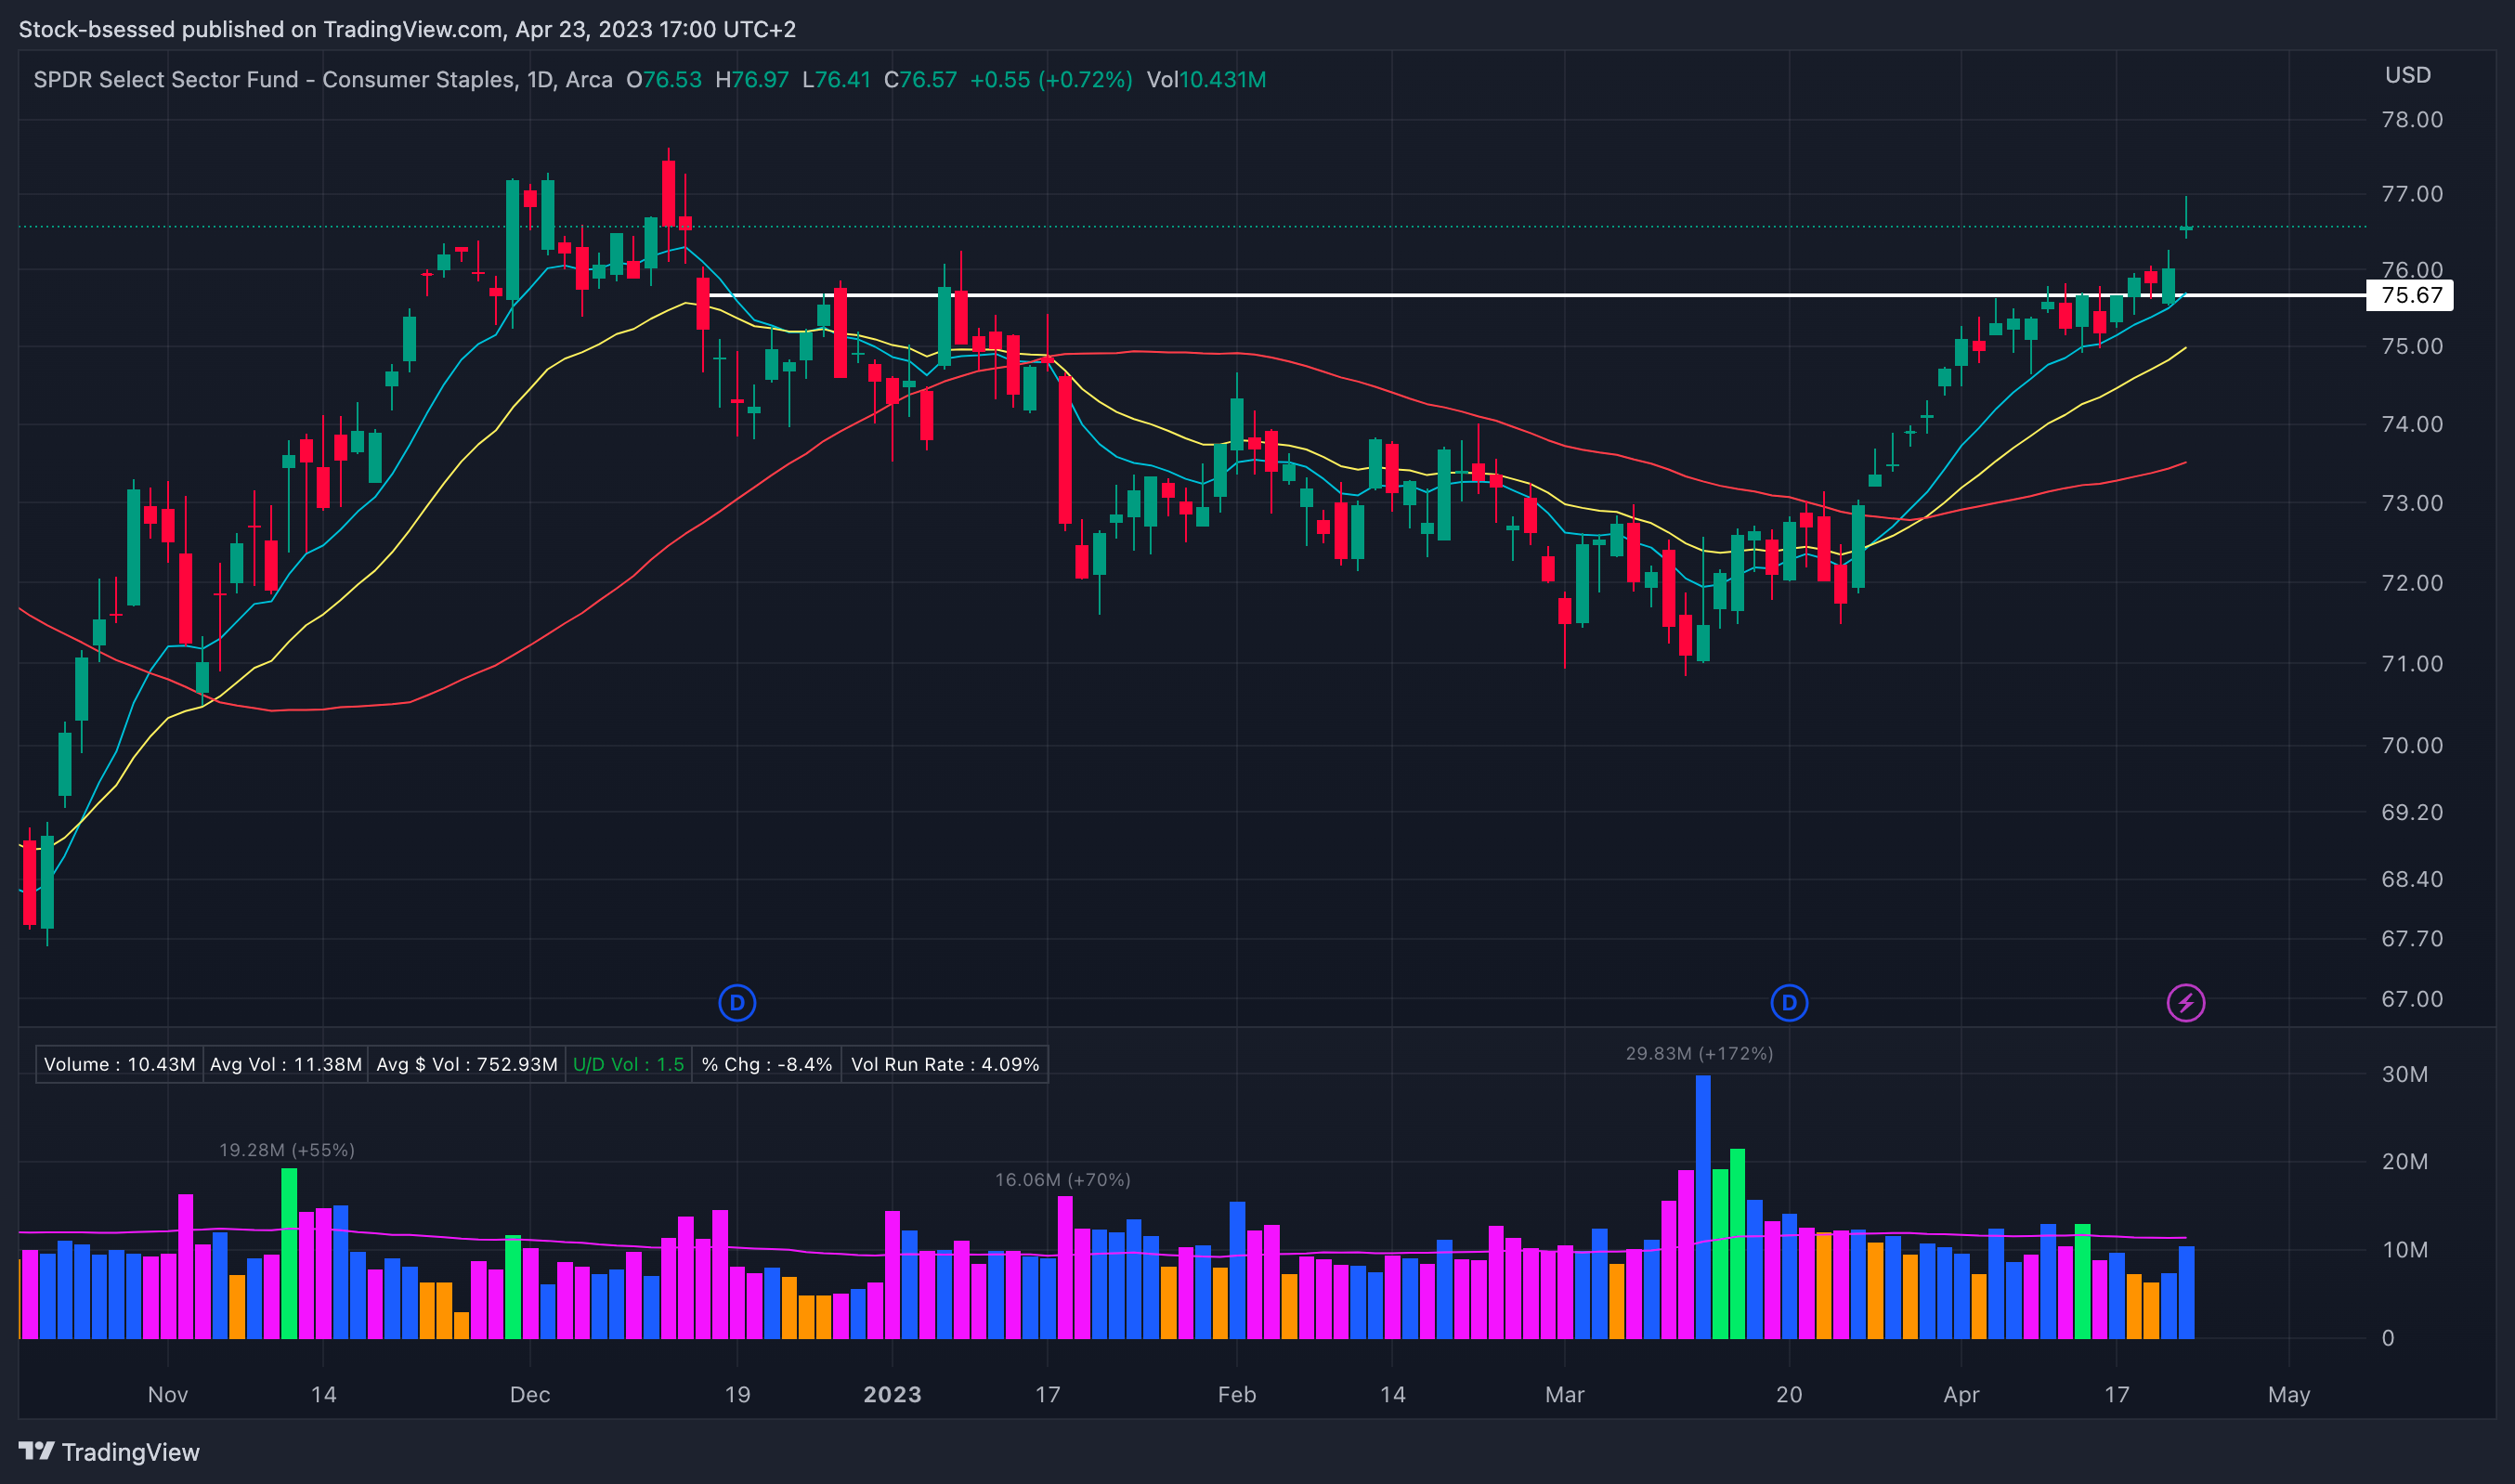
XLP 0.00%↑ Gaps up to close relatively poorly on the session but still able to hold the gap into the close. Above the key area ~75.67 and has KMAs trending upwards nicely:
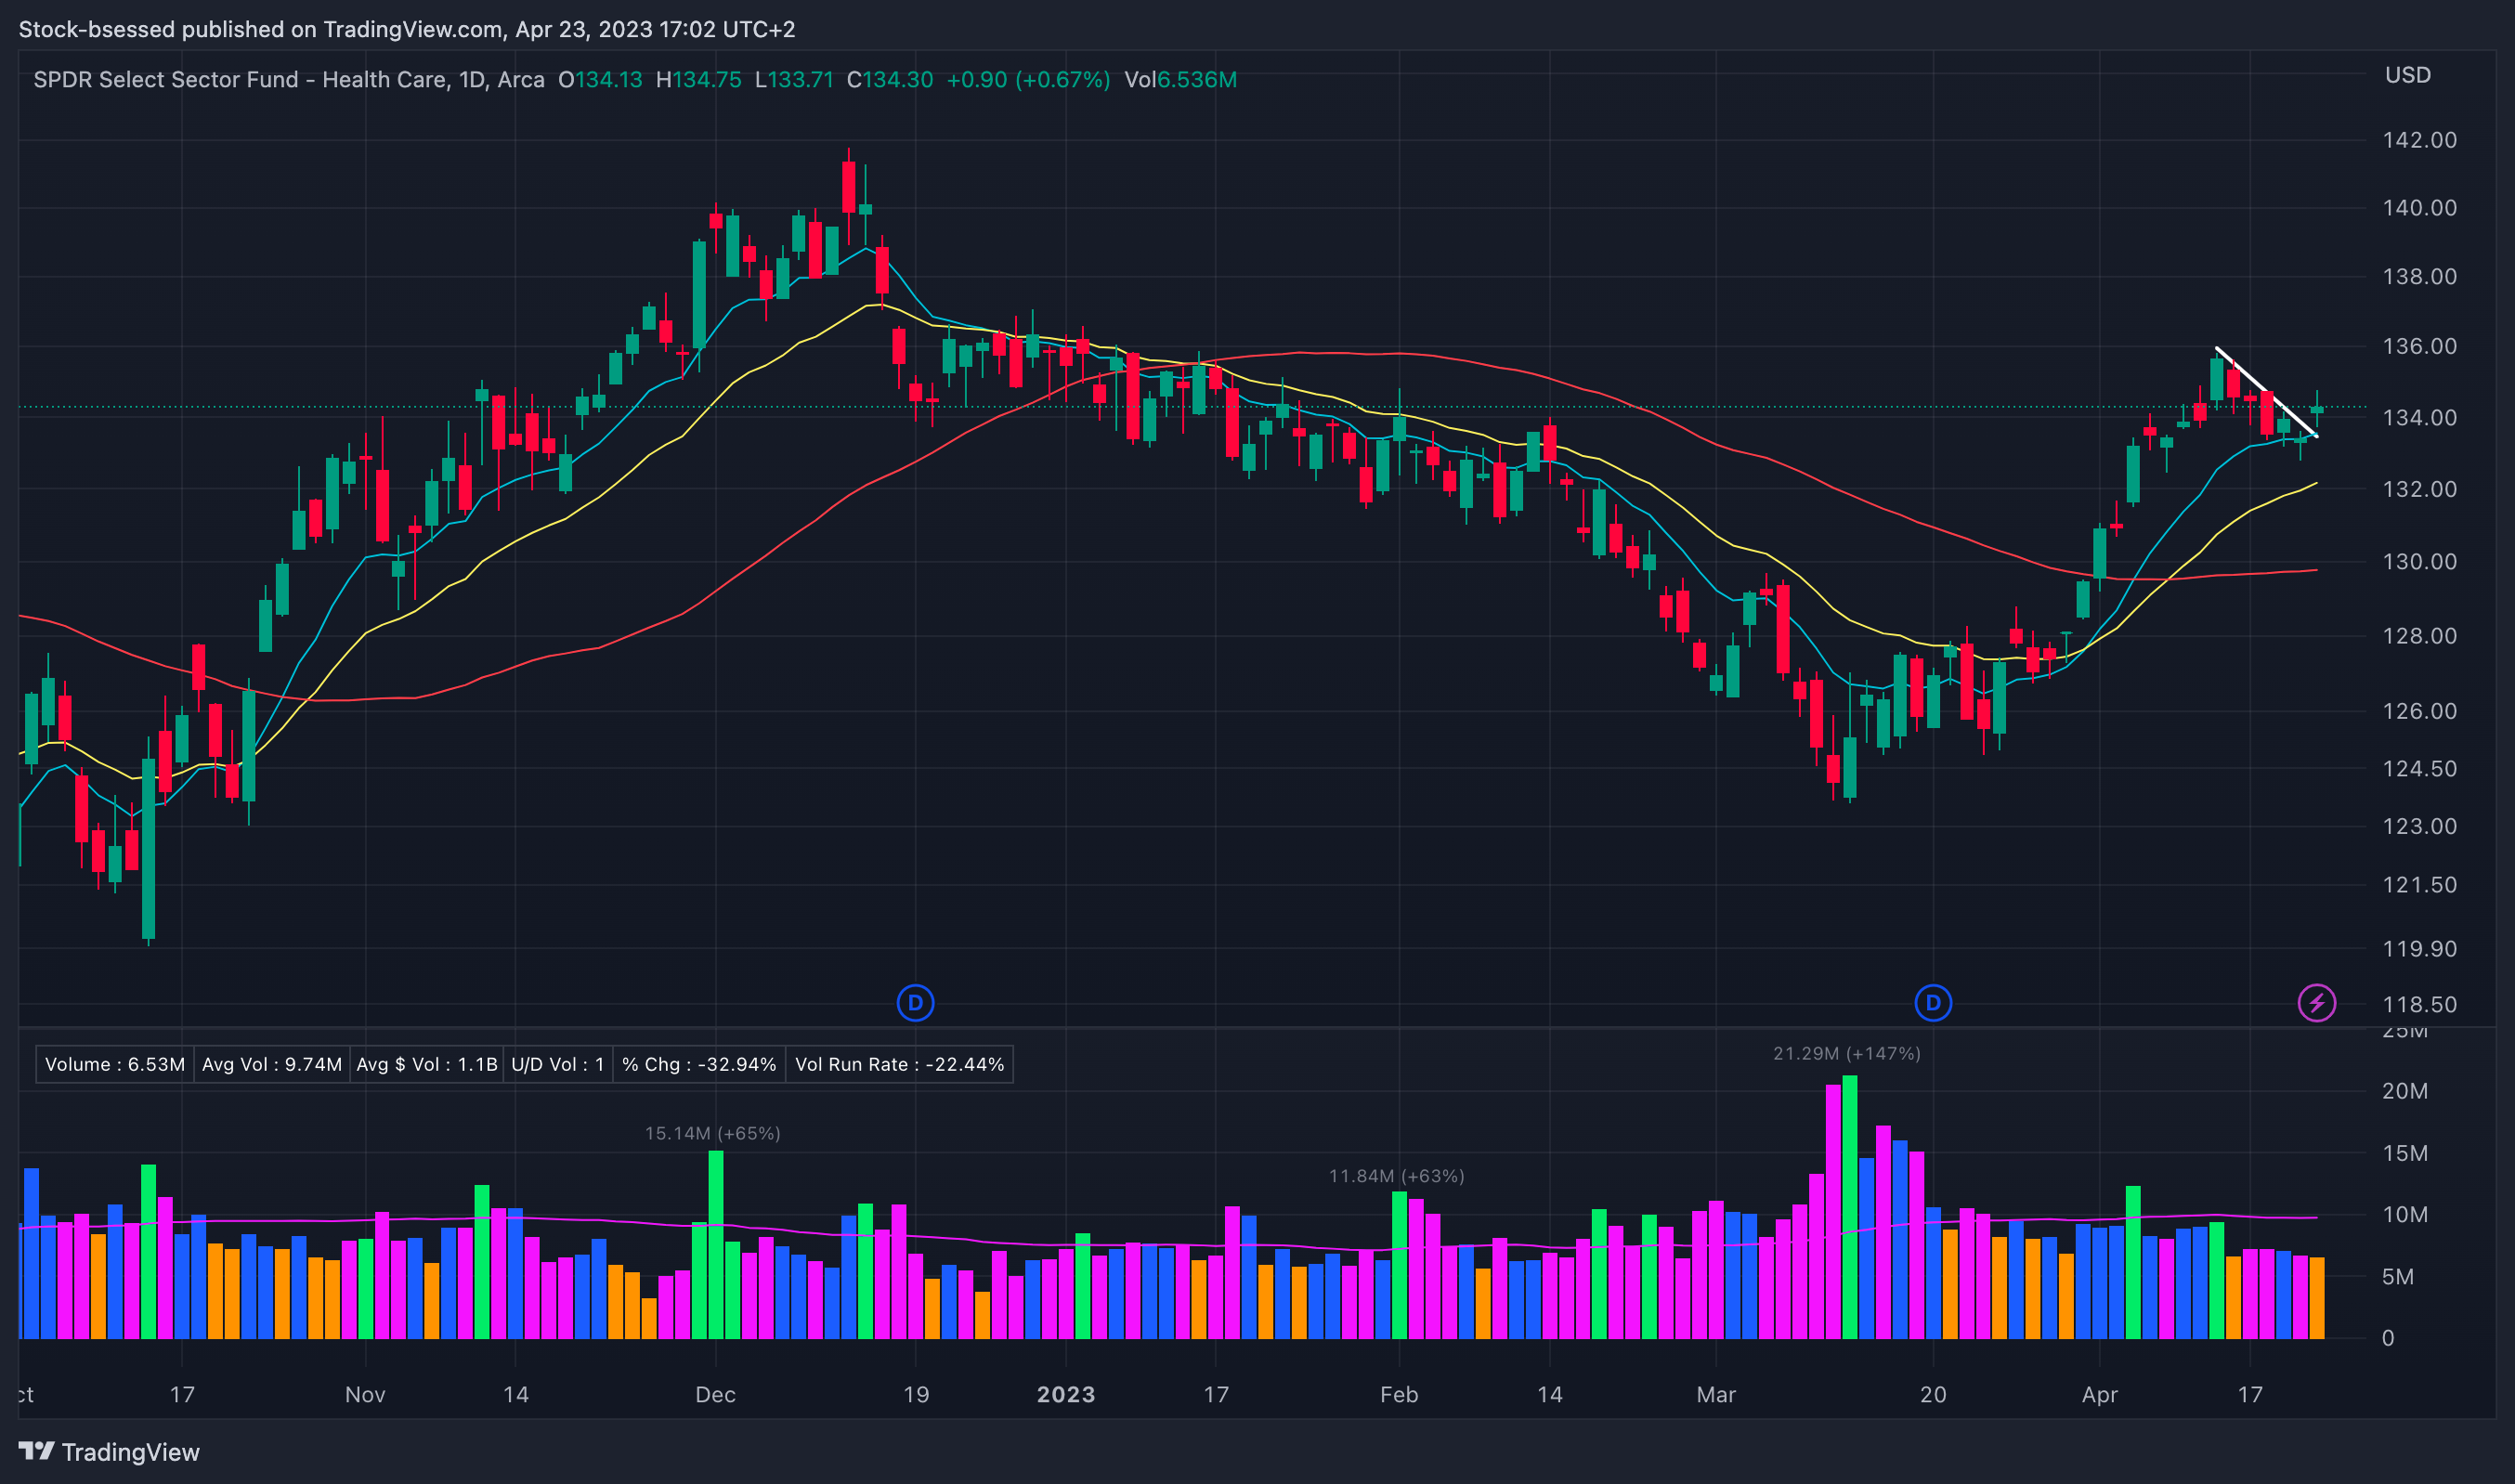
XLV 0.00%↑ Had a nice run since mid-March then flagged out nicely into the 10EMA and got going once more last session on a break of its descending trend line - good action:
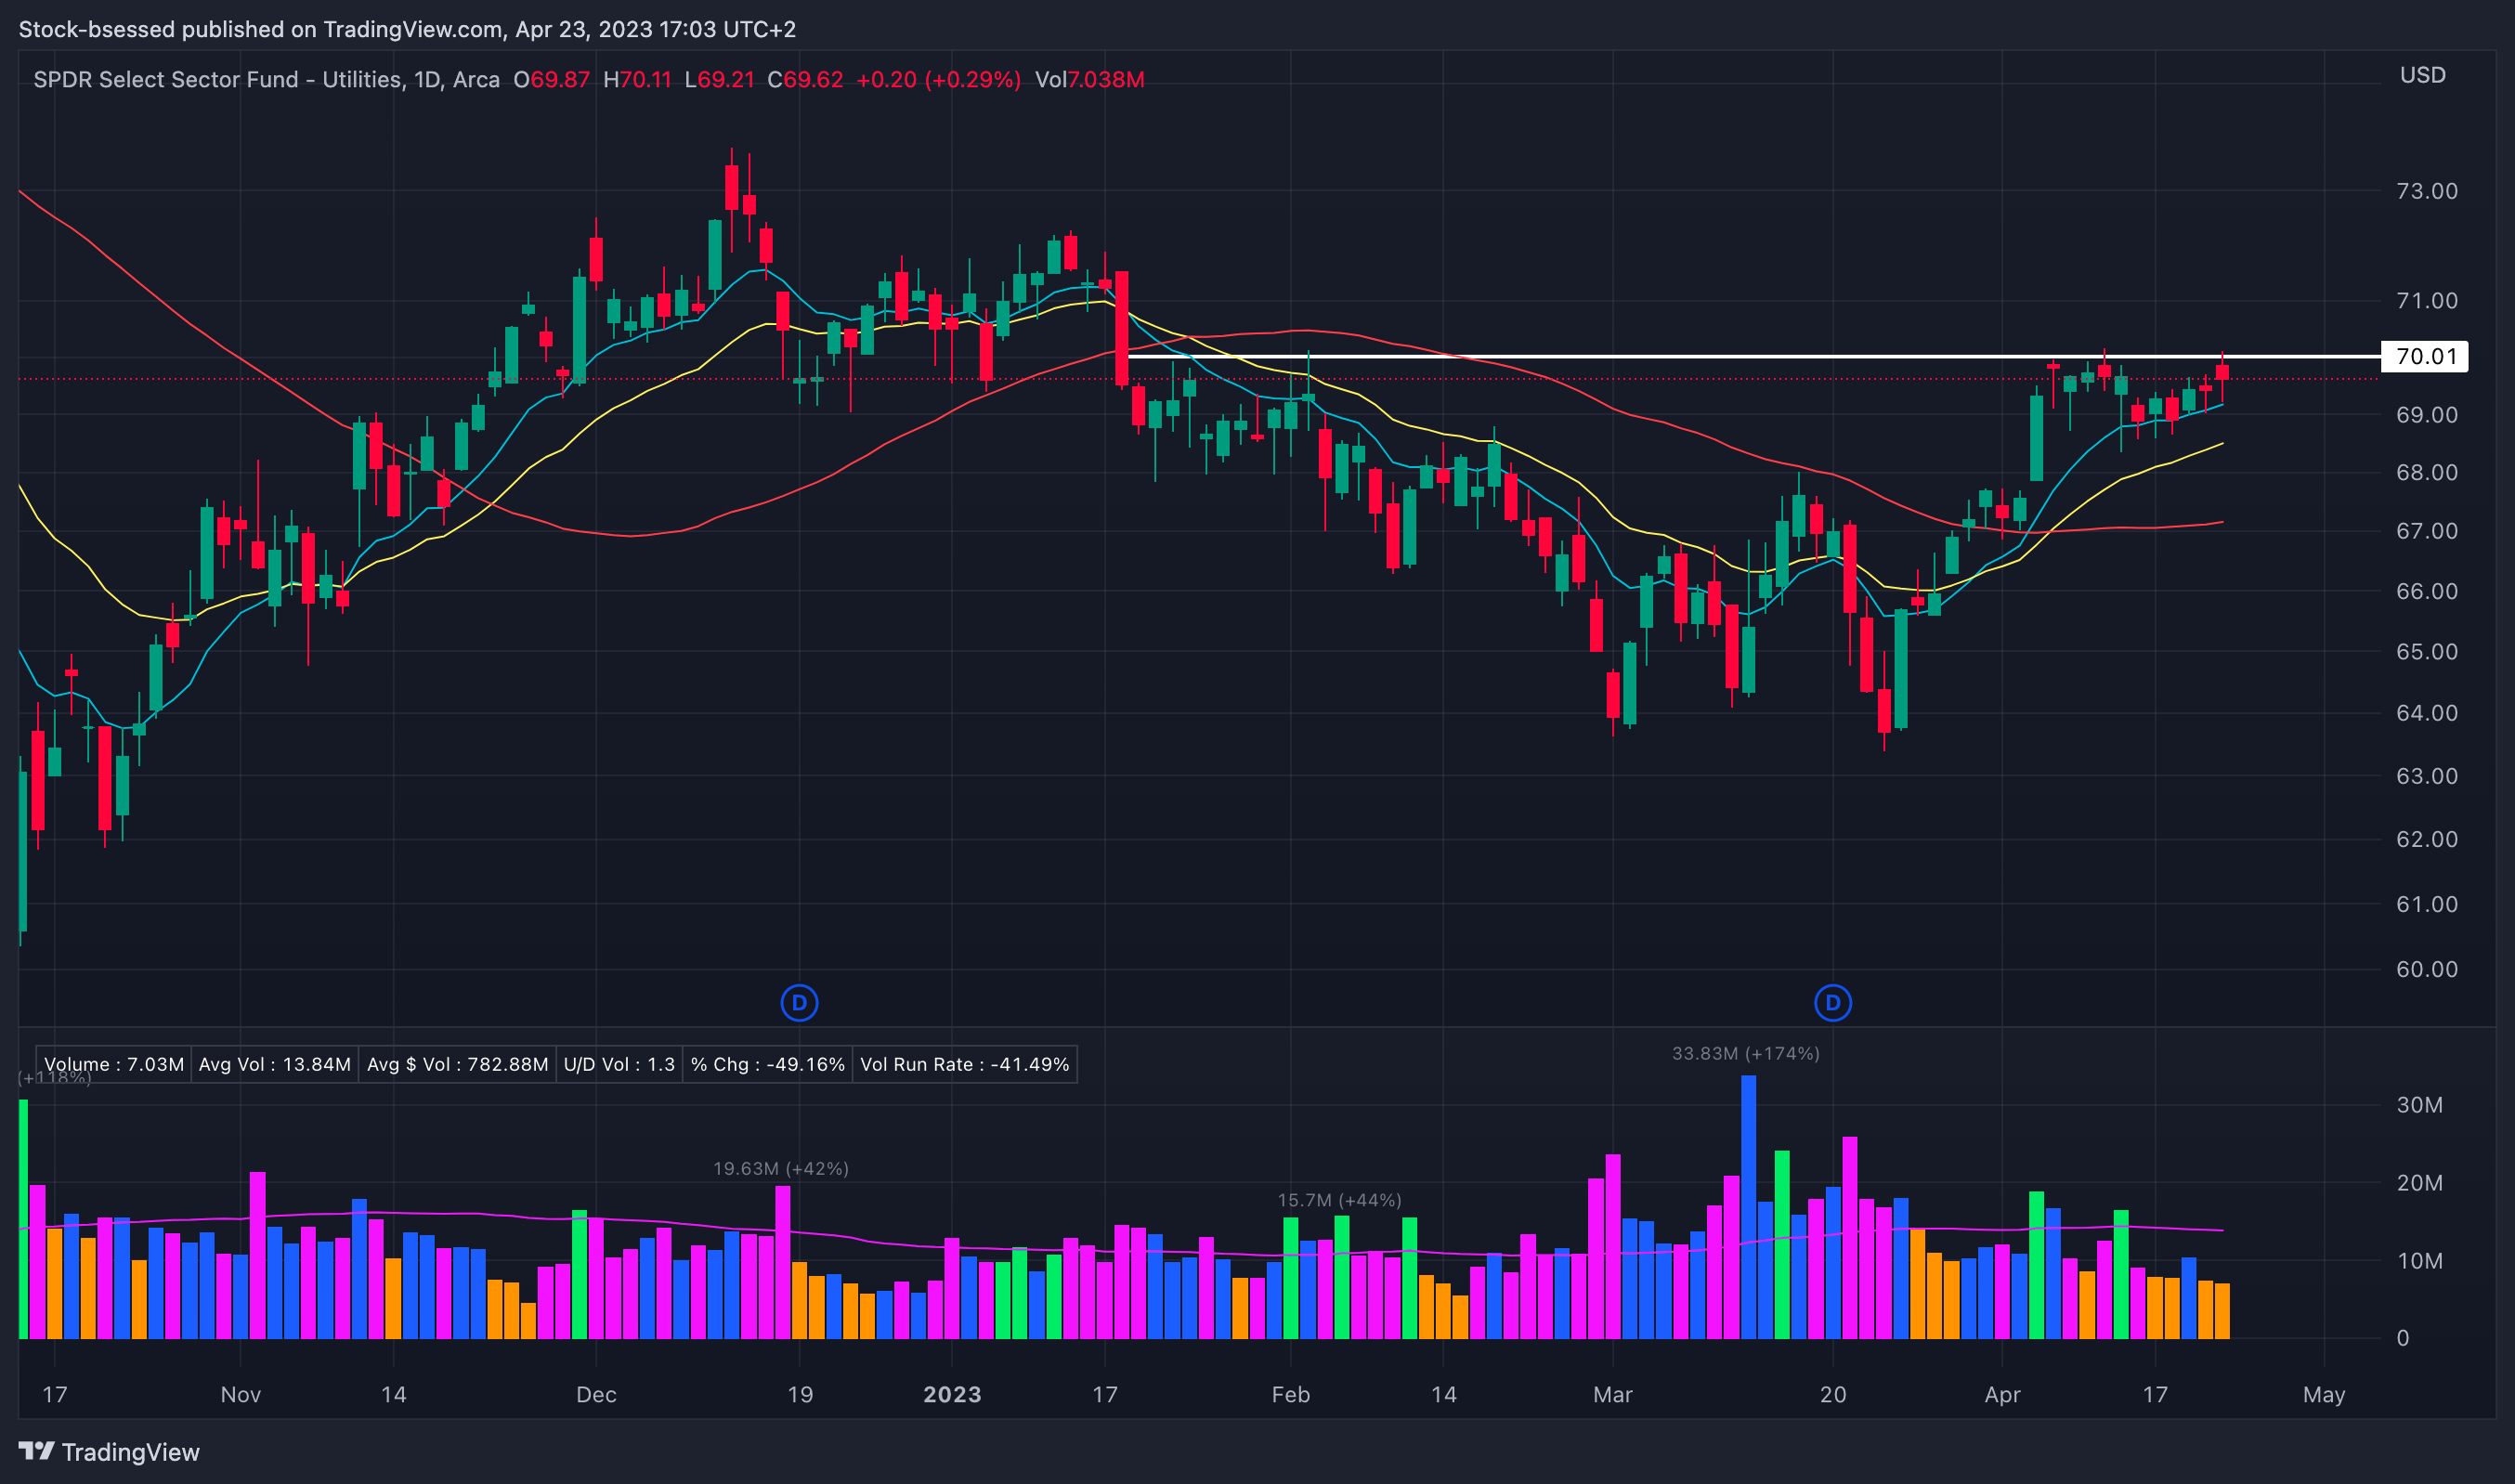
XLU 0.00%↑ Struggled with this key area ~70 last session and will continue watching this going forward:
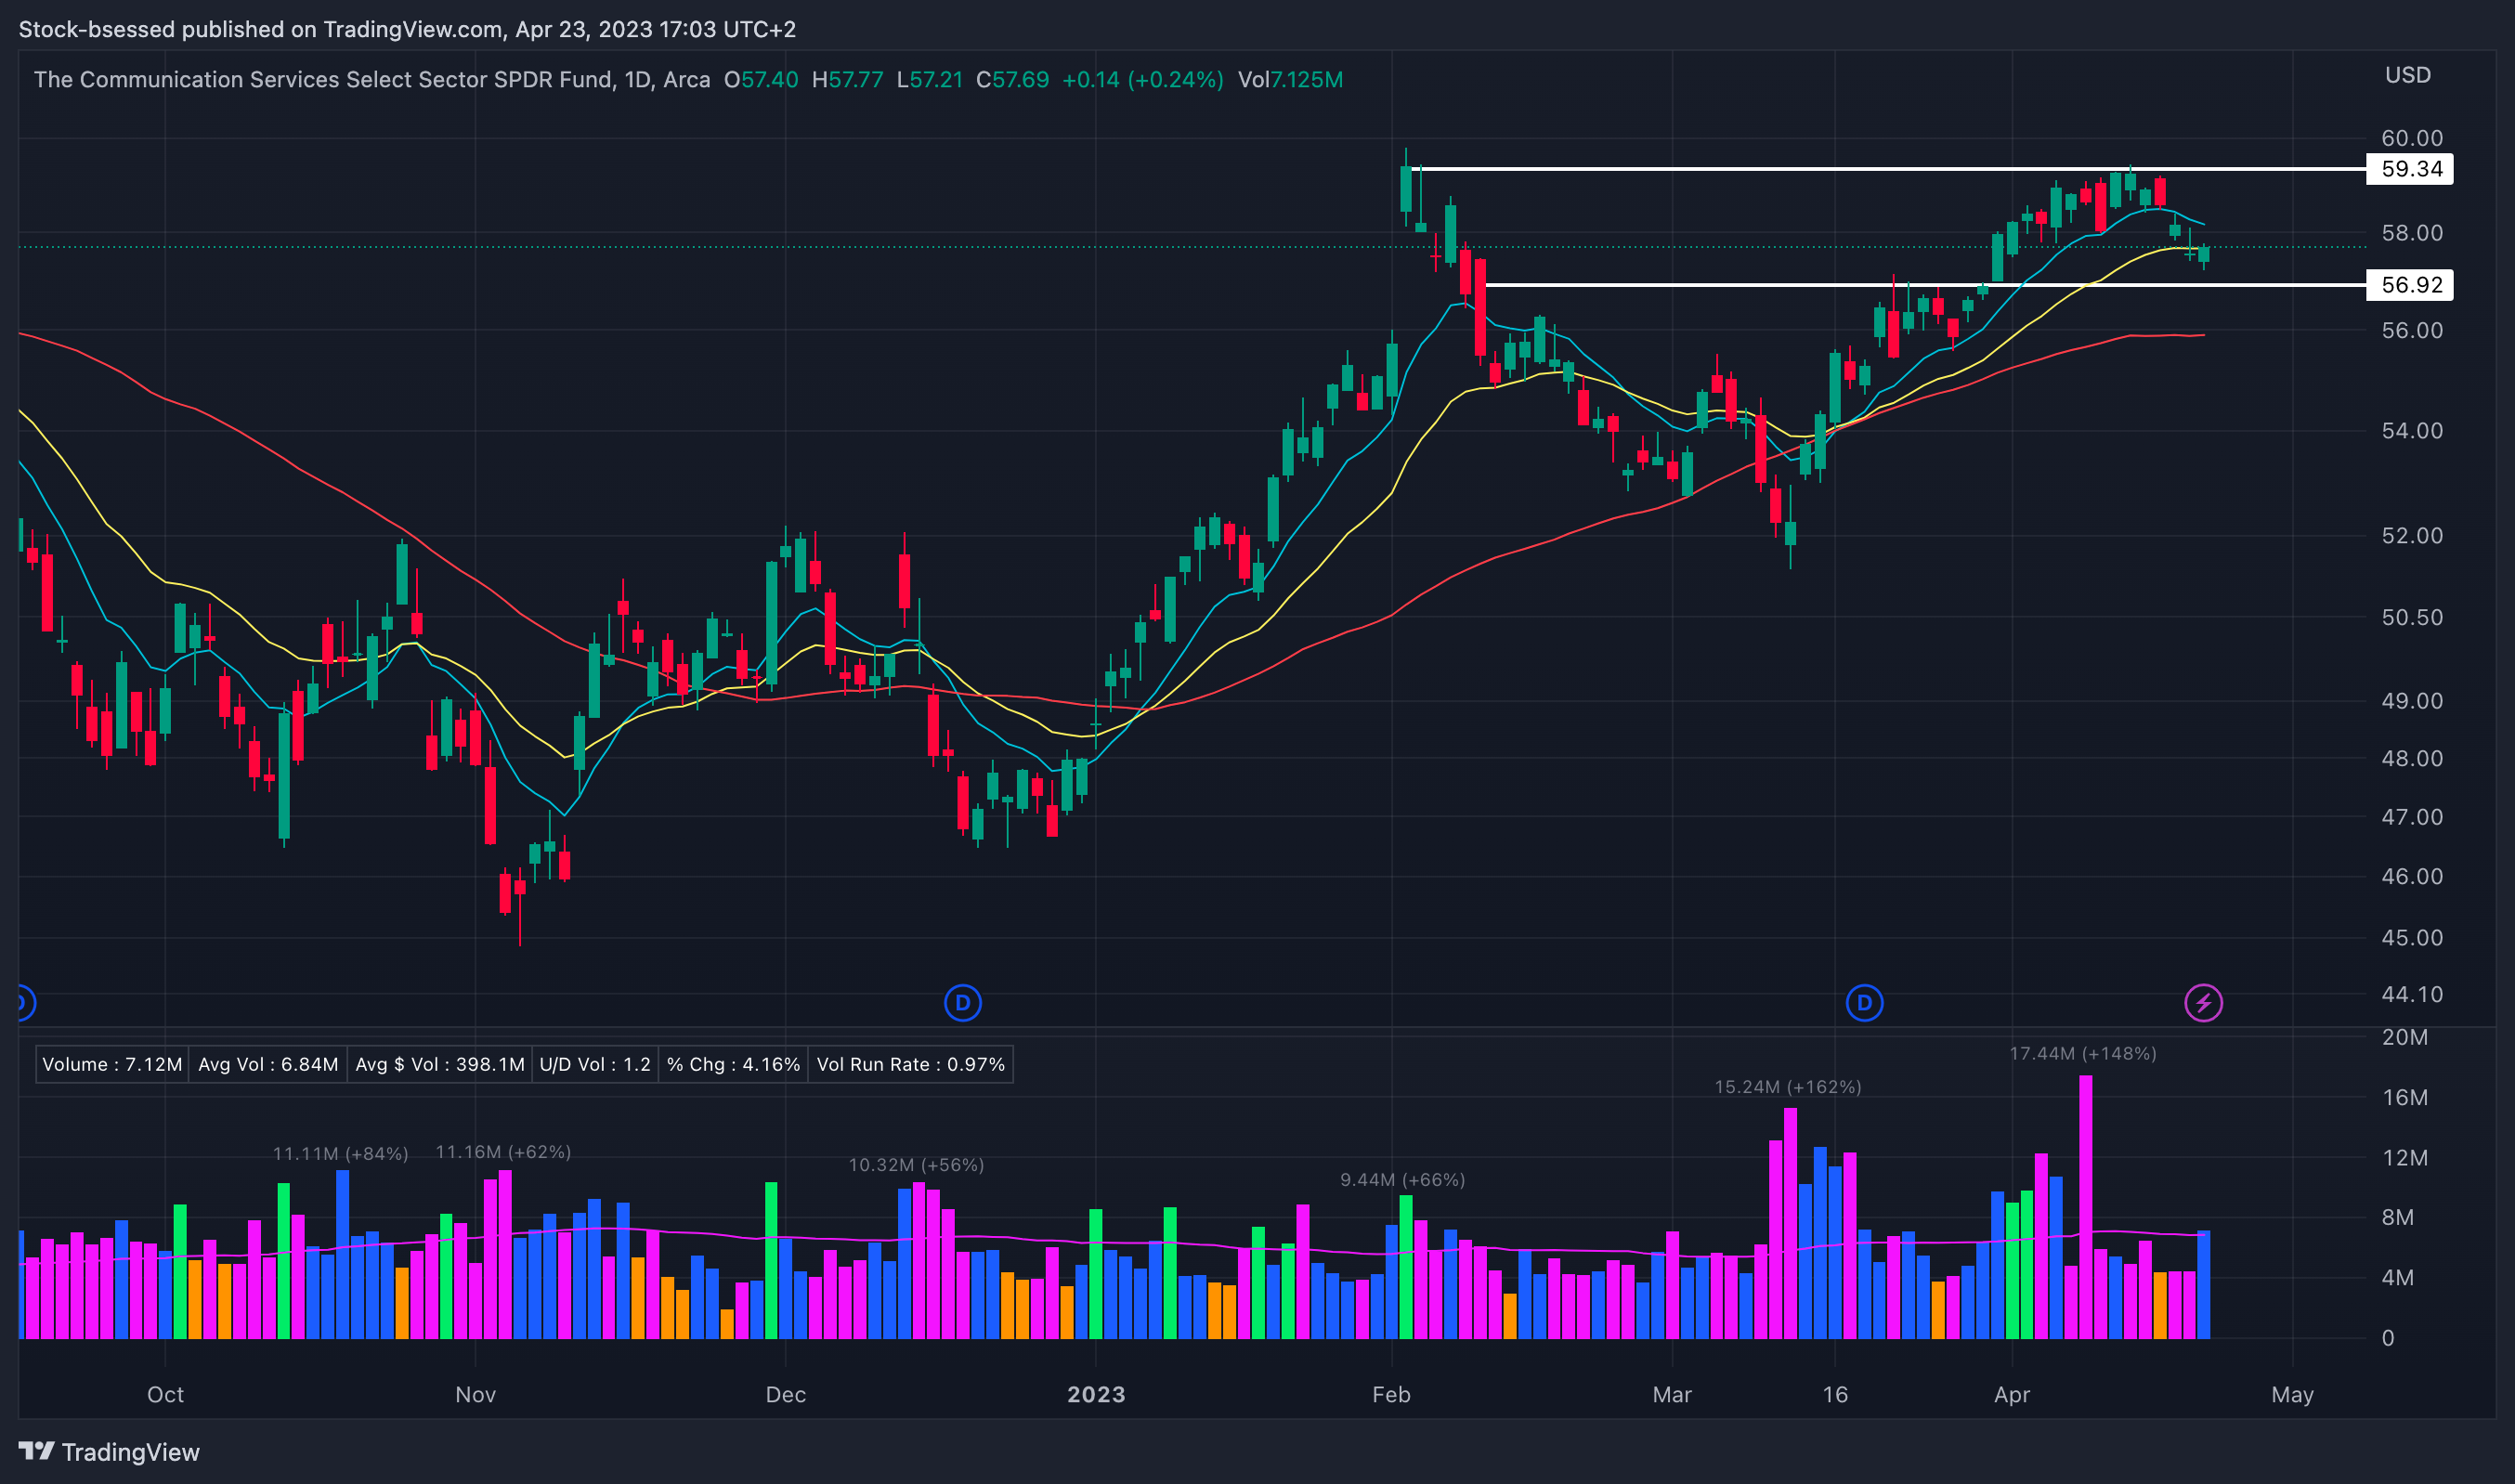
XLC 0.00%↑ Remains range-bound as it consolidates between 2 clearly defined areas of importance:
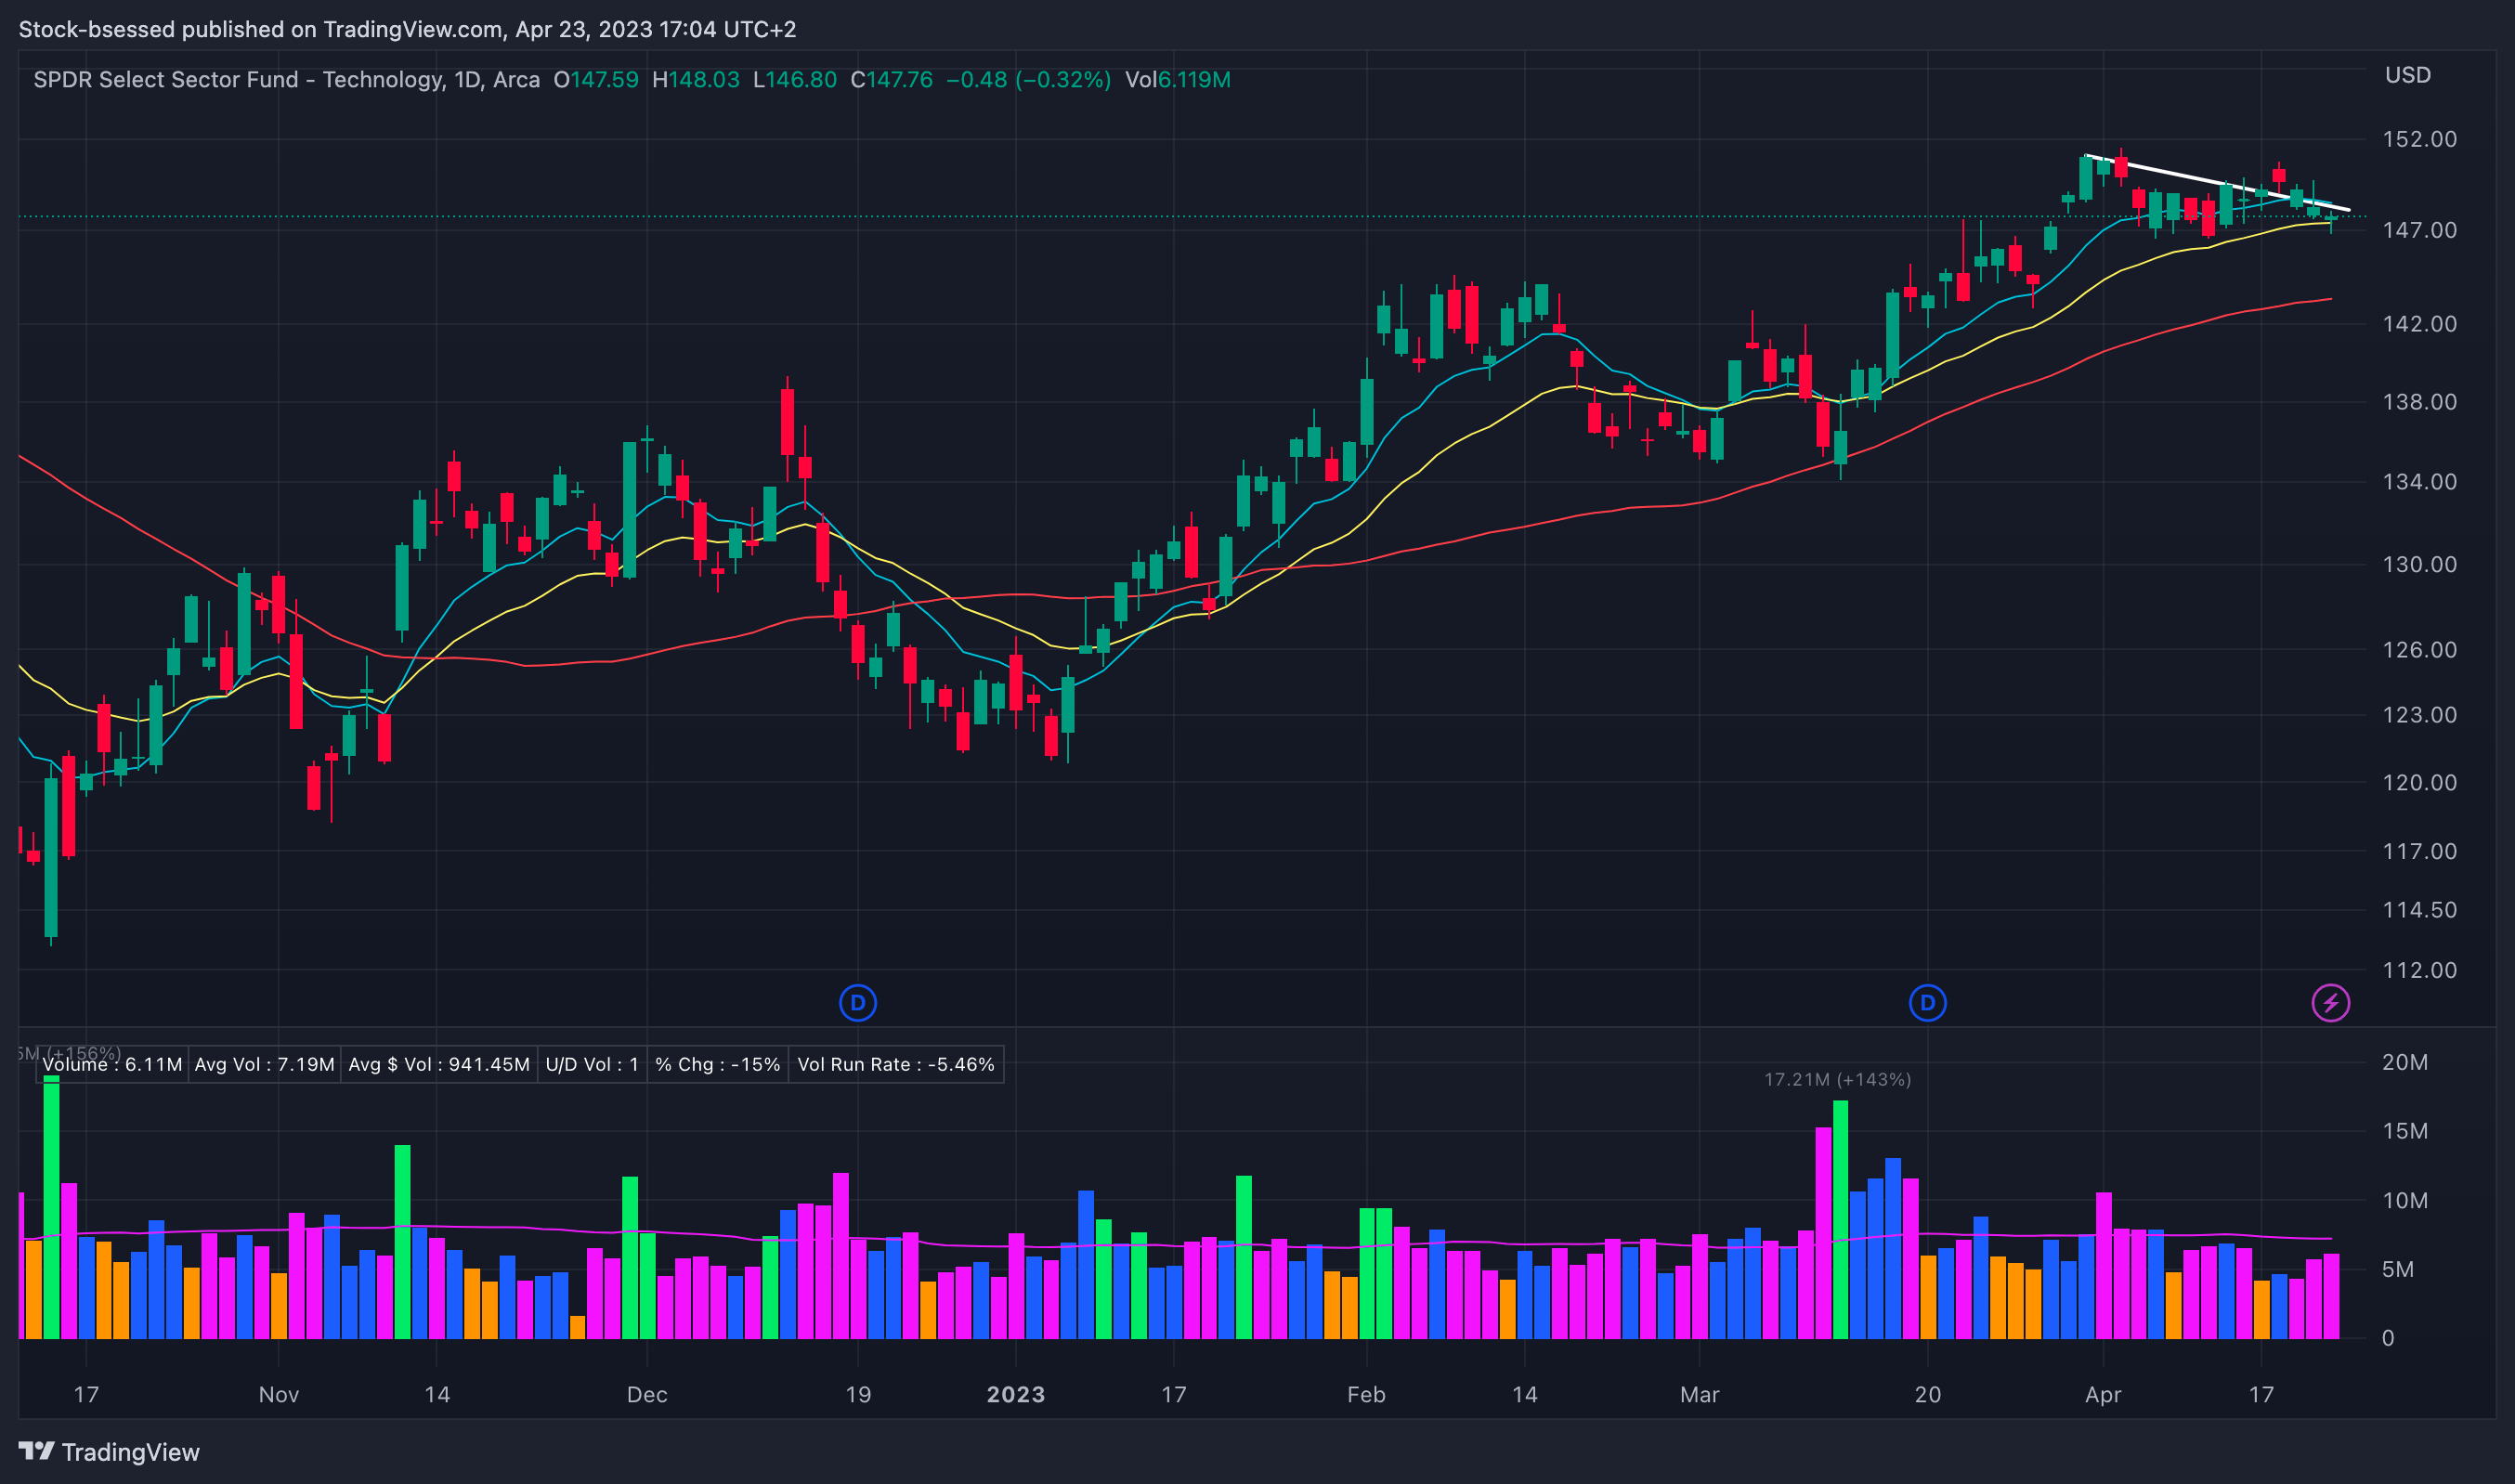
XLK 0.00%↑ Really like how intra-day weakness was bought up less session with an encouraging undercut and rally of the 20EMA to close above and strong on the session. Now flagging nicely below its descending trend line:
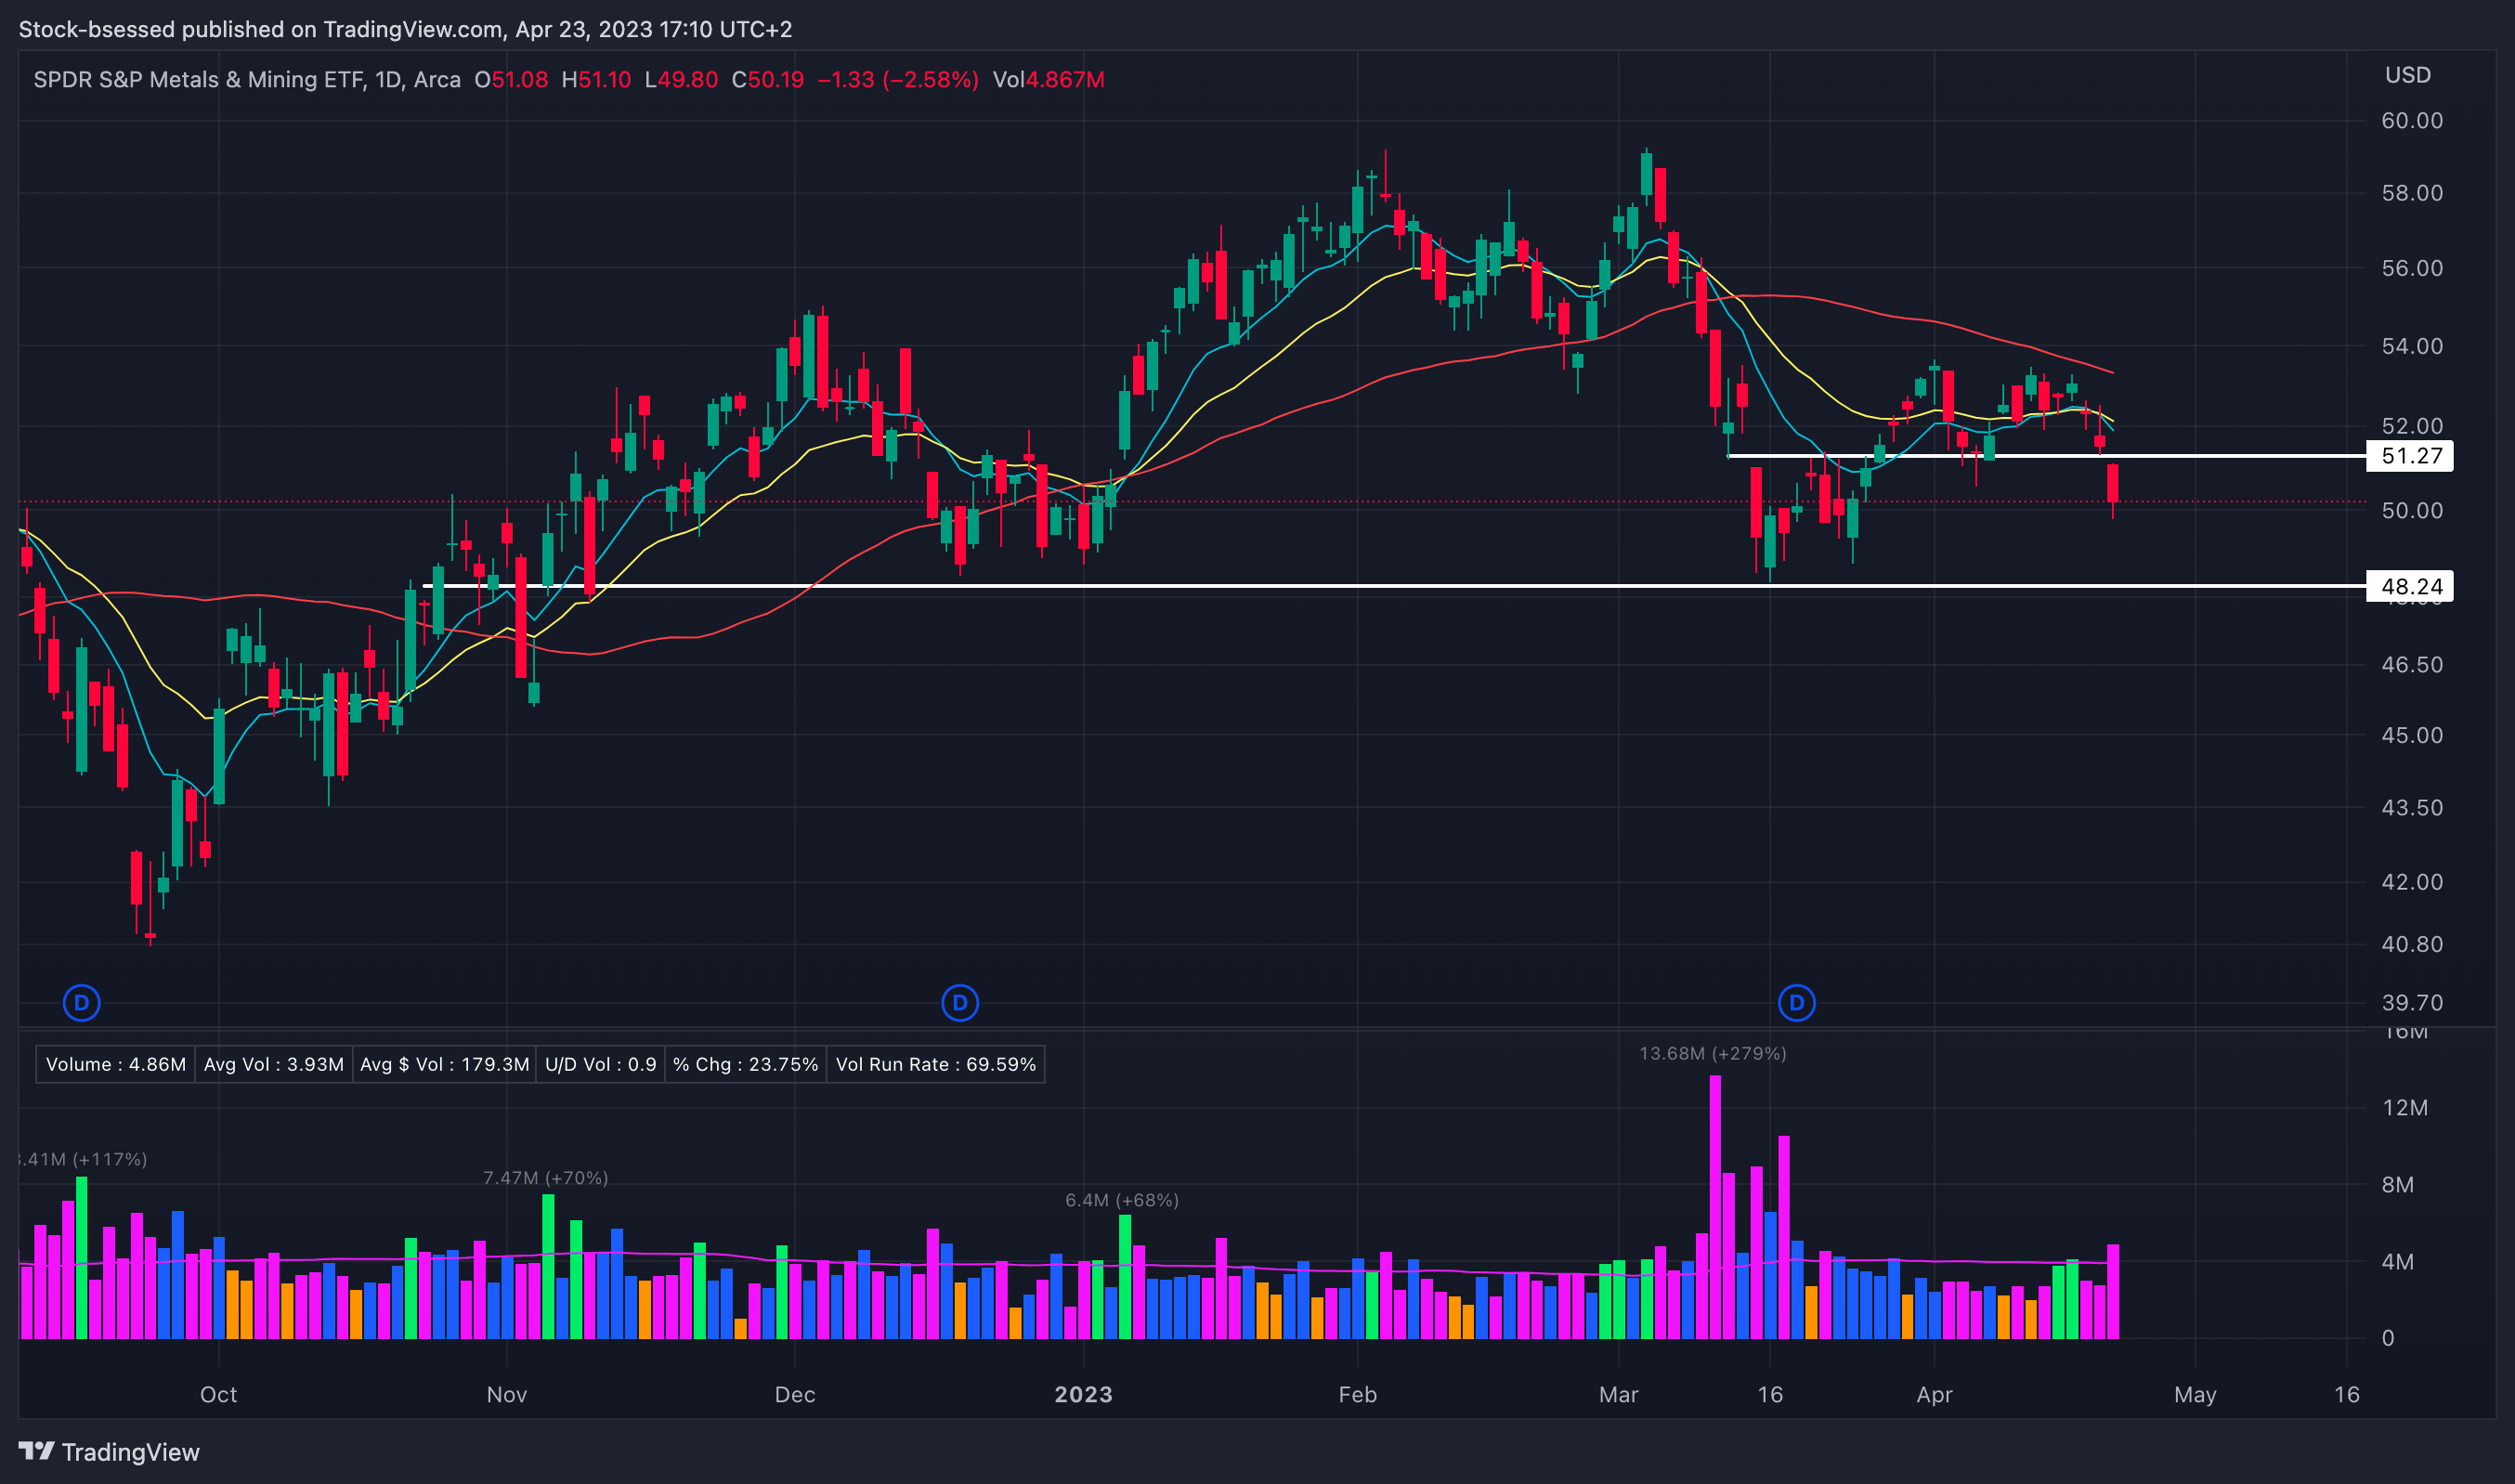
XME 0.00%↑ Selling picked up here on volume with a gap-down and close below this key area around 51:
Weekly:

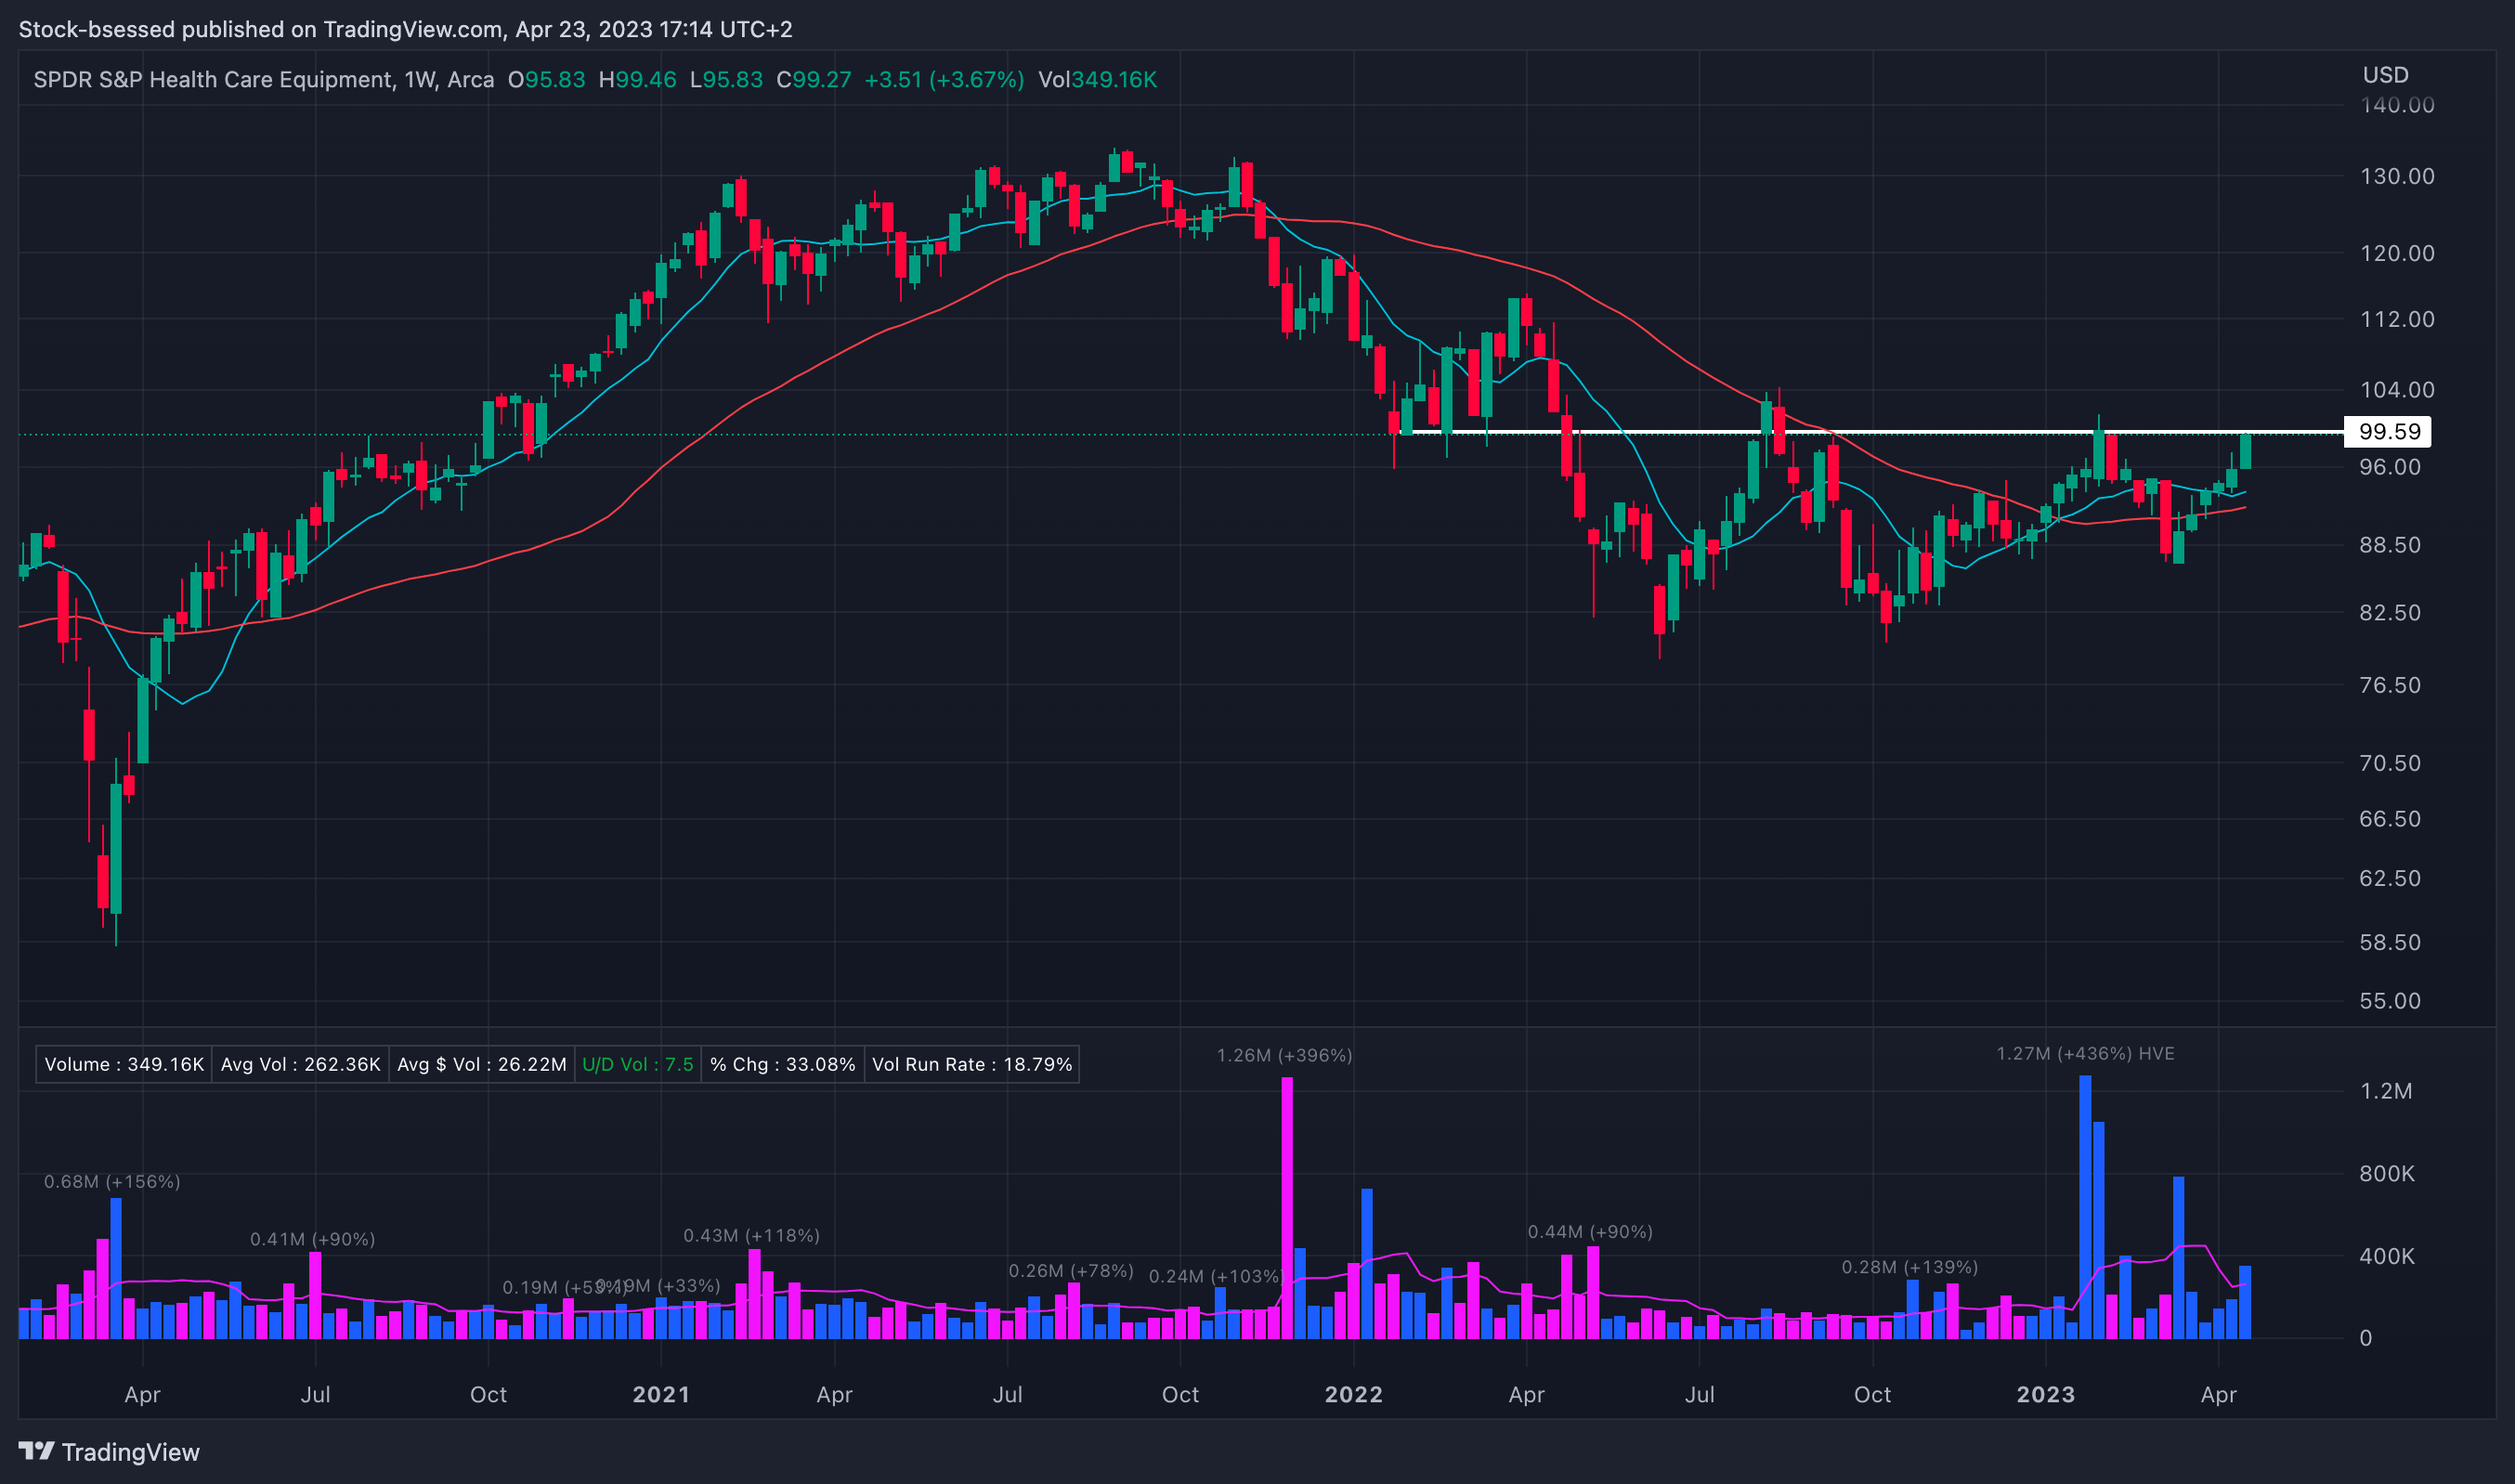
XHE 0.00%↑ Back to this key spot on the weekly right below the 100 level:
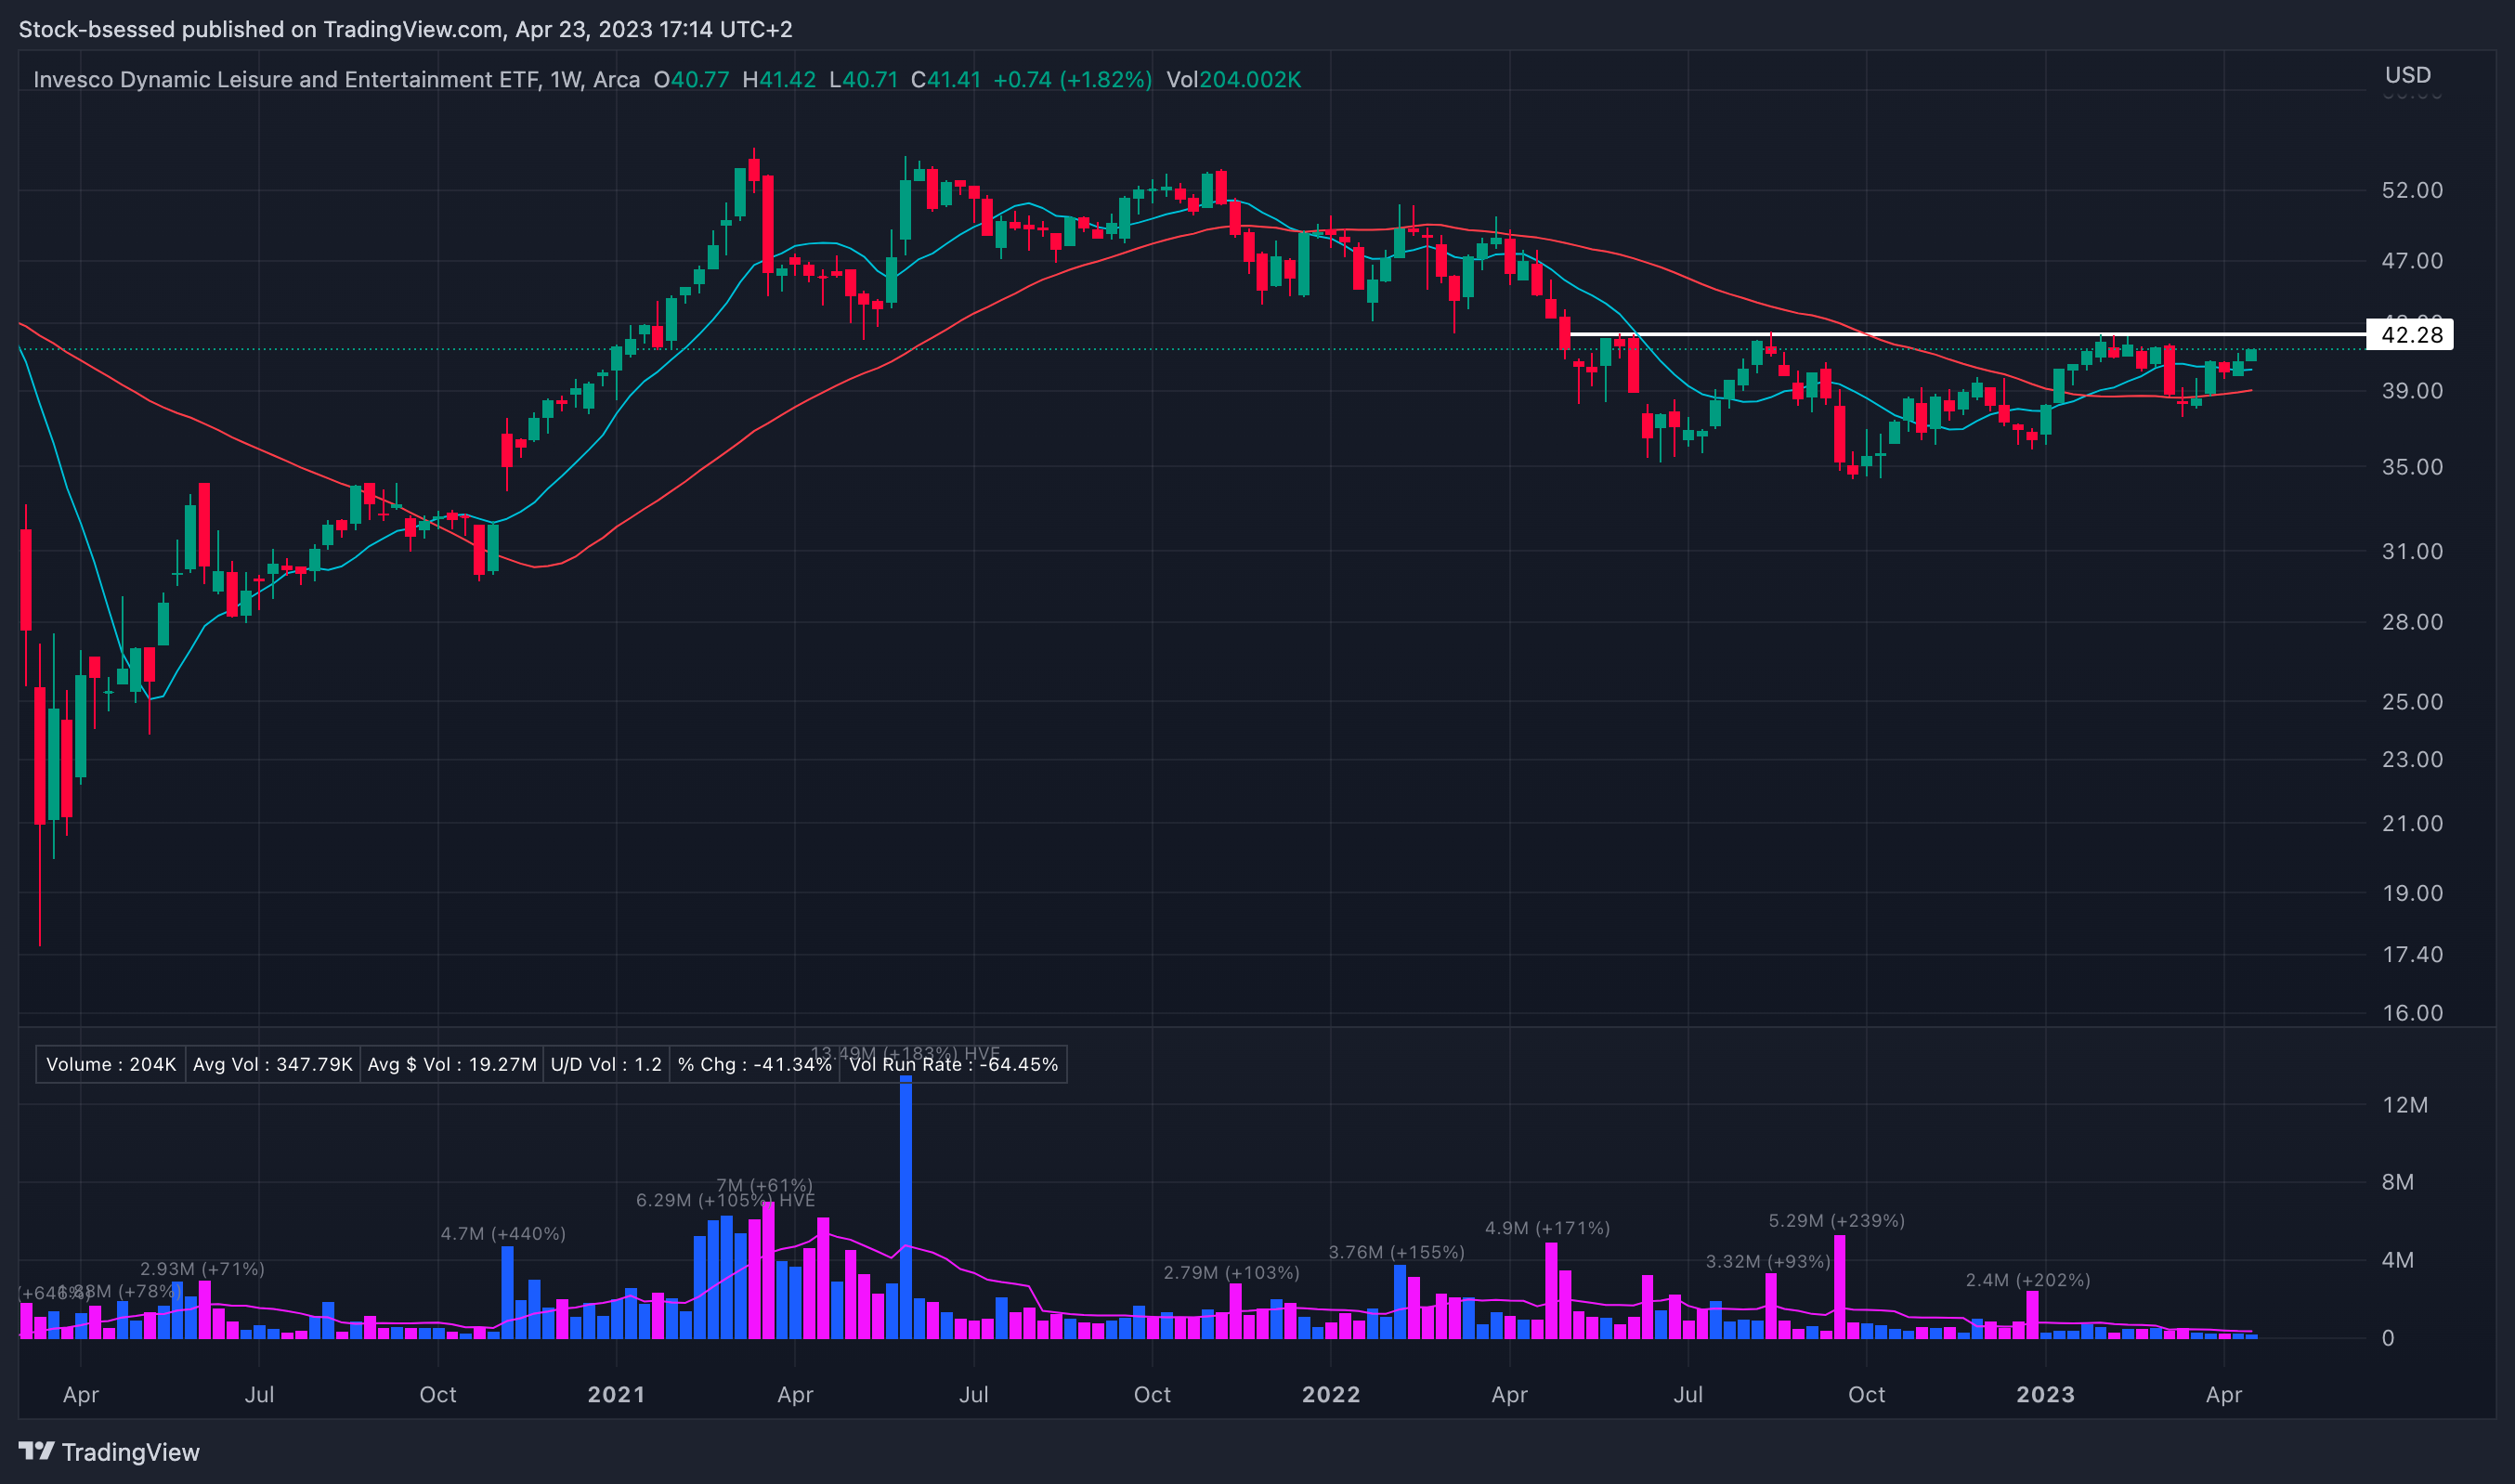
PEJ 0.00%↑ Forming a nice long base that has been consolidating since May 2022 - will be watching for this to take out the ~42.3 area on strength:
TAN 0.00%↑ Has been trying to push upwards with higher lows and now consolidating below this important ~79.50 area:

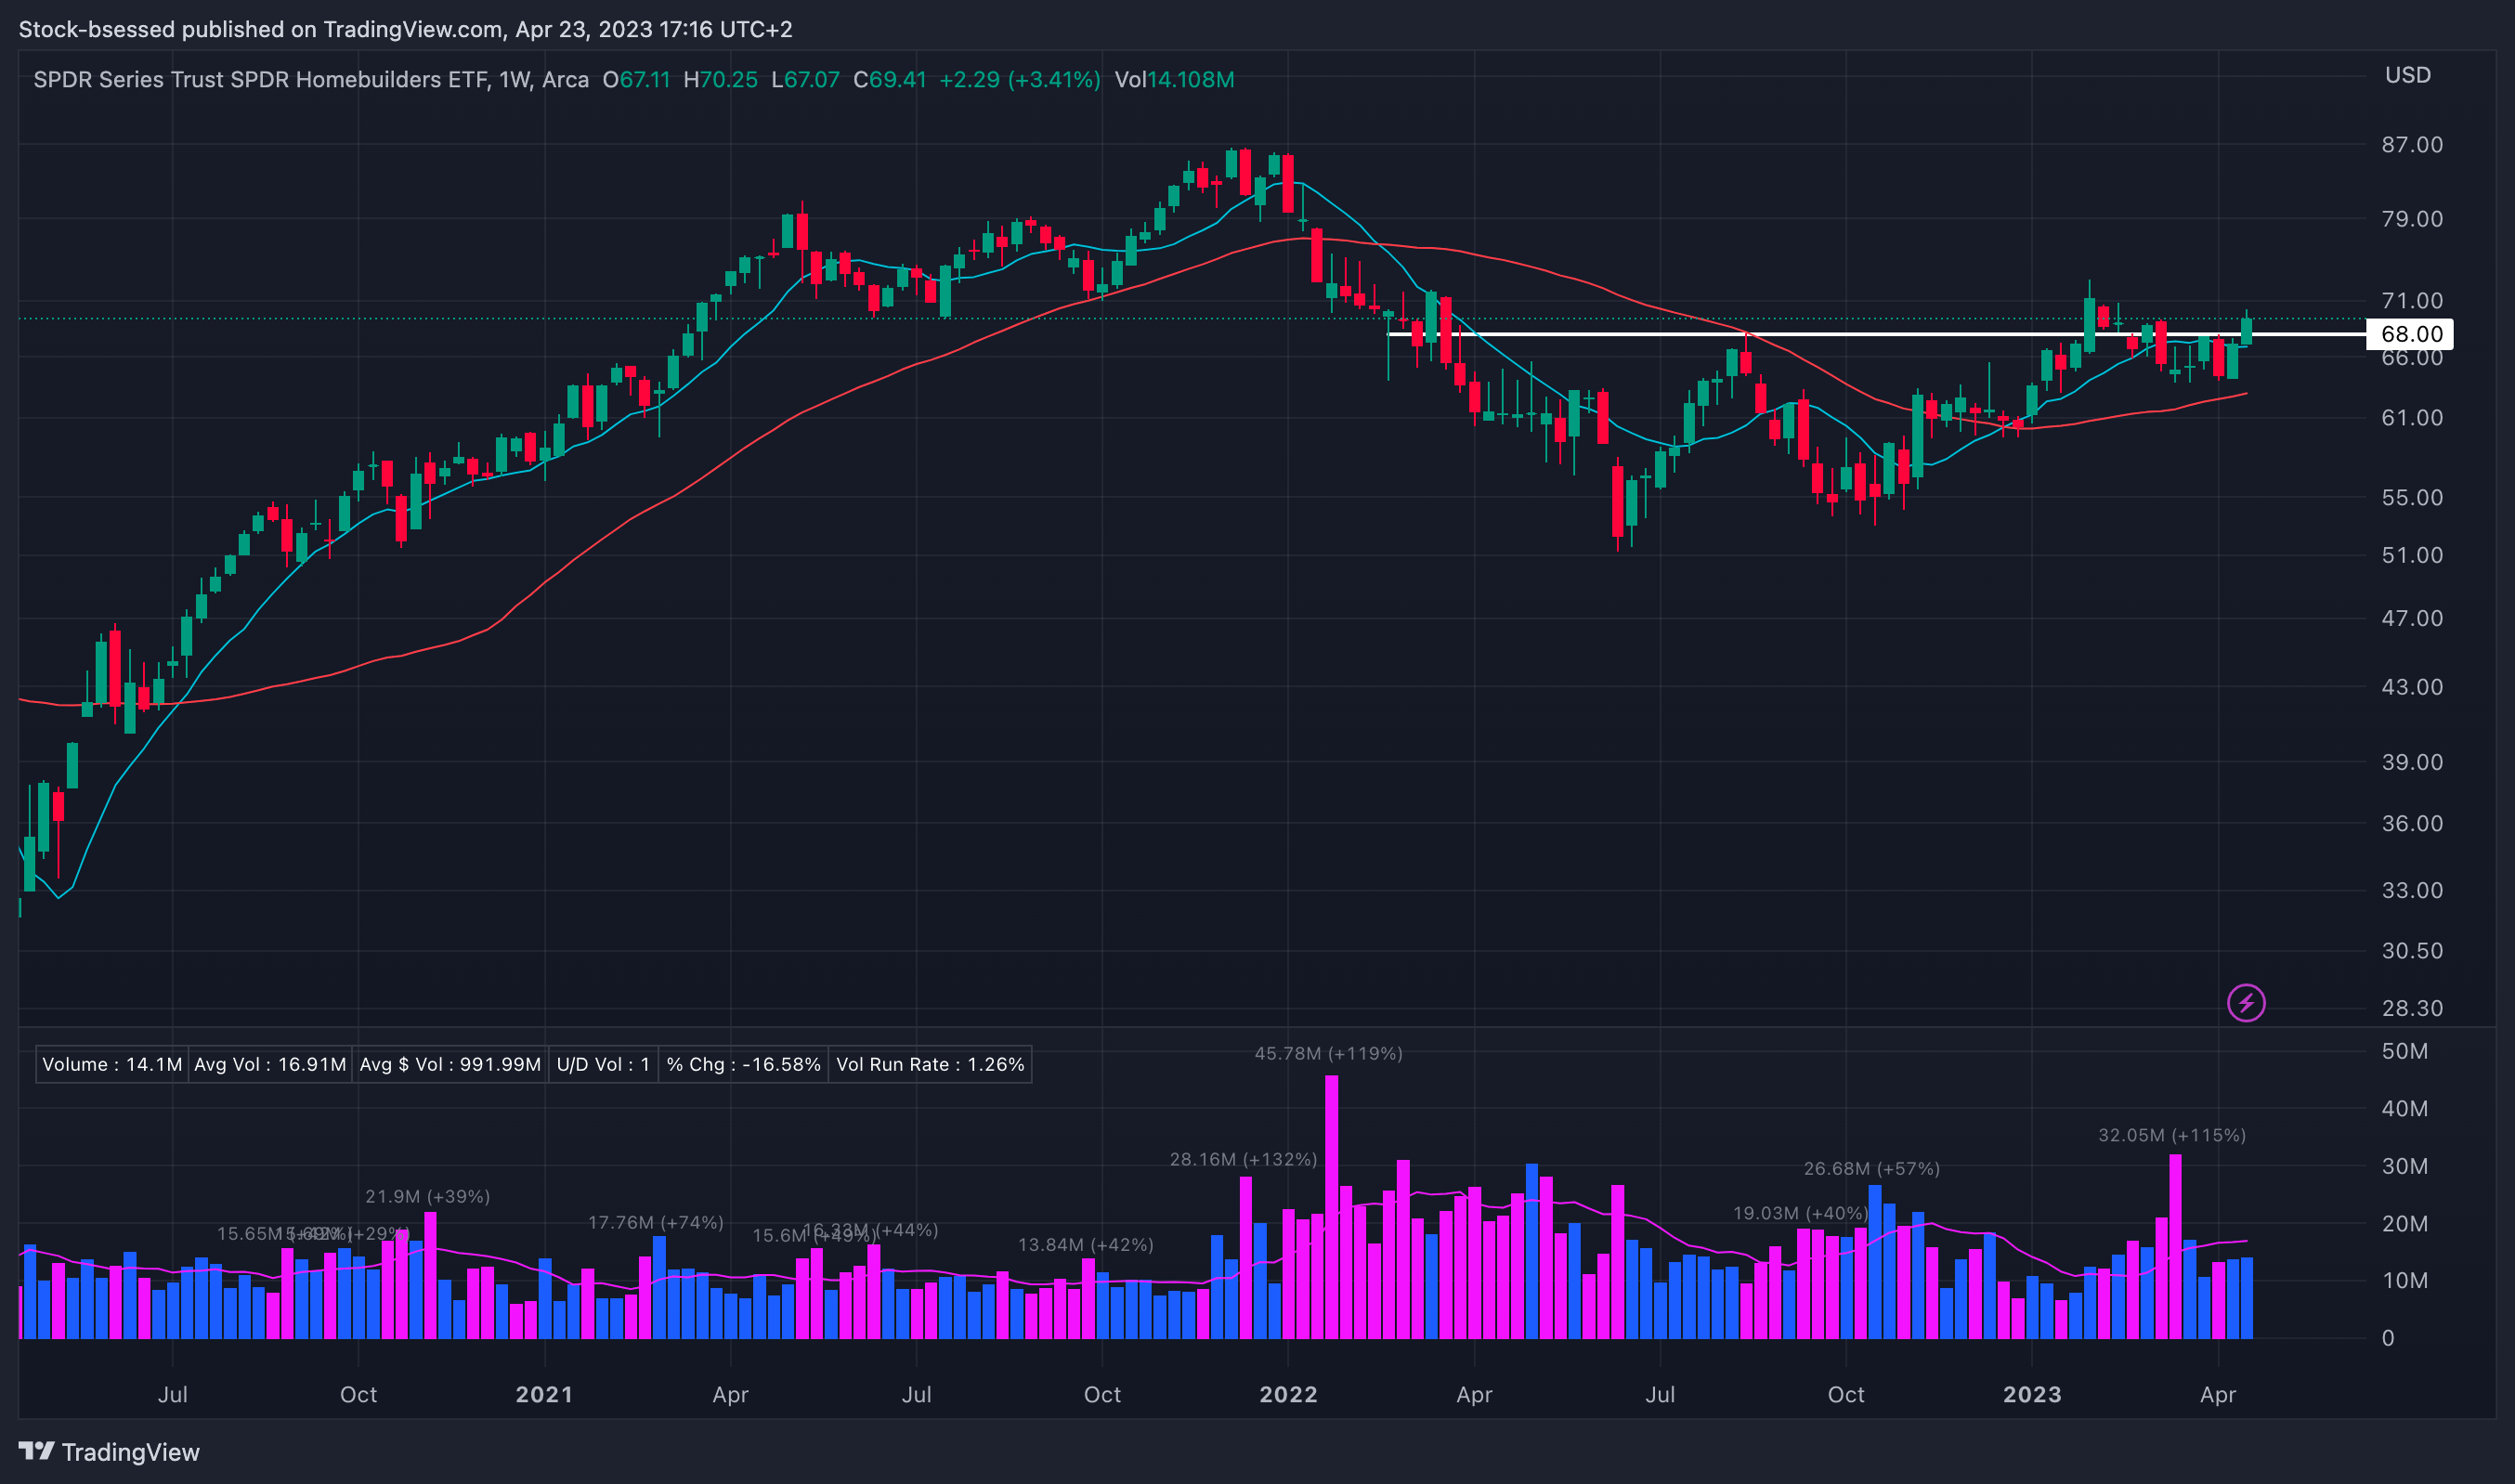
XHB 0.00%↑ Homebuilders have been strong and showed some good action last week to push and close above the key 68 area:
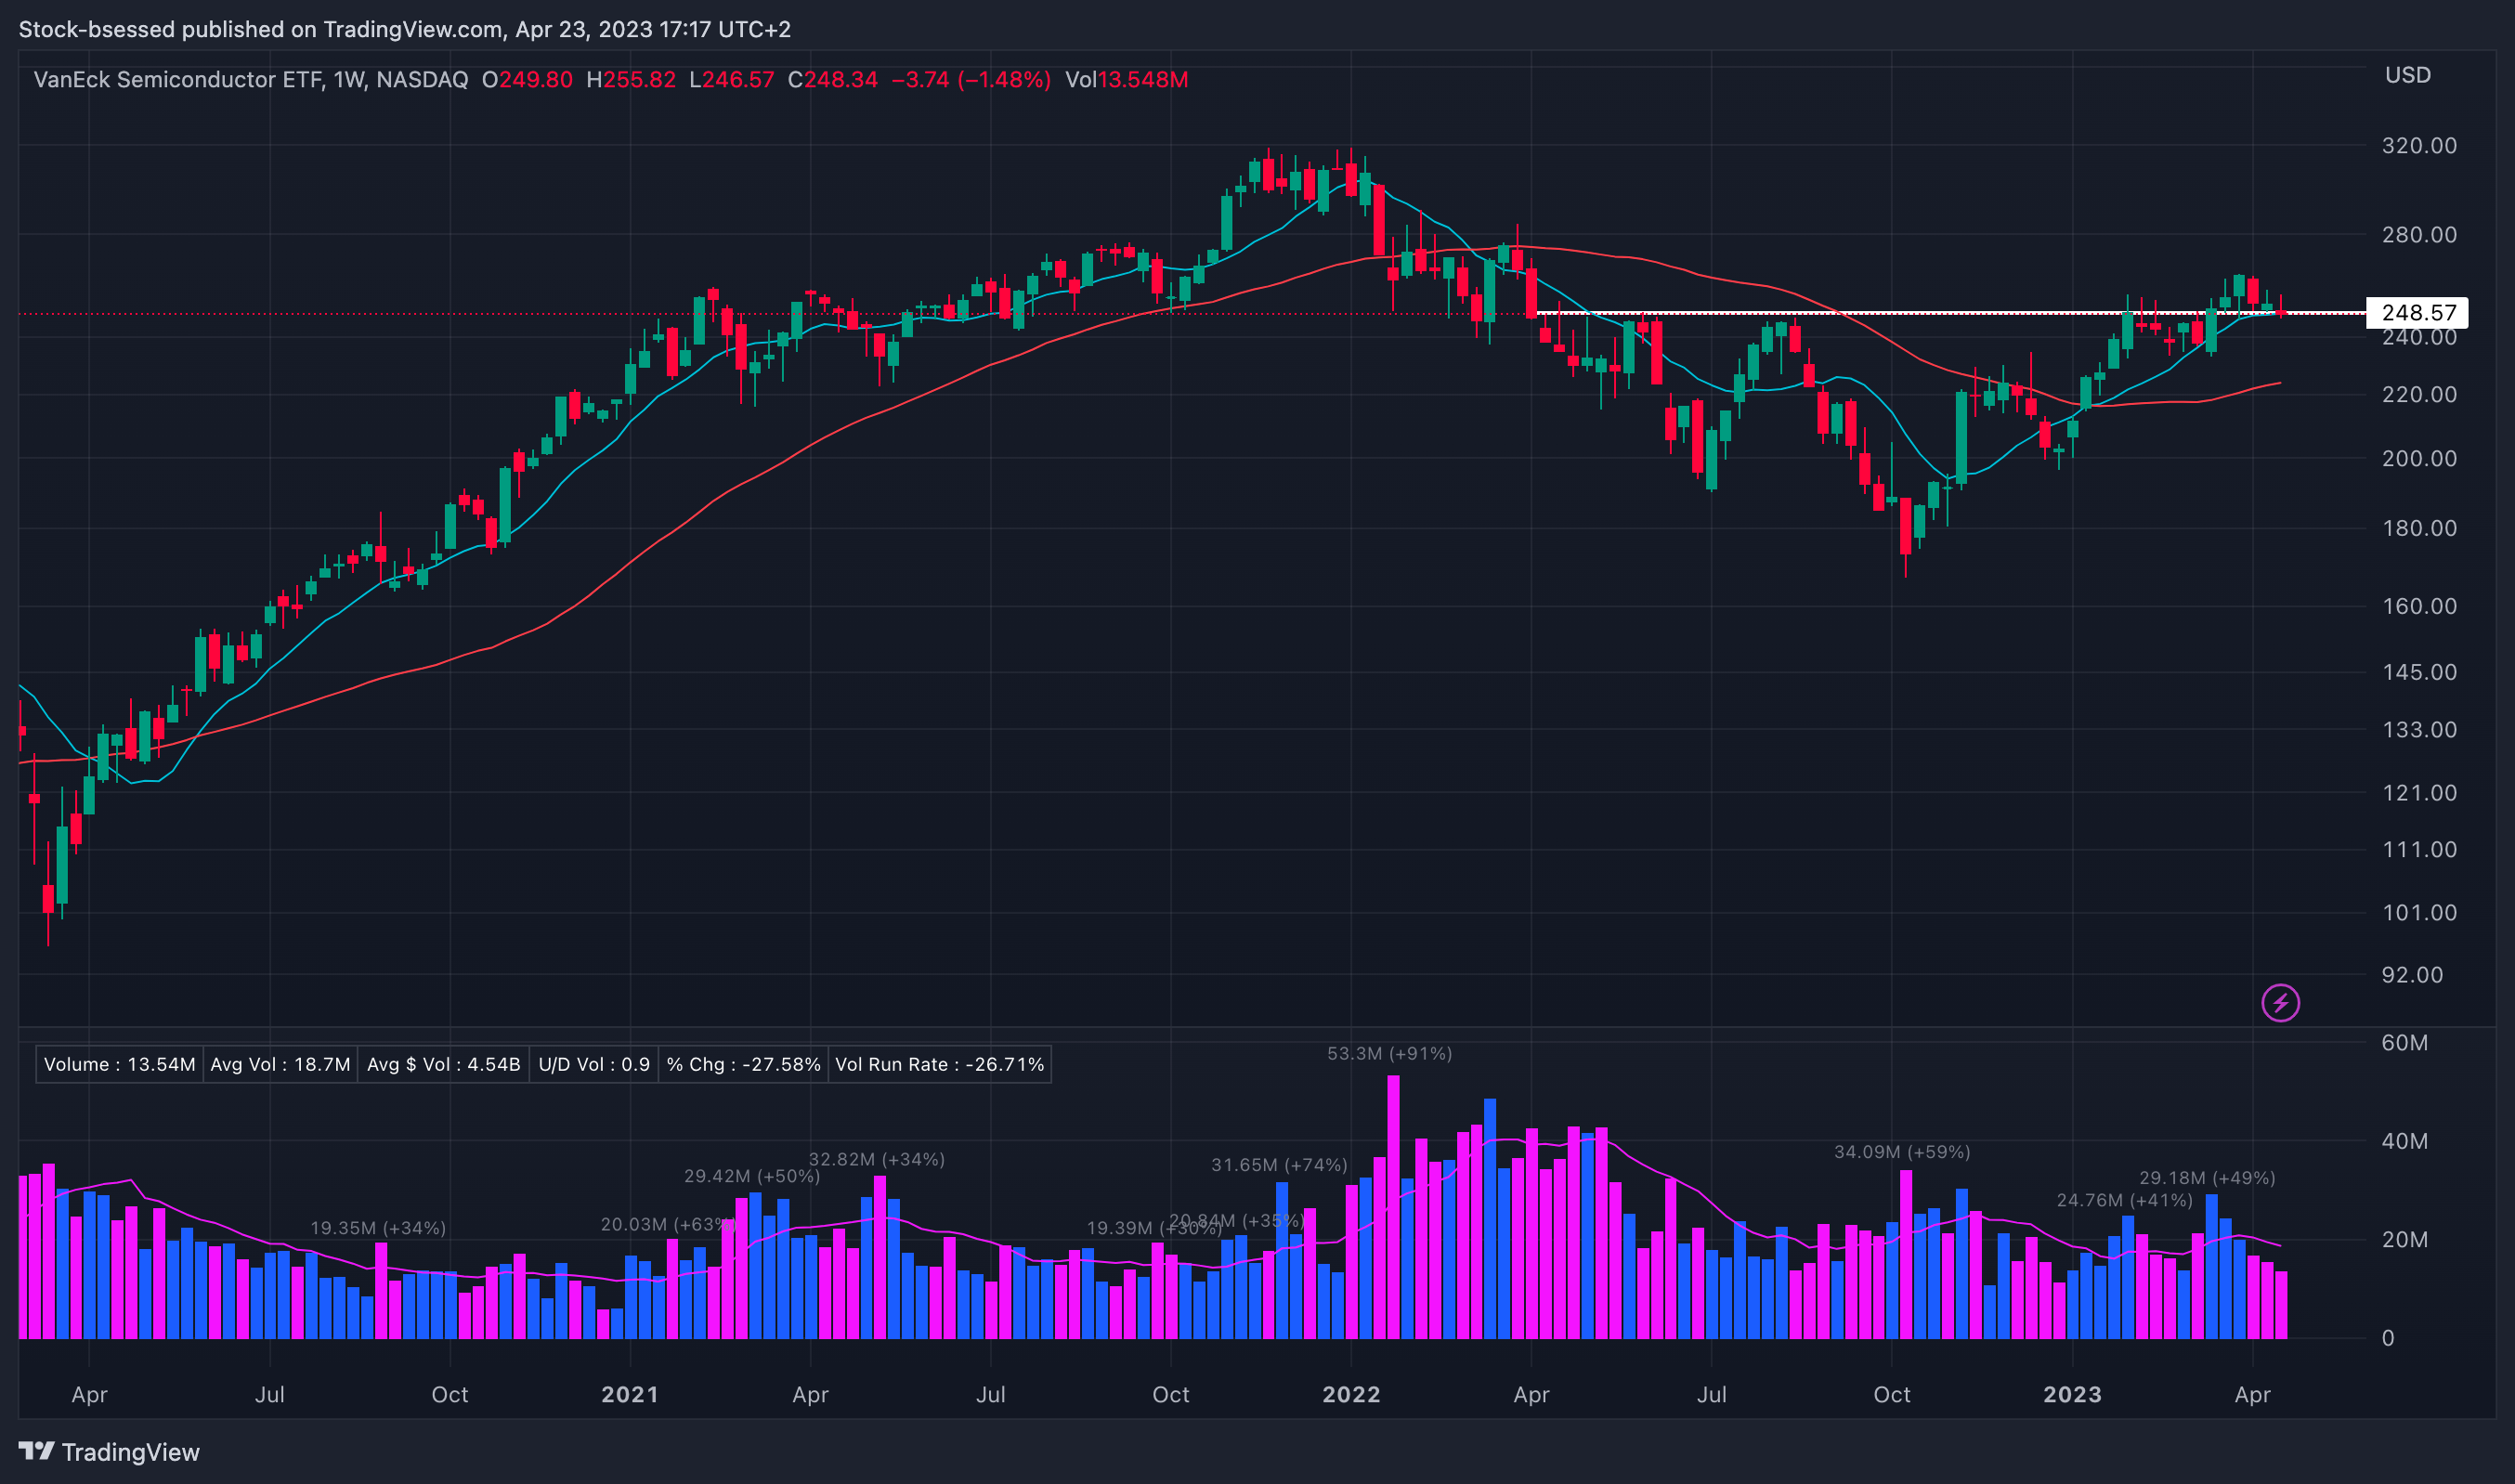
SMH 0.00%↑ Have been watching the 248.50 area as the line in the sand for some time now and this did close just below. If buyers able to quickly push up off this area that would be encouraging but failure to hold this area could indicate further weakness:
Scans
52 Week highs

9 Million breakout
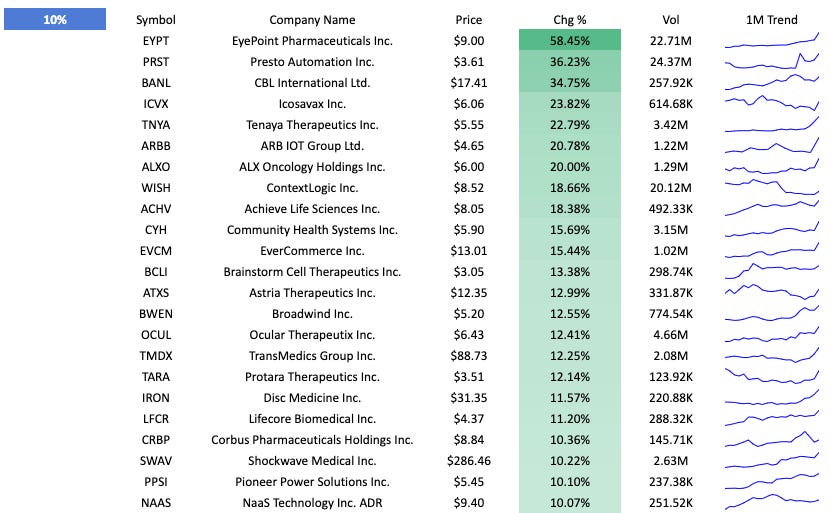
+10% Breakout
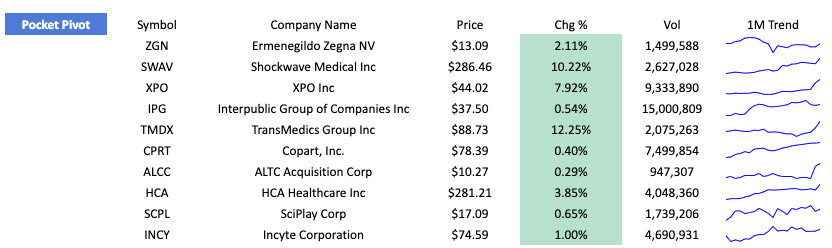
Pocket Pivot
Personal Portfolio Update
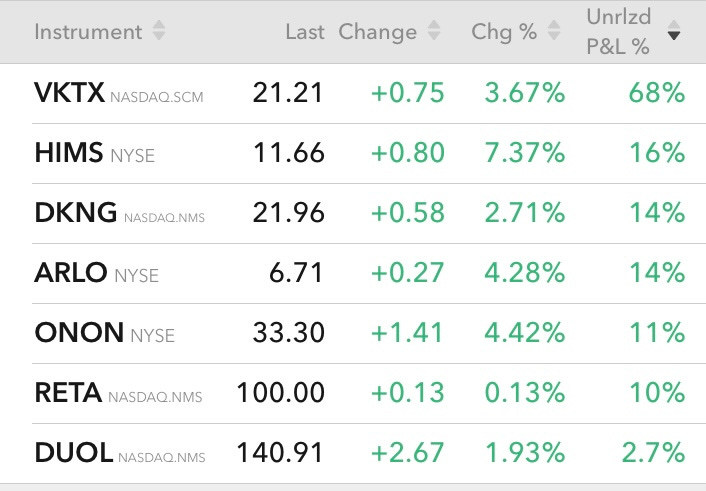
Open positions:
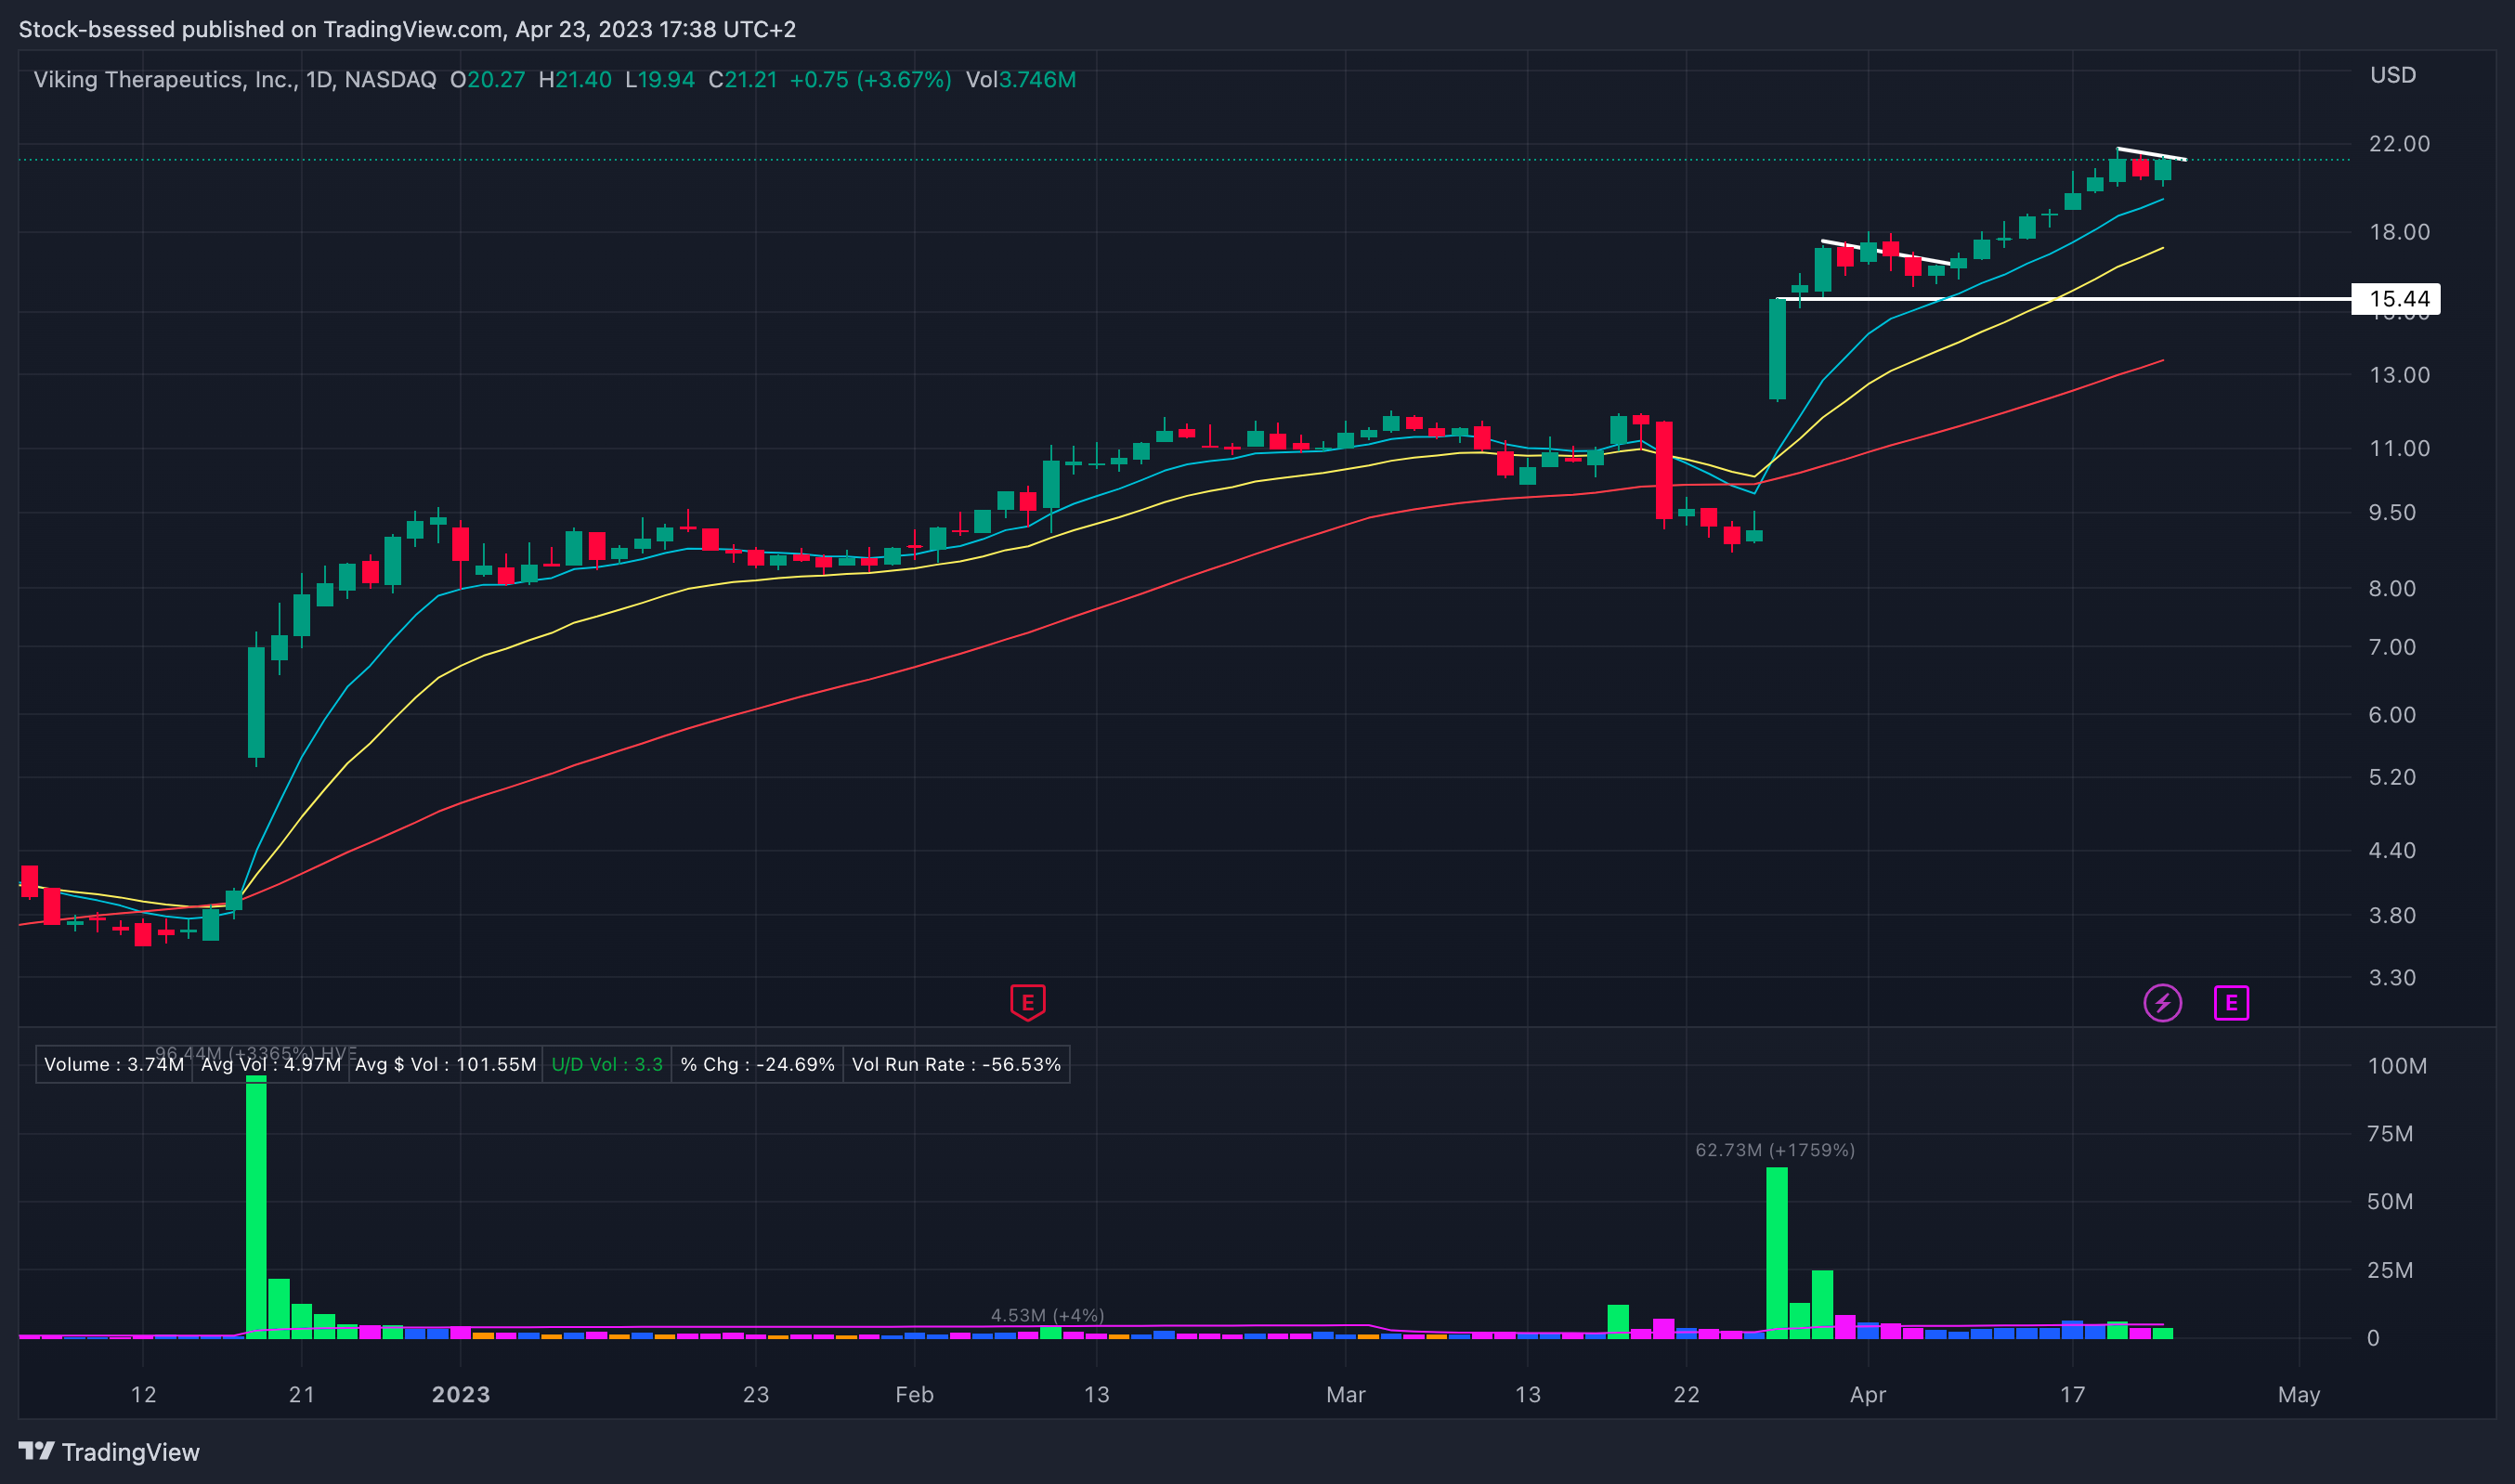
VKTX 0.00%↑ By far my strongest position and easiest hold - bought the opening range breakout at 12.62 on the 28th March gap-up and has done nothing wrong since. I continue to trail my stop along with key moving averages while giving this the space to continue working well - seems to be flagging out once more at its highs here:
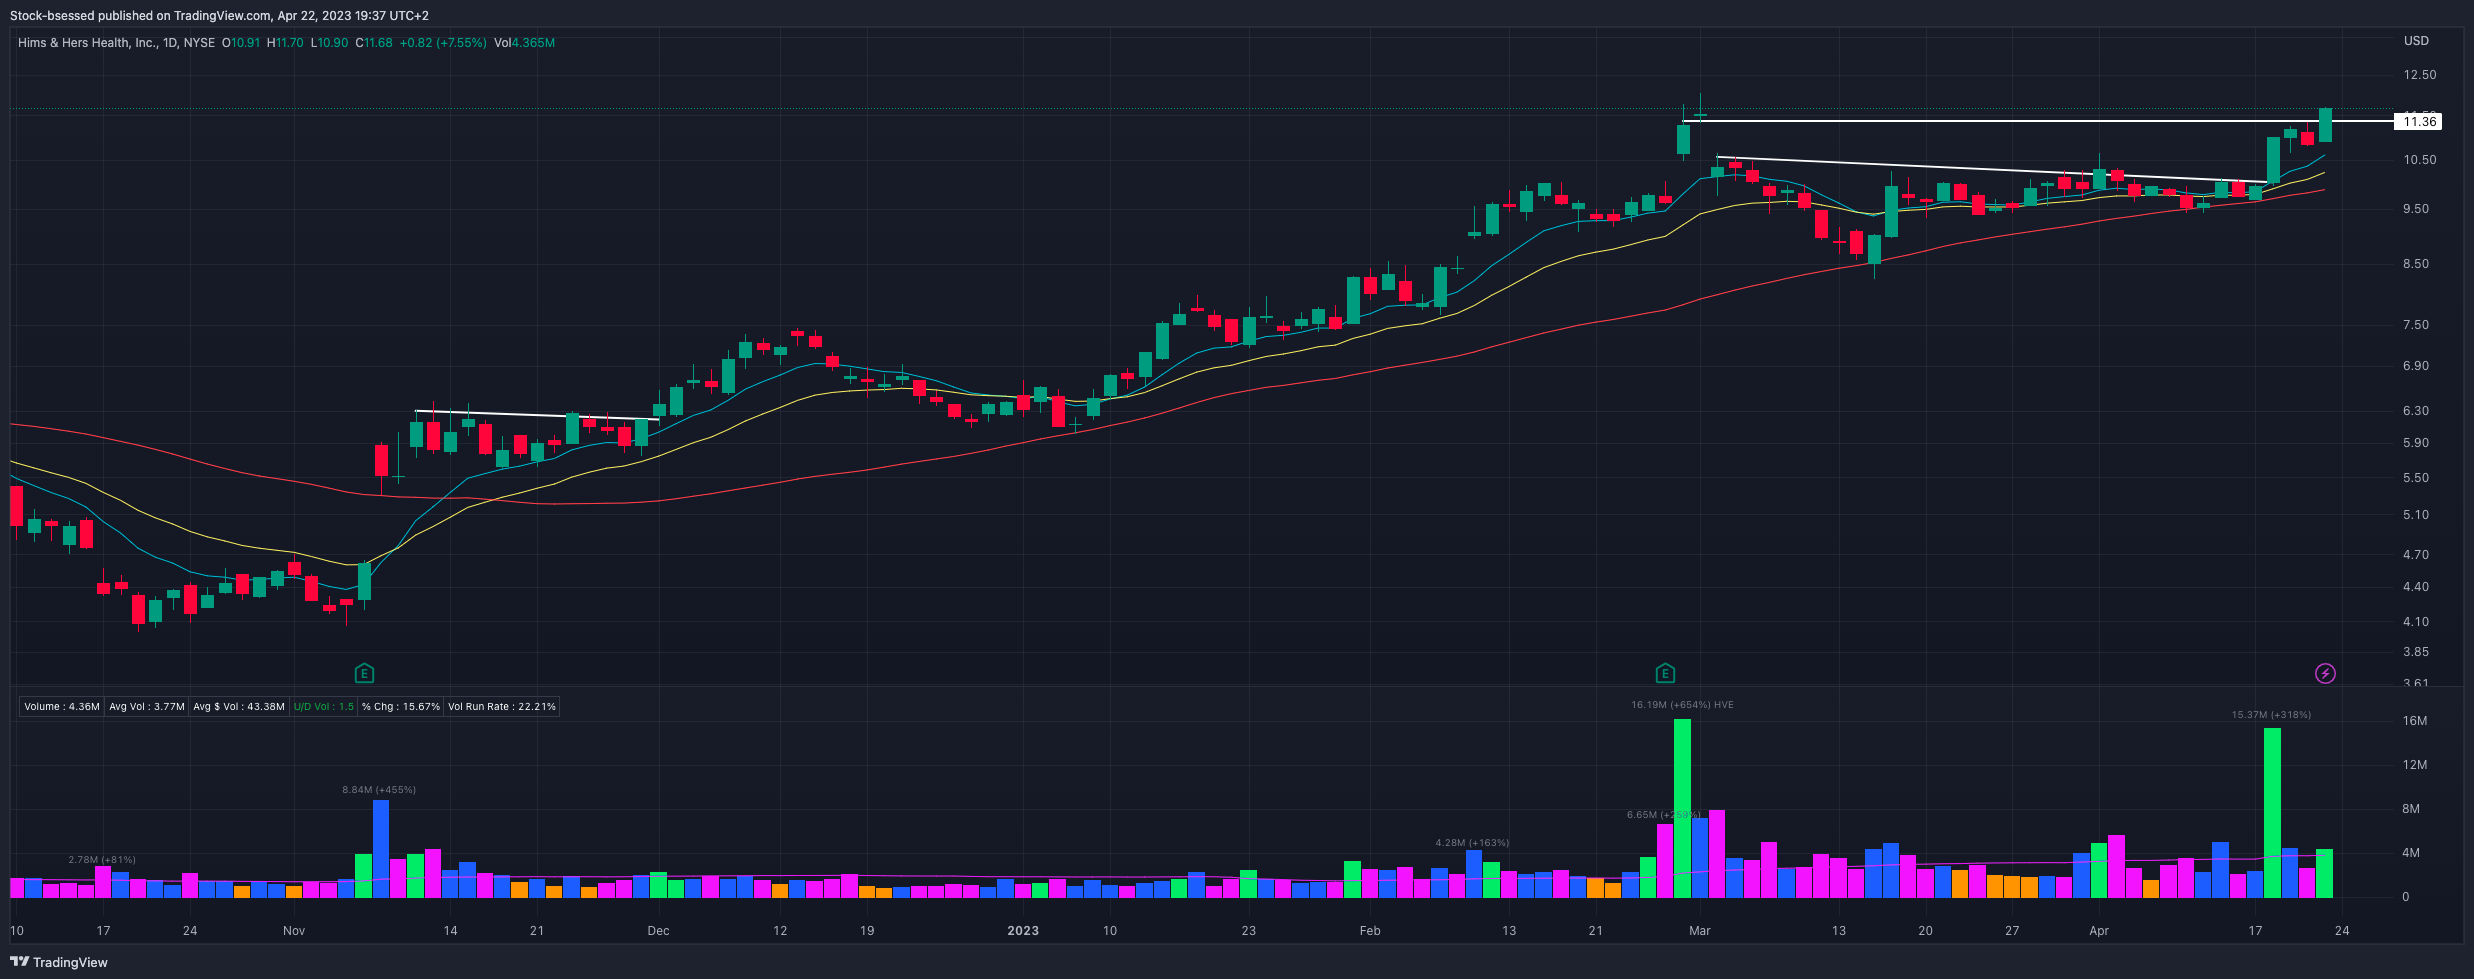
HIMS 0.00%↑ Bought this at 10.05 on its descending trend line breakout and has followed through very well. Couldn't keep this down for long and was able to push through 11.36 to close at the highest price since Mid-2021:
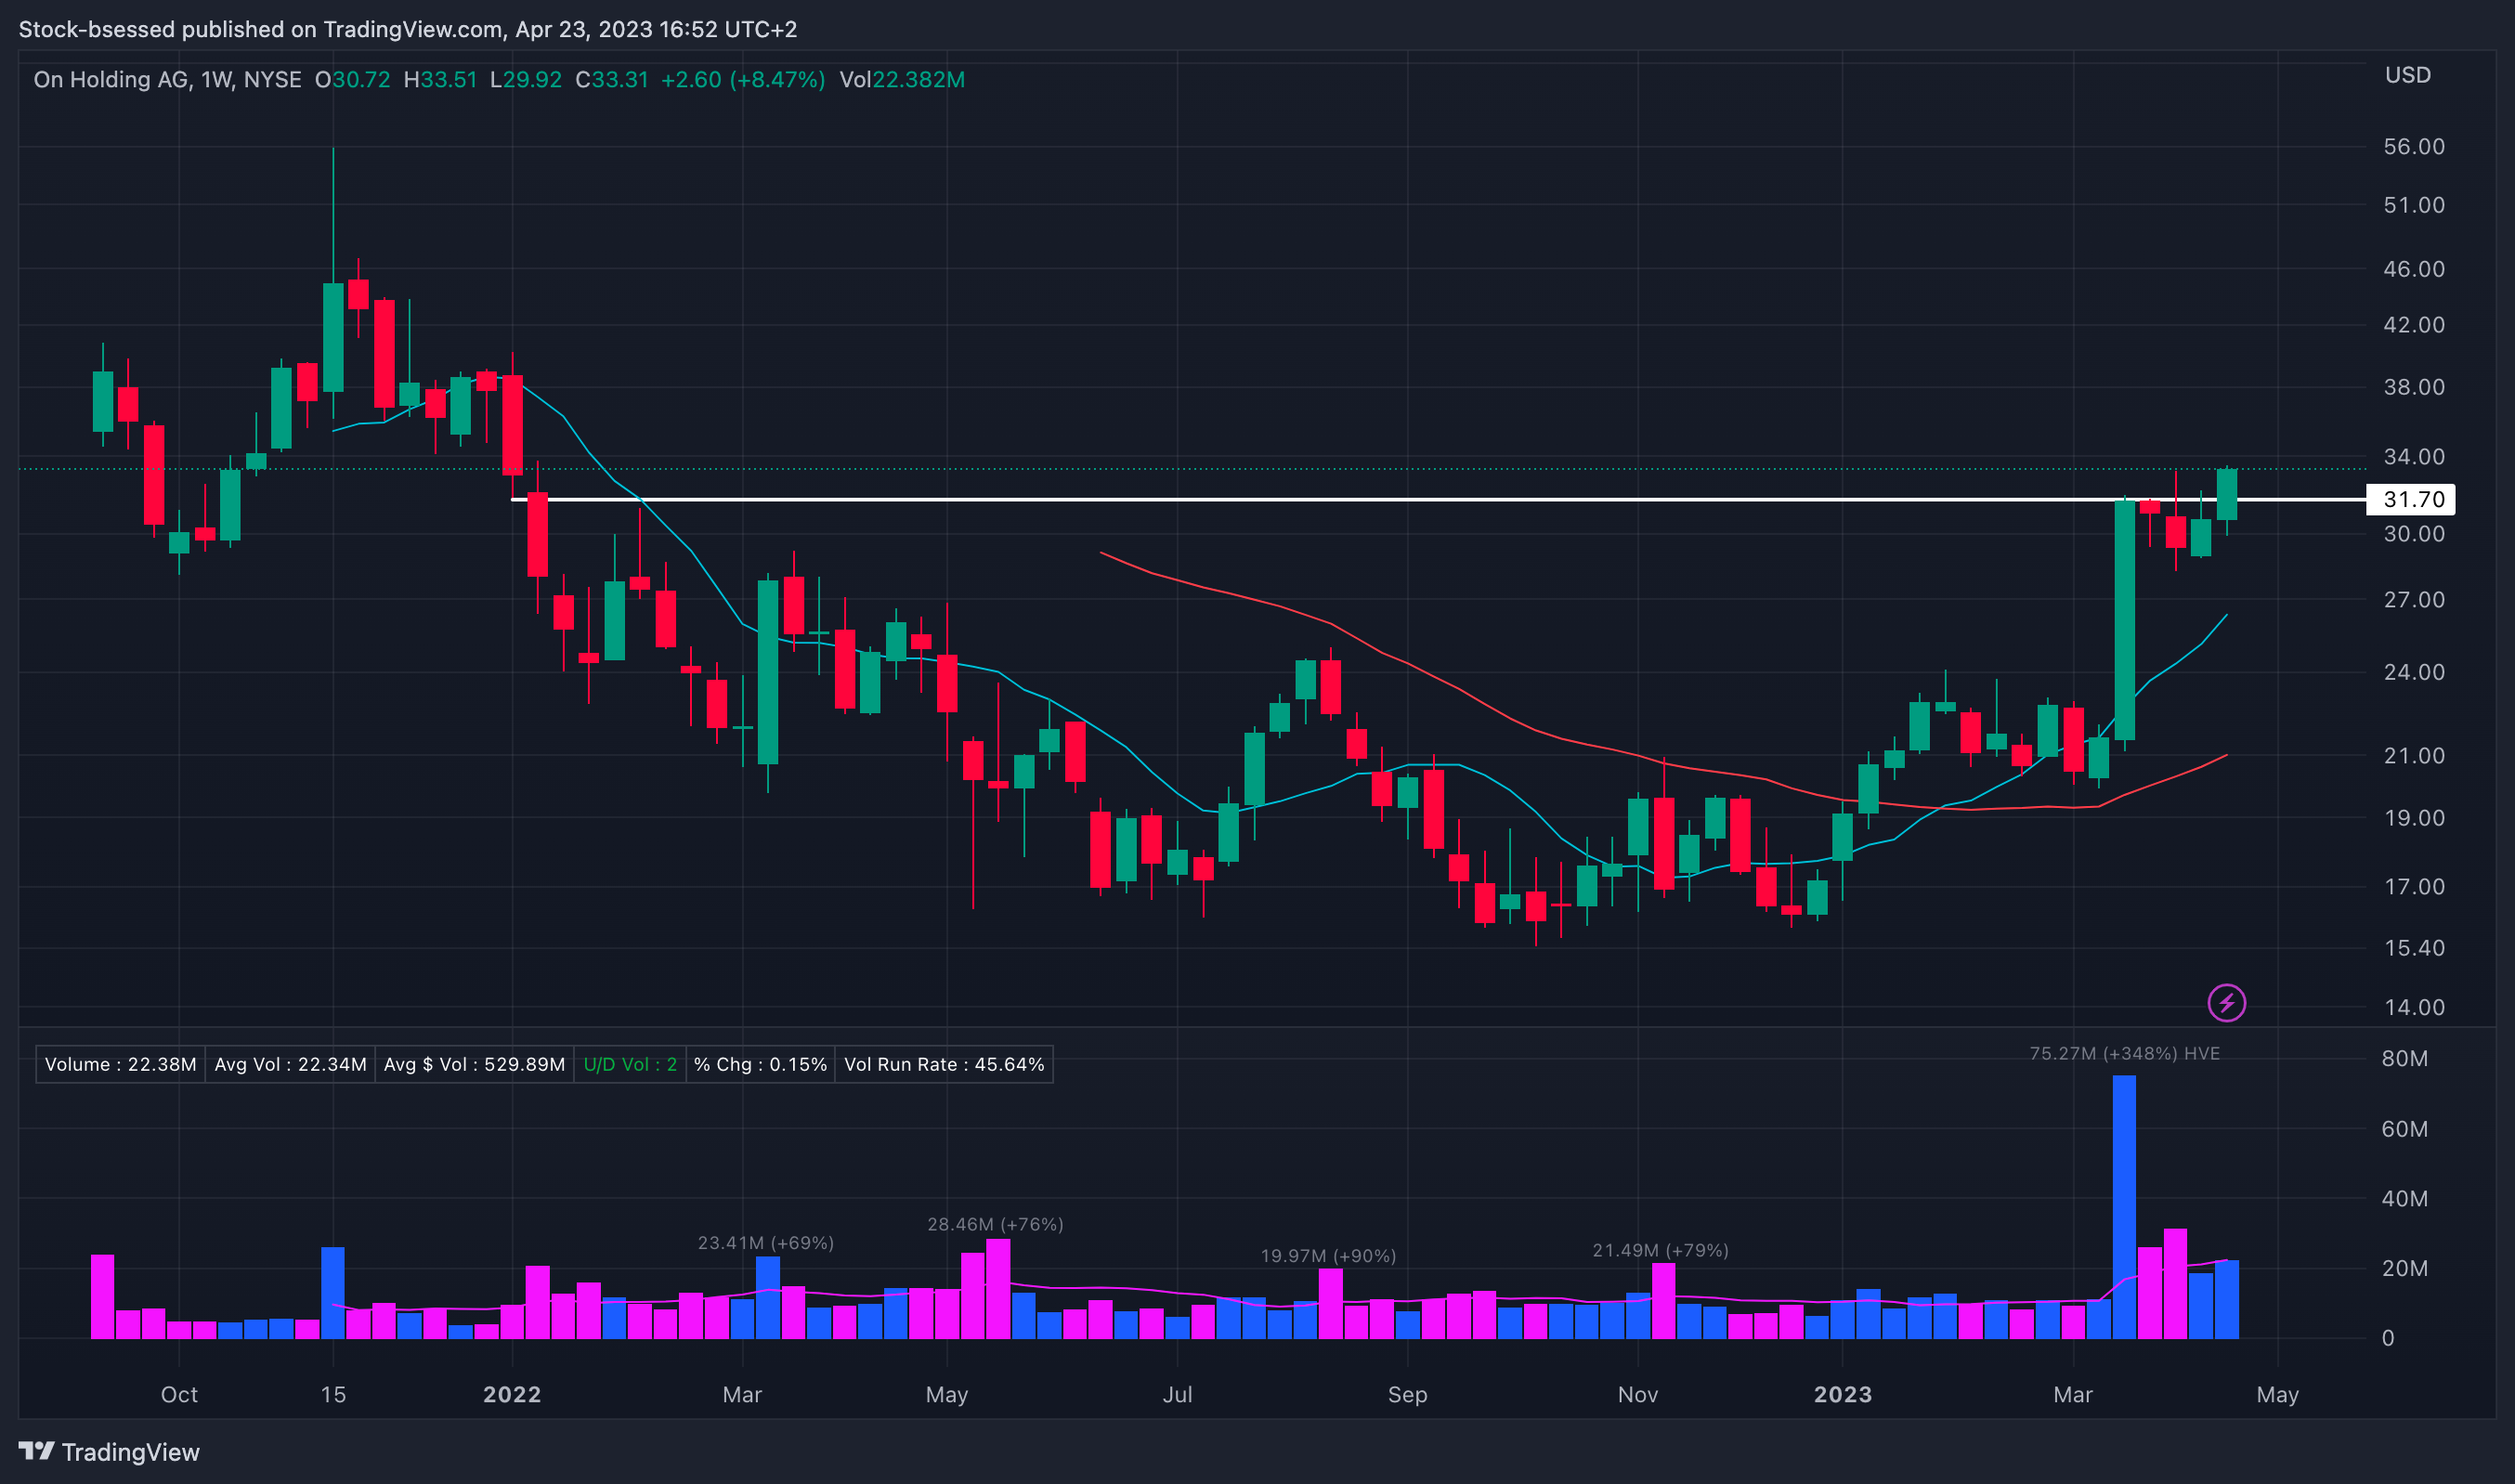
ONON 0.00%↑ Bought this at 30.02 on the undercut and rally of 30. Good to see that buyers showed up at the 10EMA on Thursday and followed through on Friday to close above the 32 key area and at the highest point since January 2022:

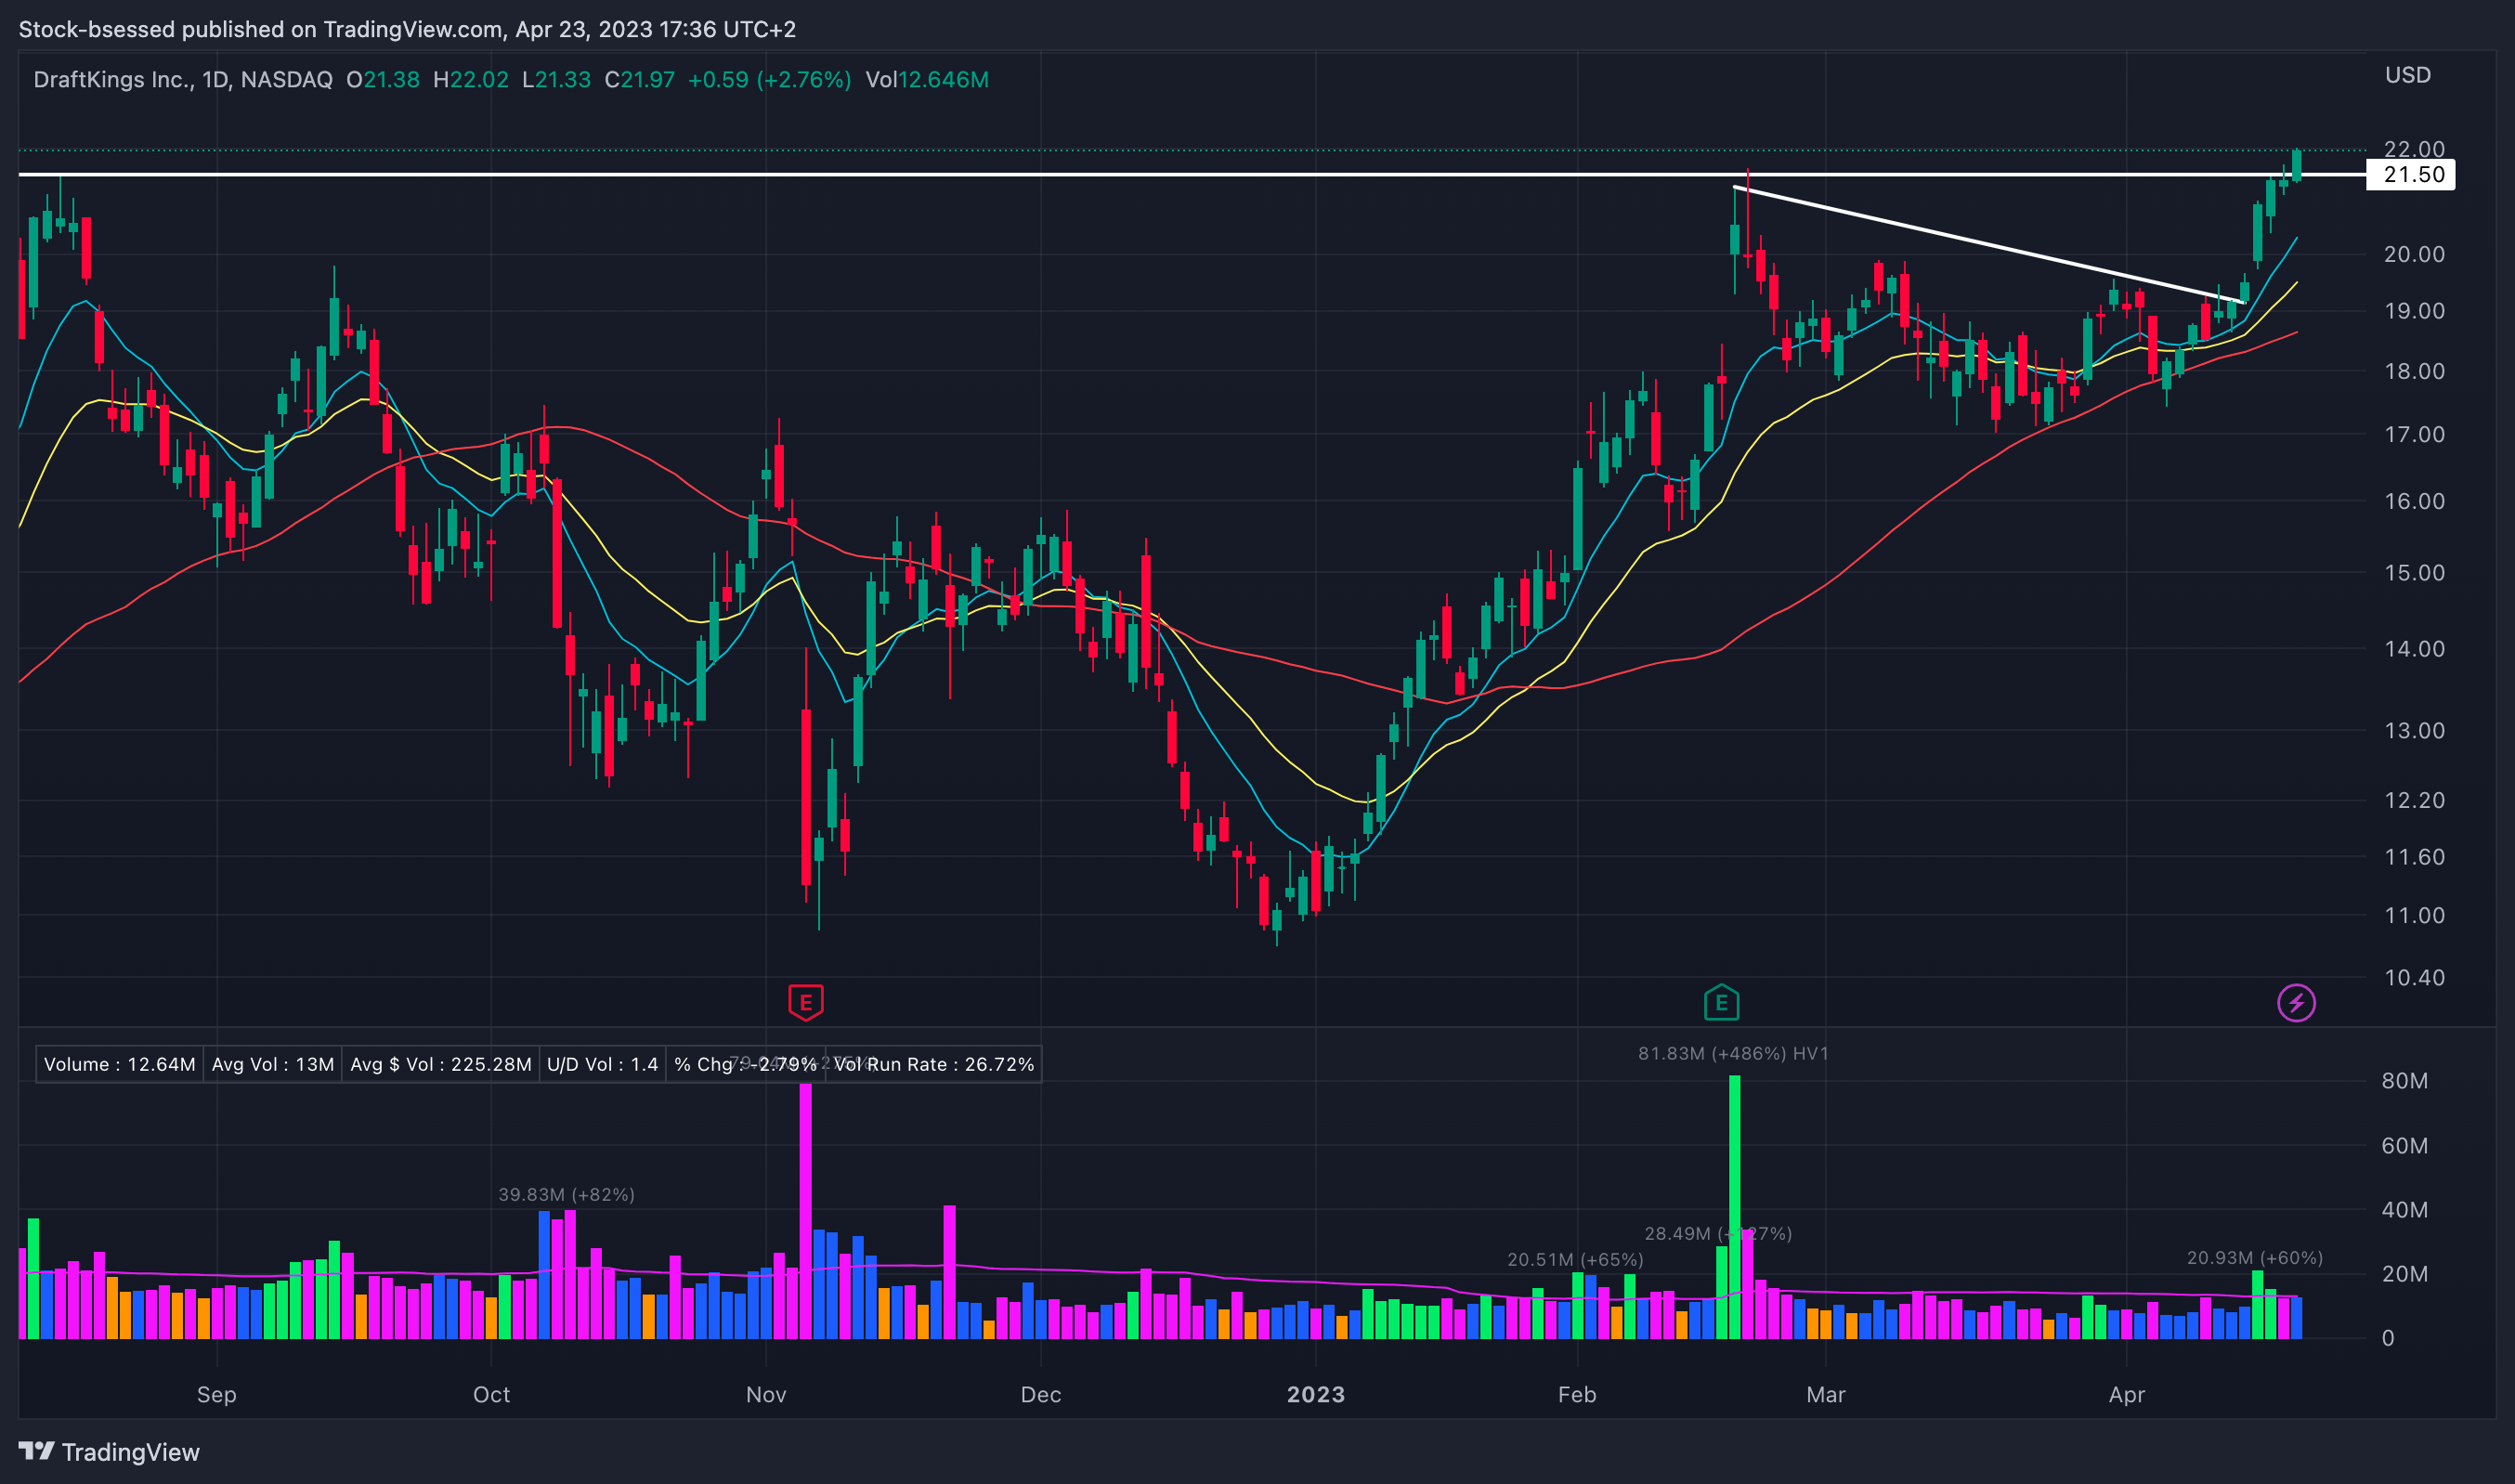
DKNG 0.00%↑ Bought this descending trend line setup on the 17th April at 19.20 and has been acting perfectly so far - clear relative strength and was able to quickly push another key level around 21.50. Now expecting some rest and want to see an orderly consolidation to allow KMAs to catch up to price:
ARLO 0.00%↑ Excellent action here as it flagged out tightly into the 10EMA and was able to push above this descending trend line once more - identified this as a possible add spot heading into the session but opted to pass due to already having enough exposure:

RETA 0.00%↑ Continues acting well while trending nicely along with the 10EMA - really want to see some power to the upside rather than a slow grind up now:

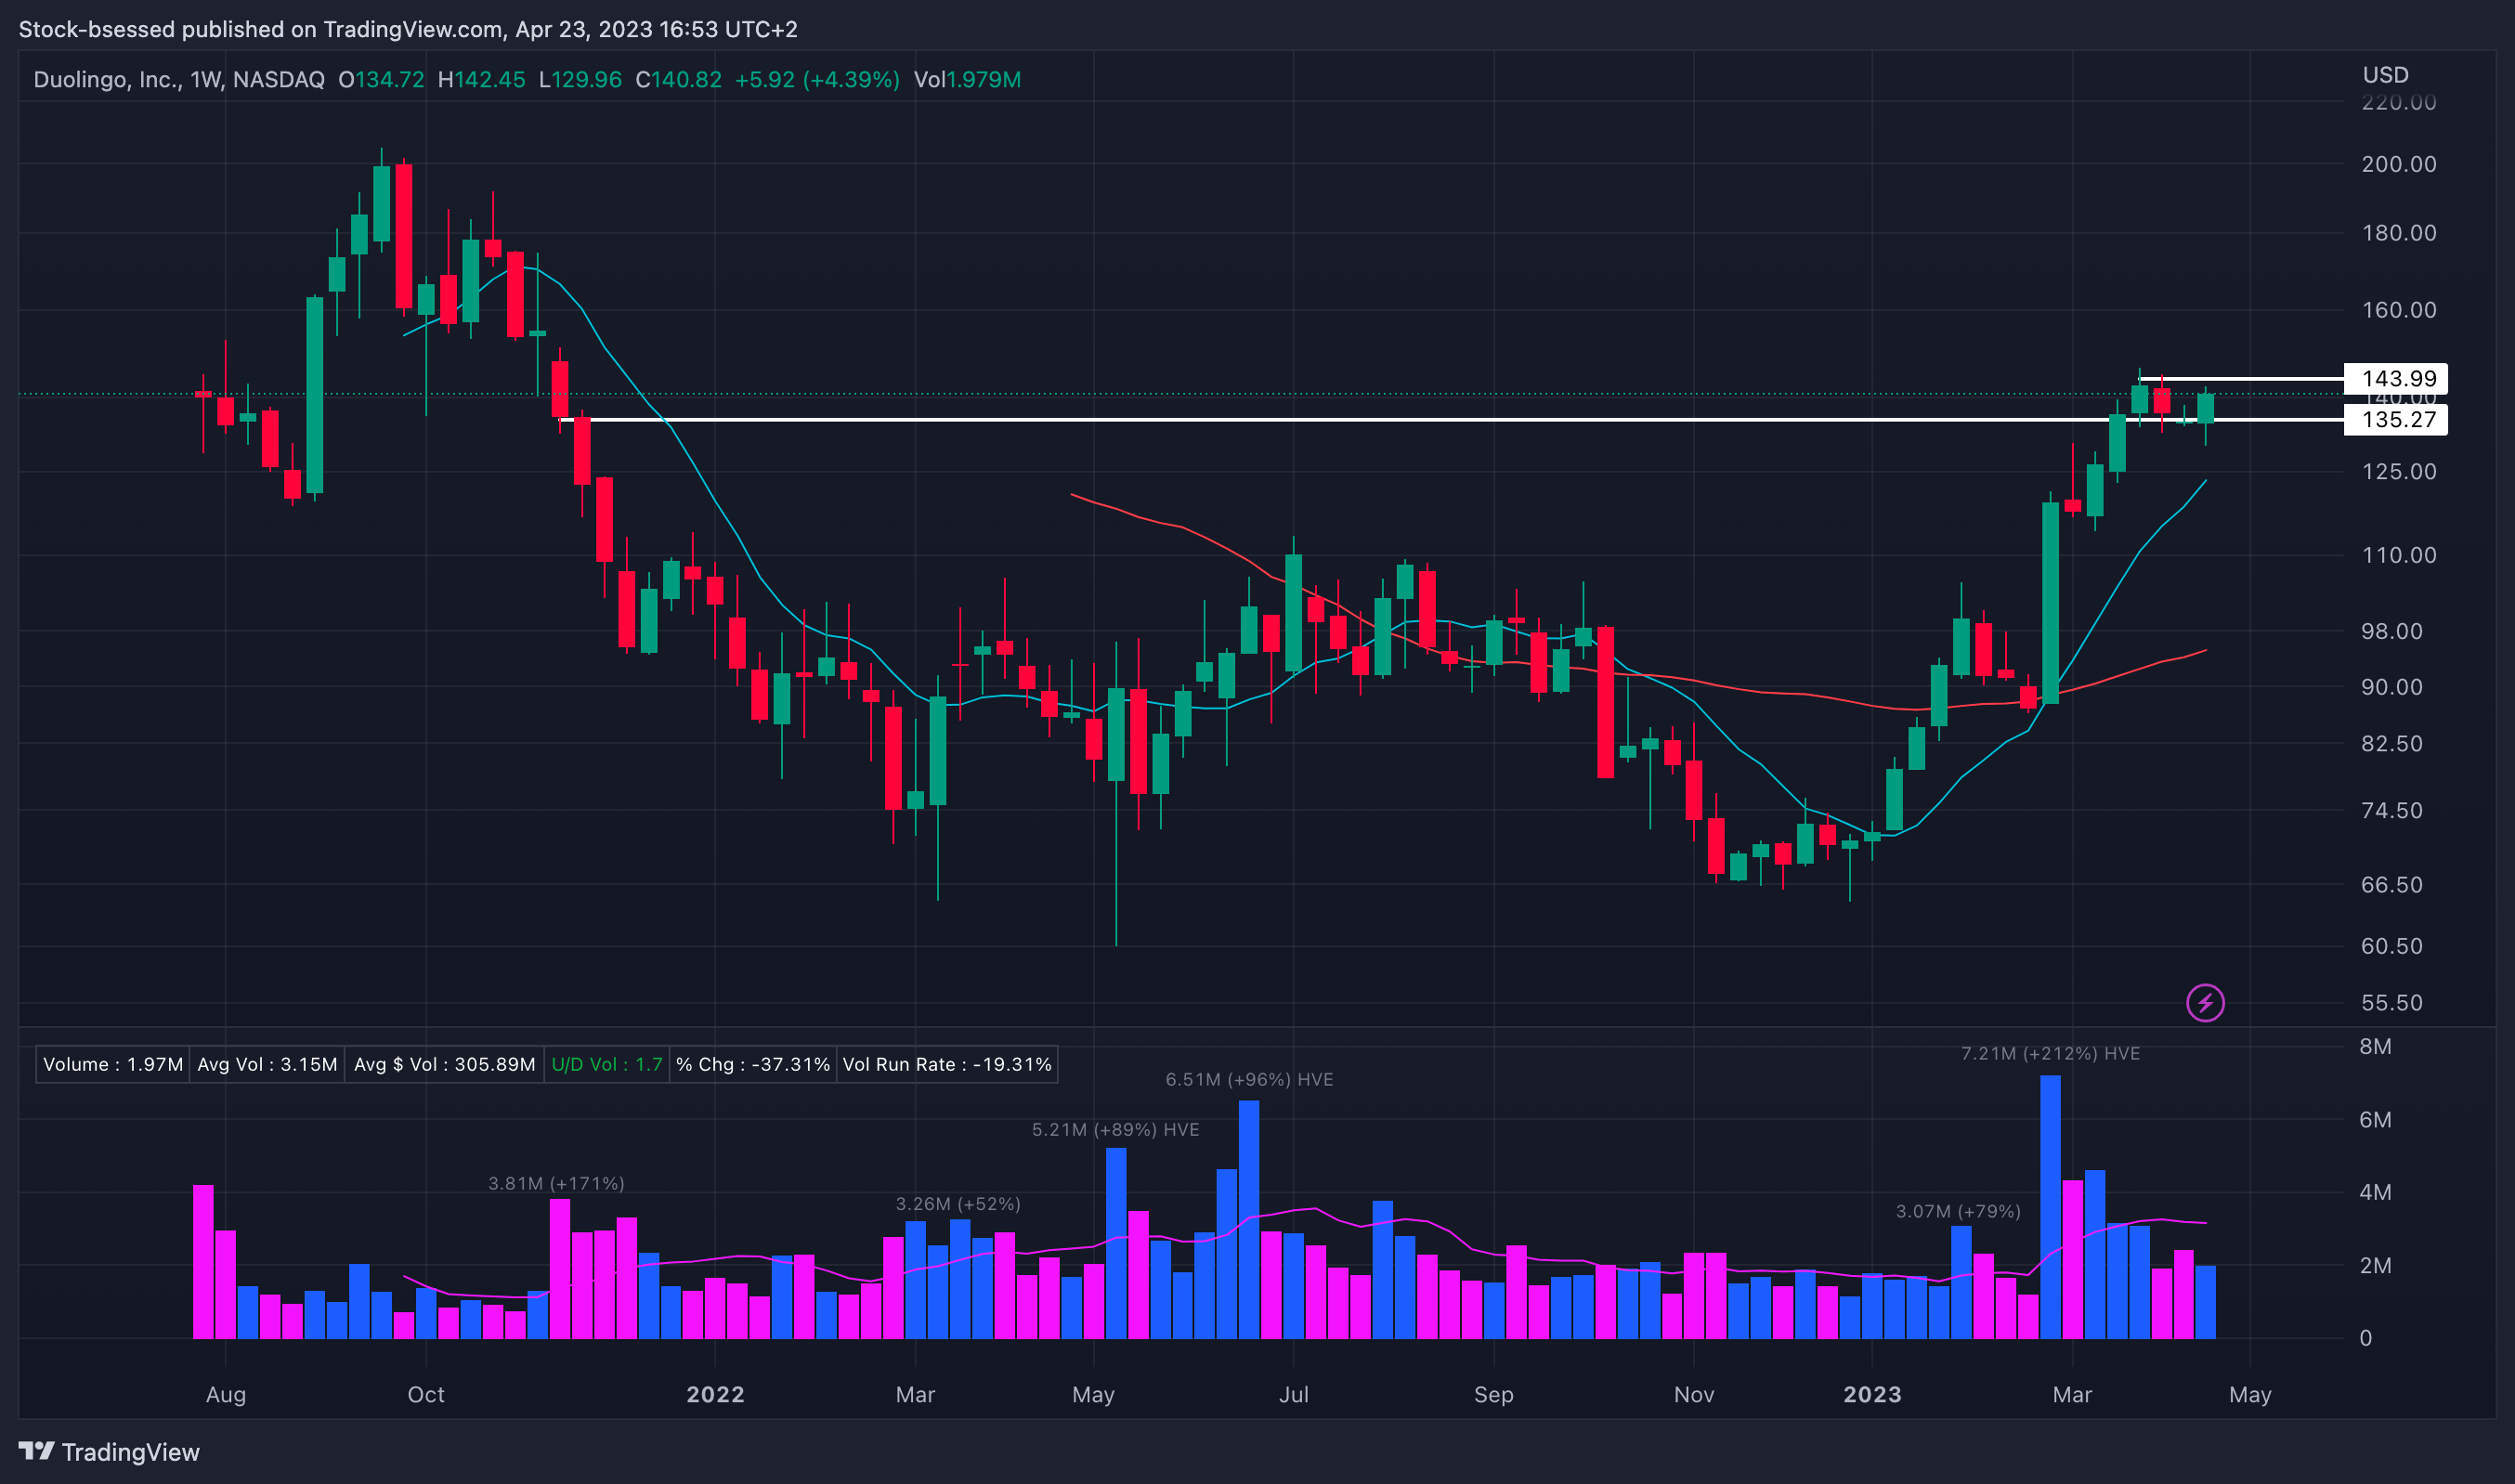
DUOL 0.00%↑ Bought this descending trend line setup at 136.87 and thus far has been supported well on weakness around the 10EMA. Now potentially setting an alternative pivot around 142.45:

Focus List
Reminder to NOT force anything in this kind of environment and rather wait for your edge to show up clearly!
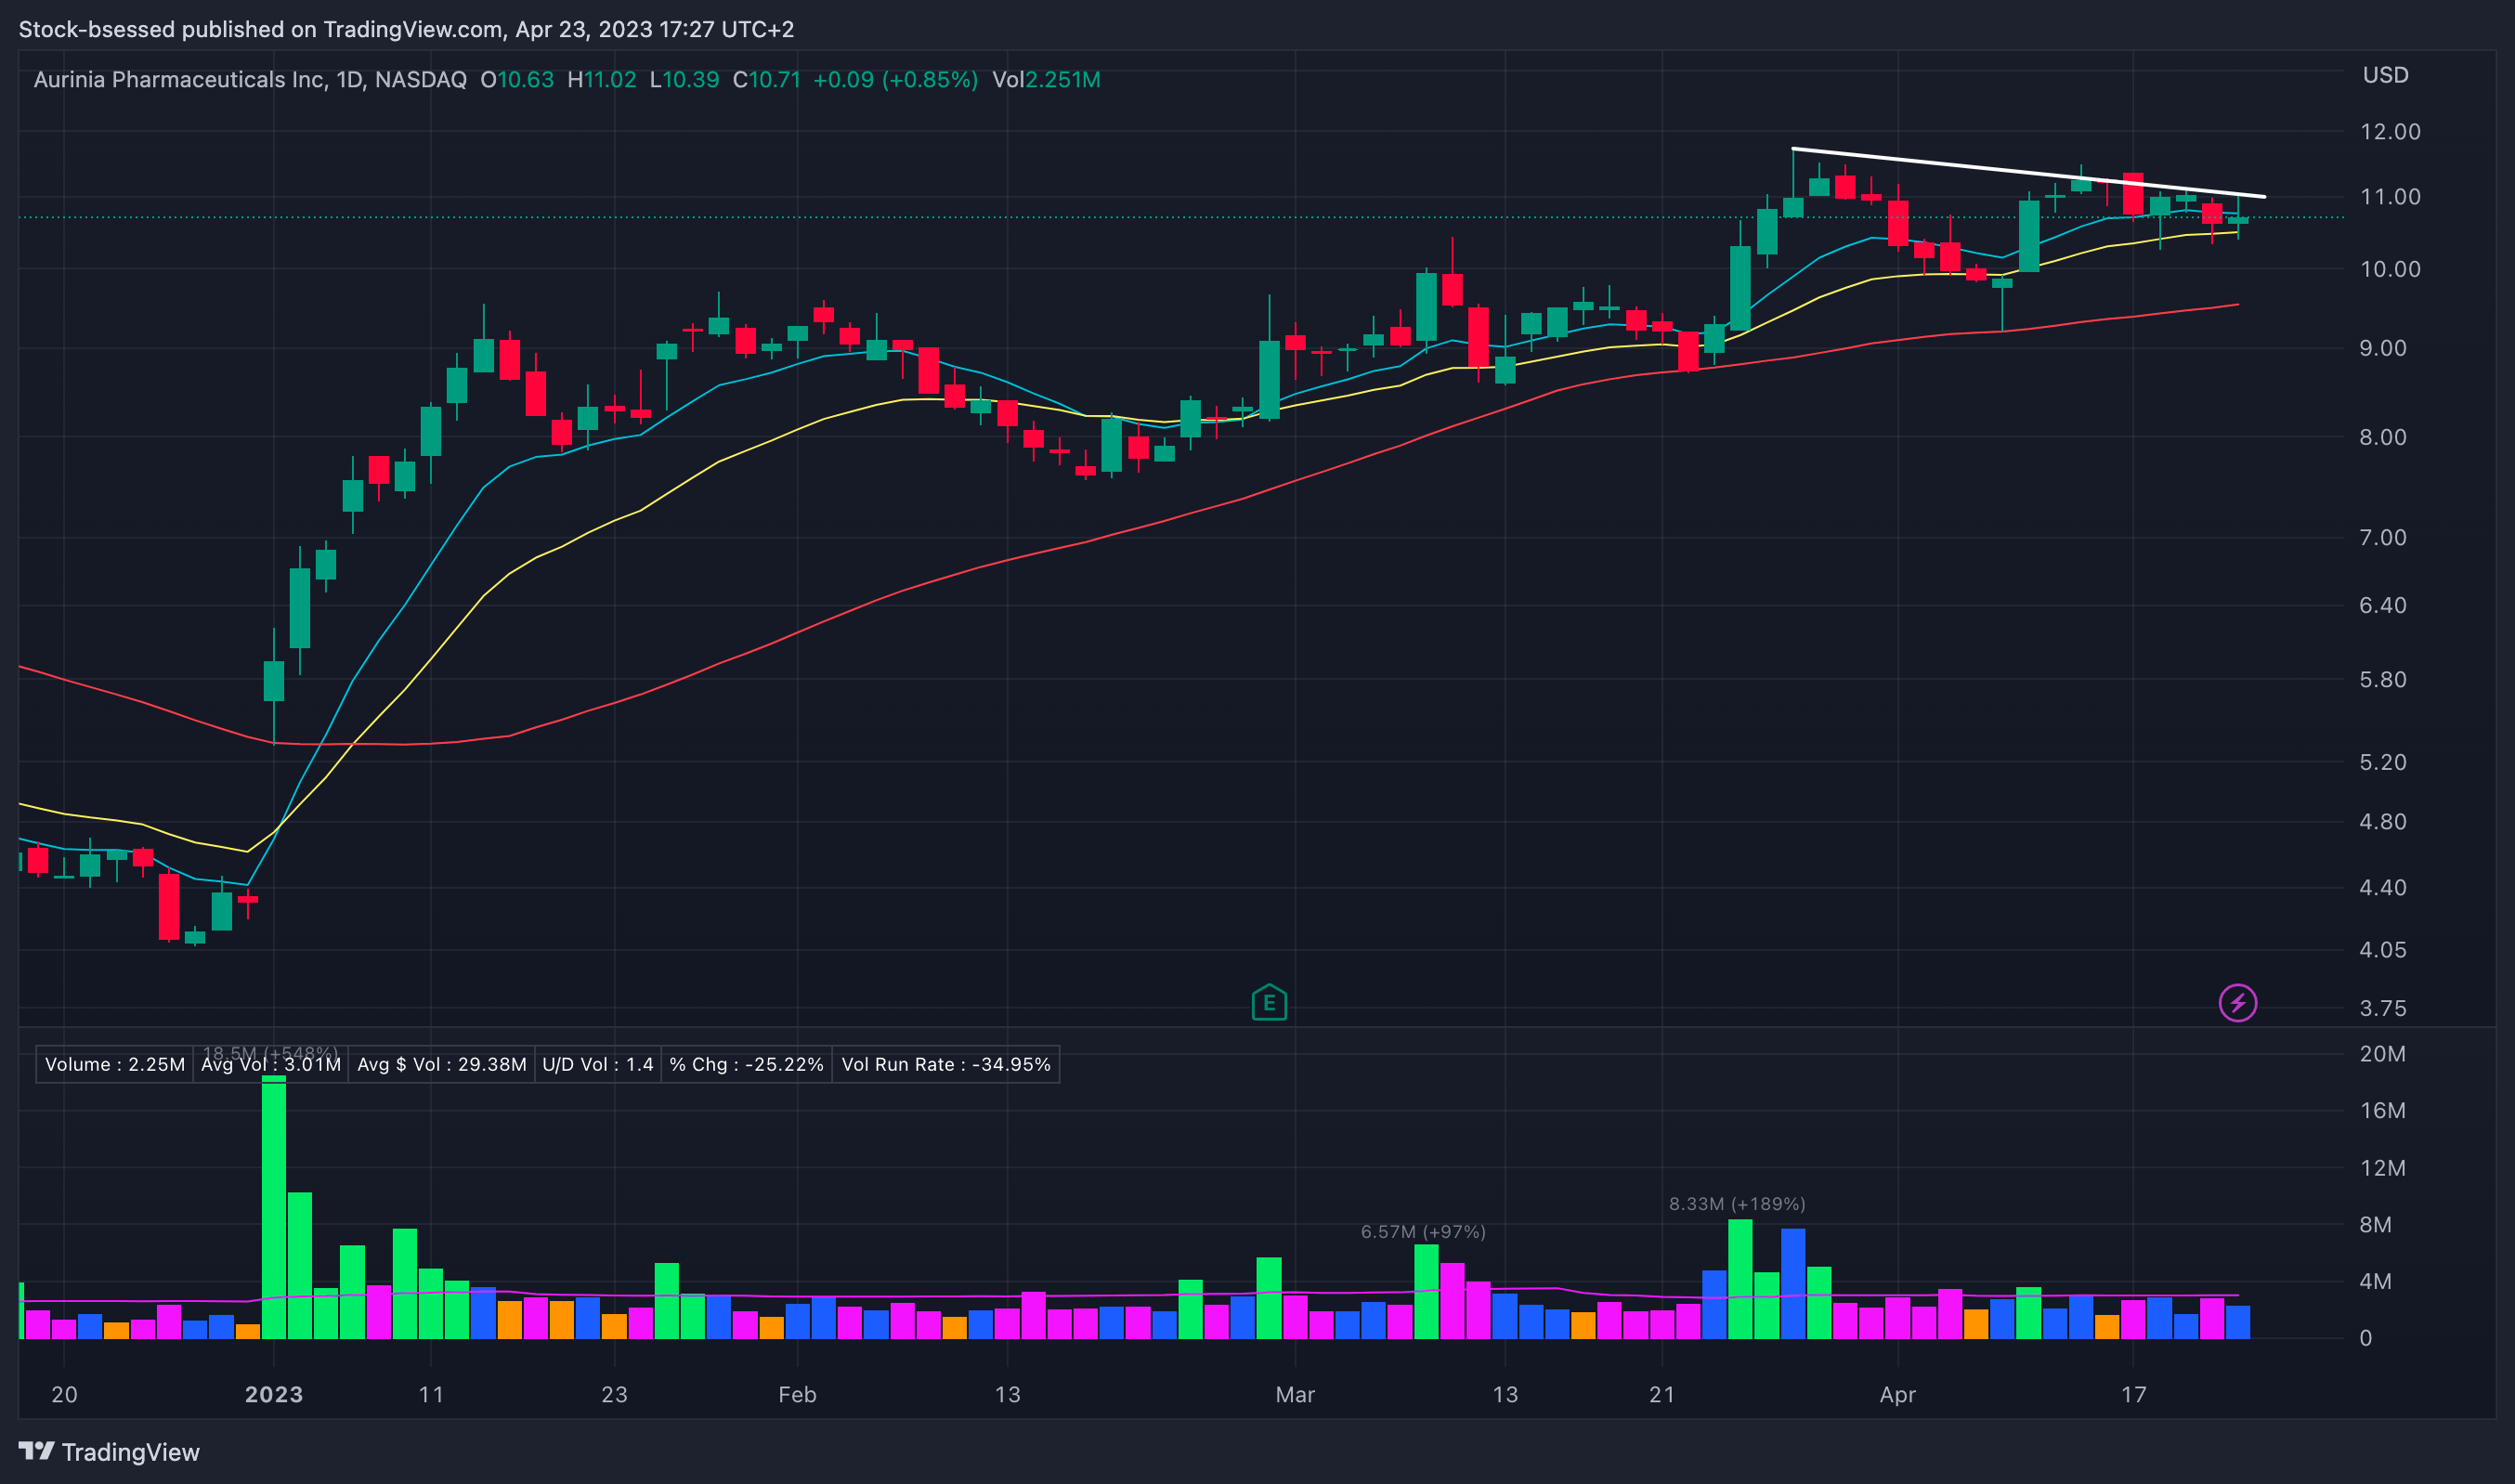
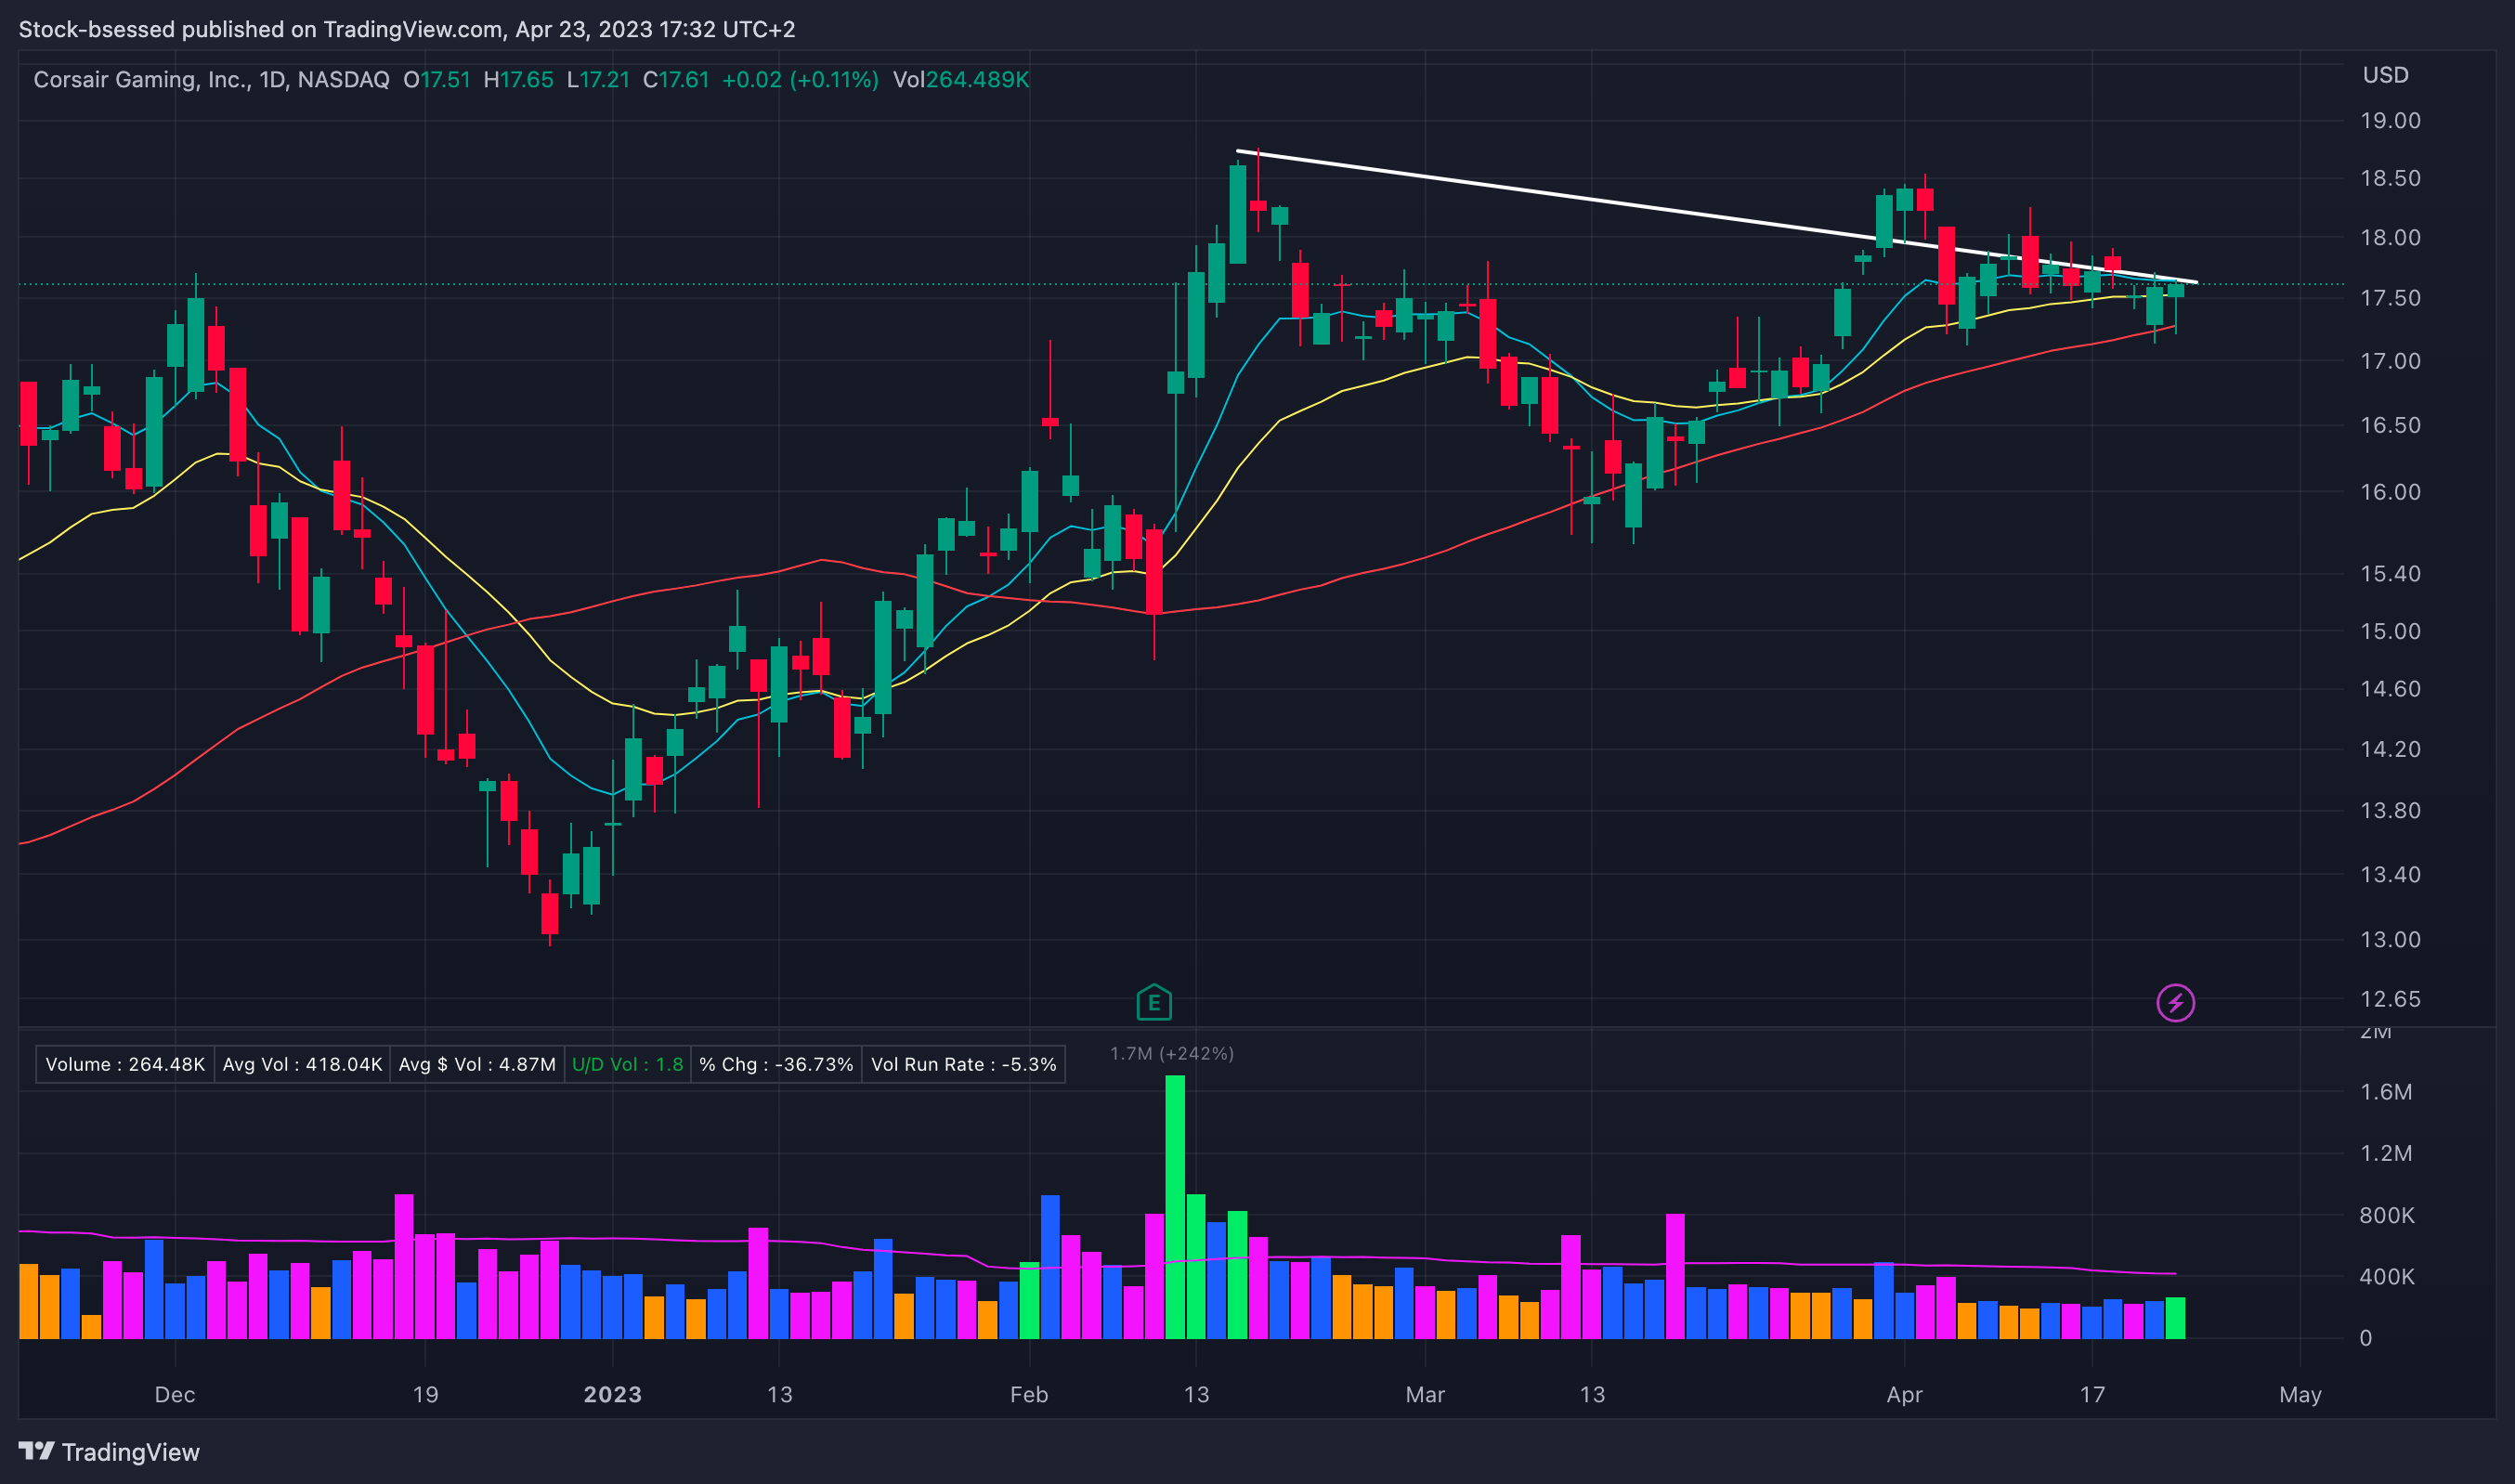
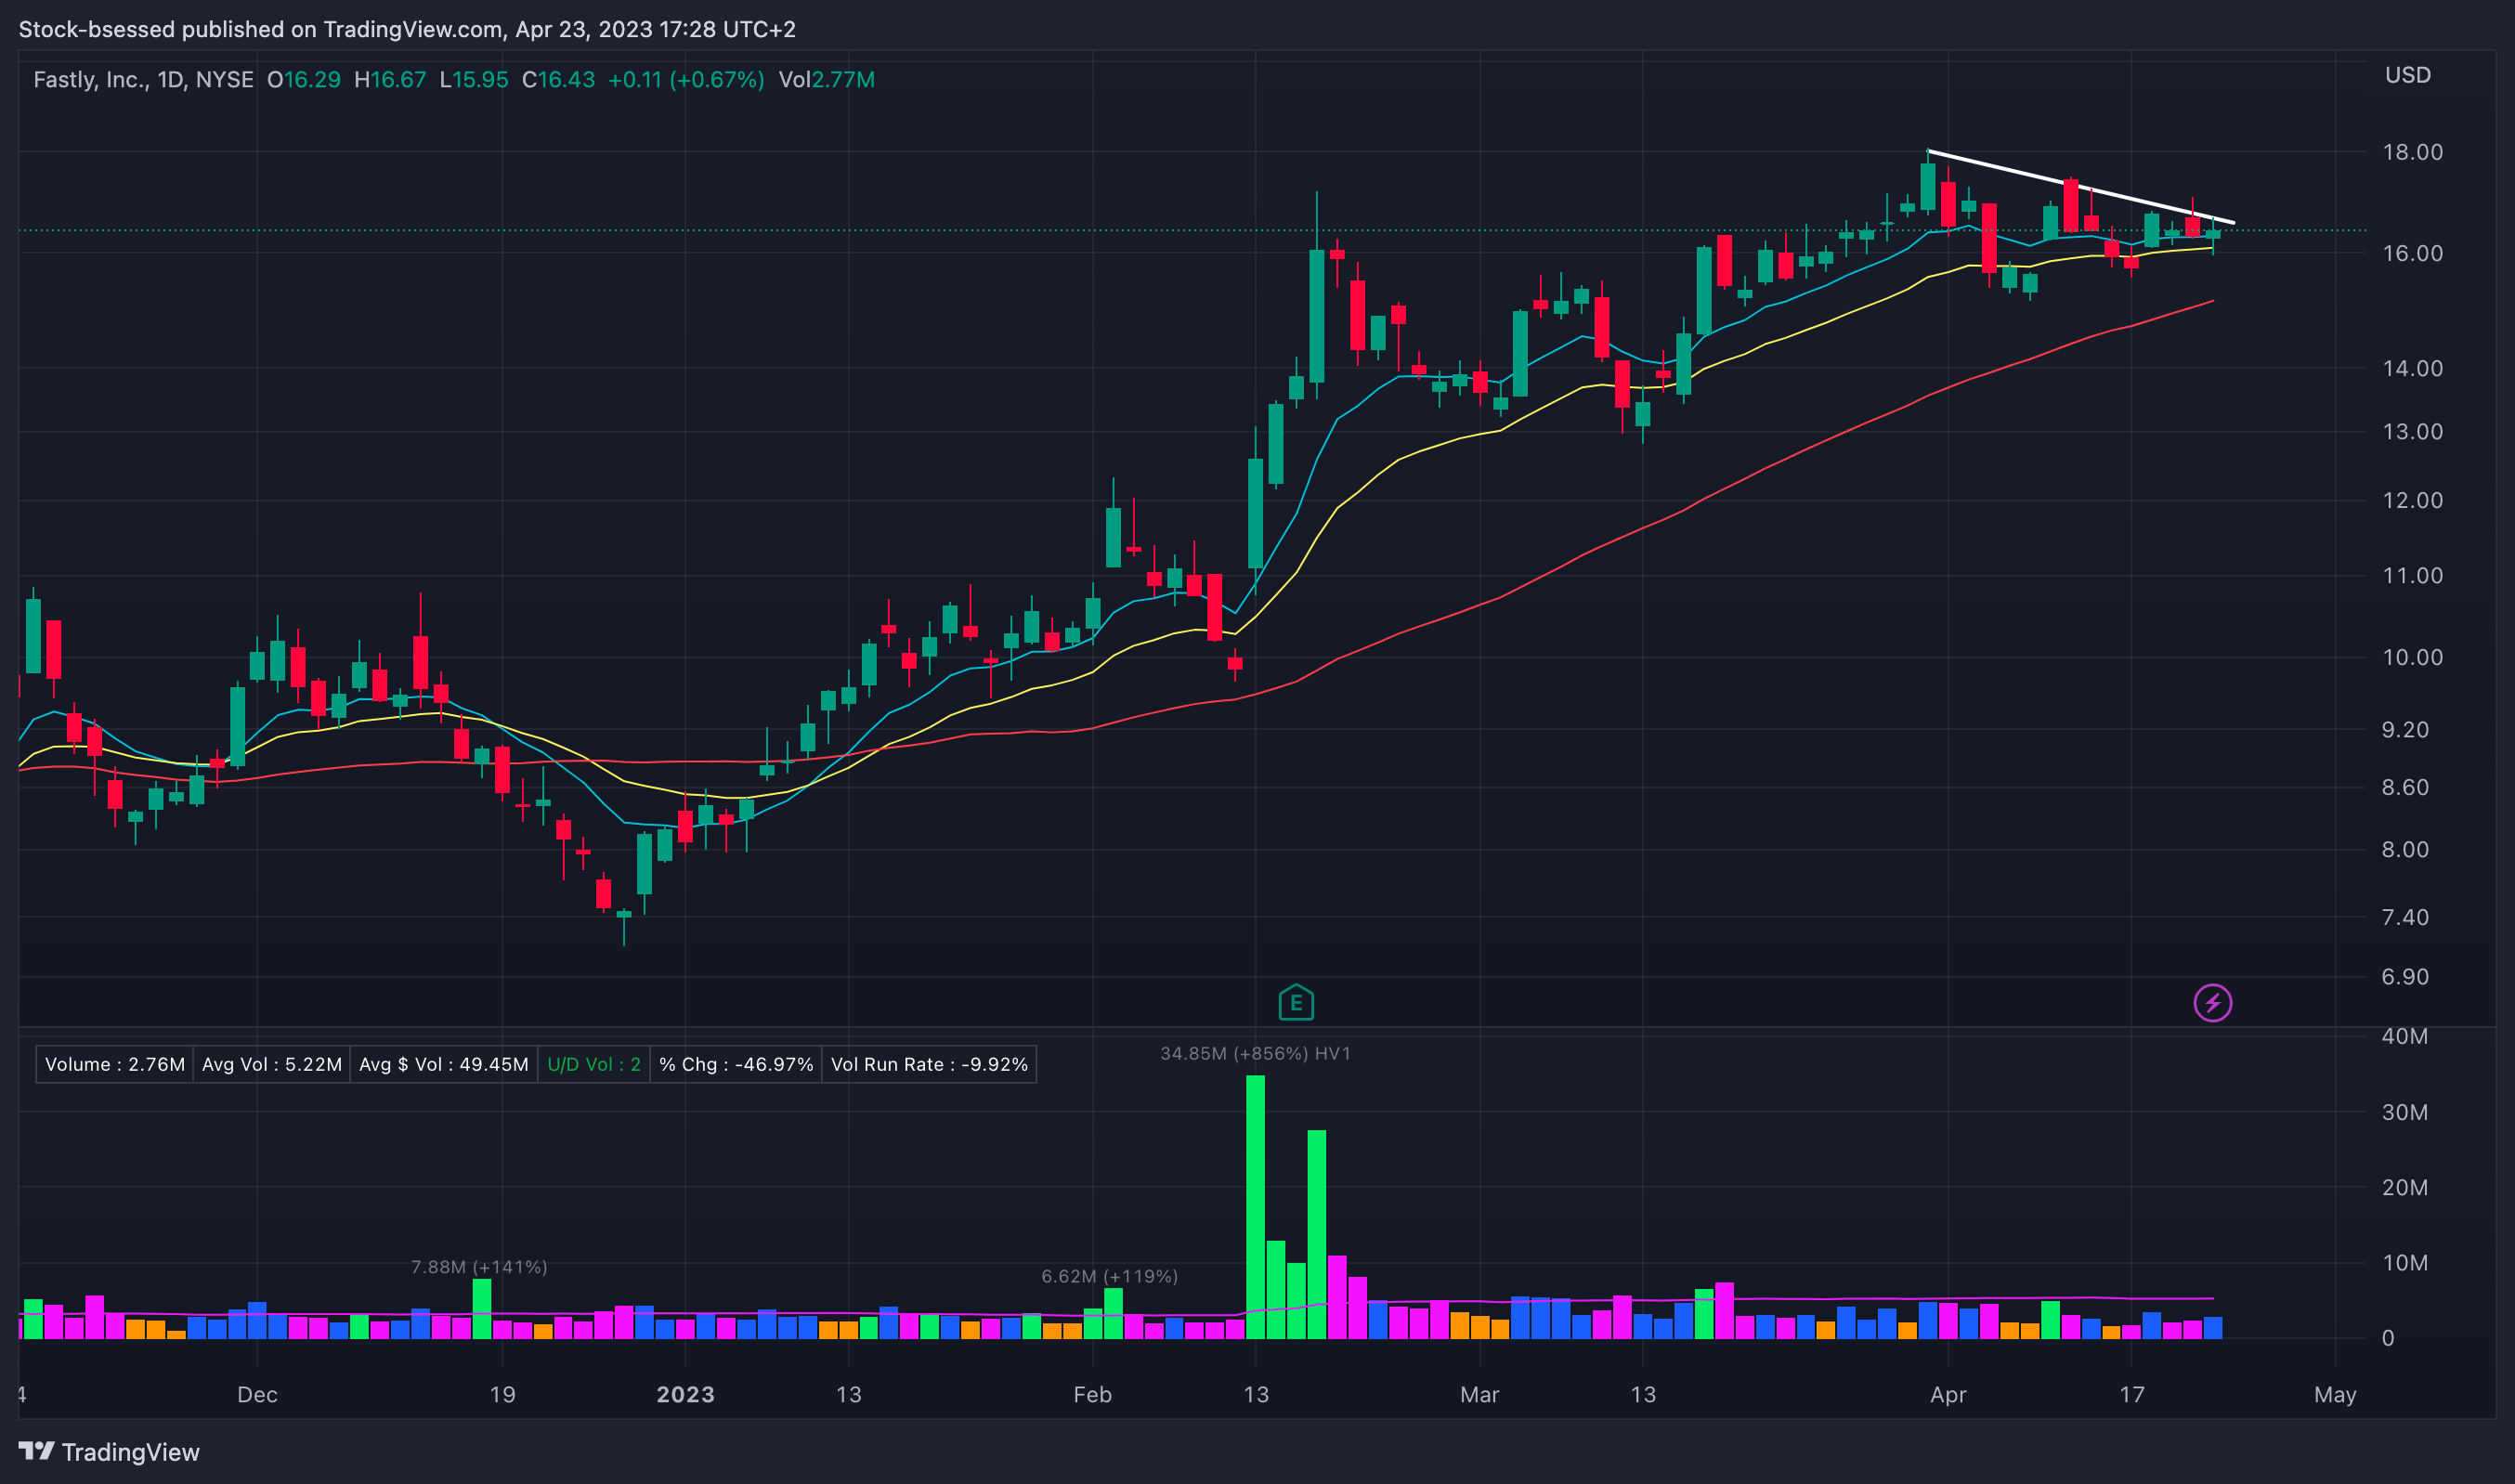
Descending Trend Line

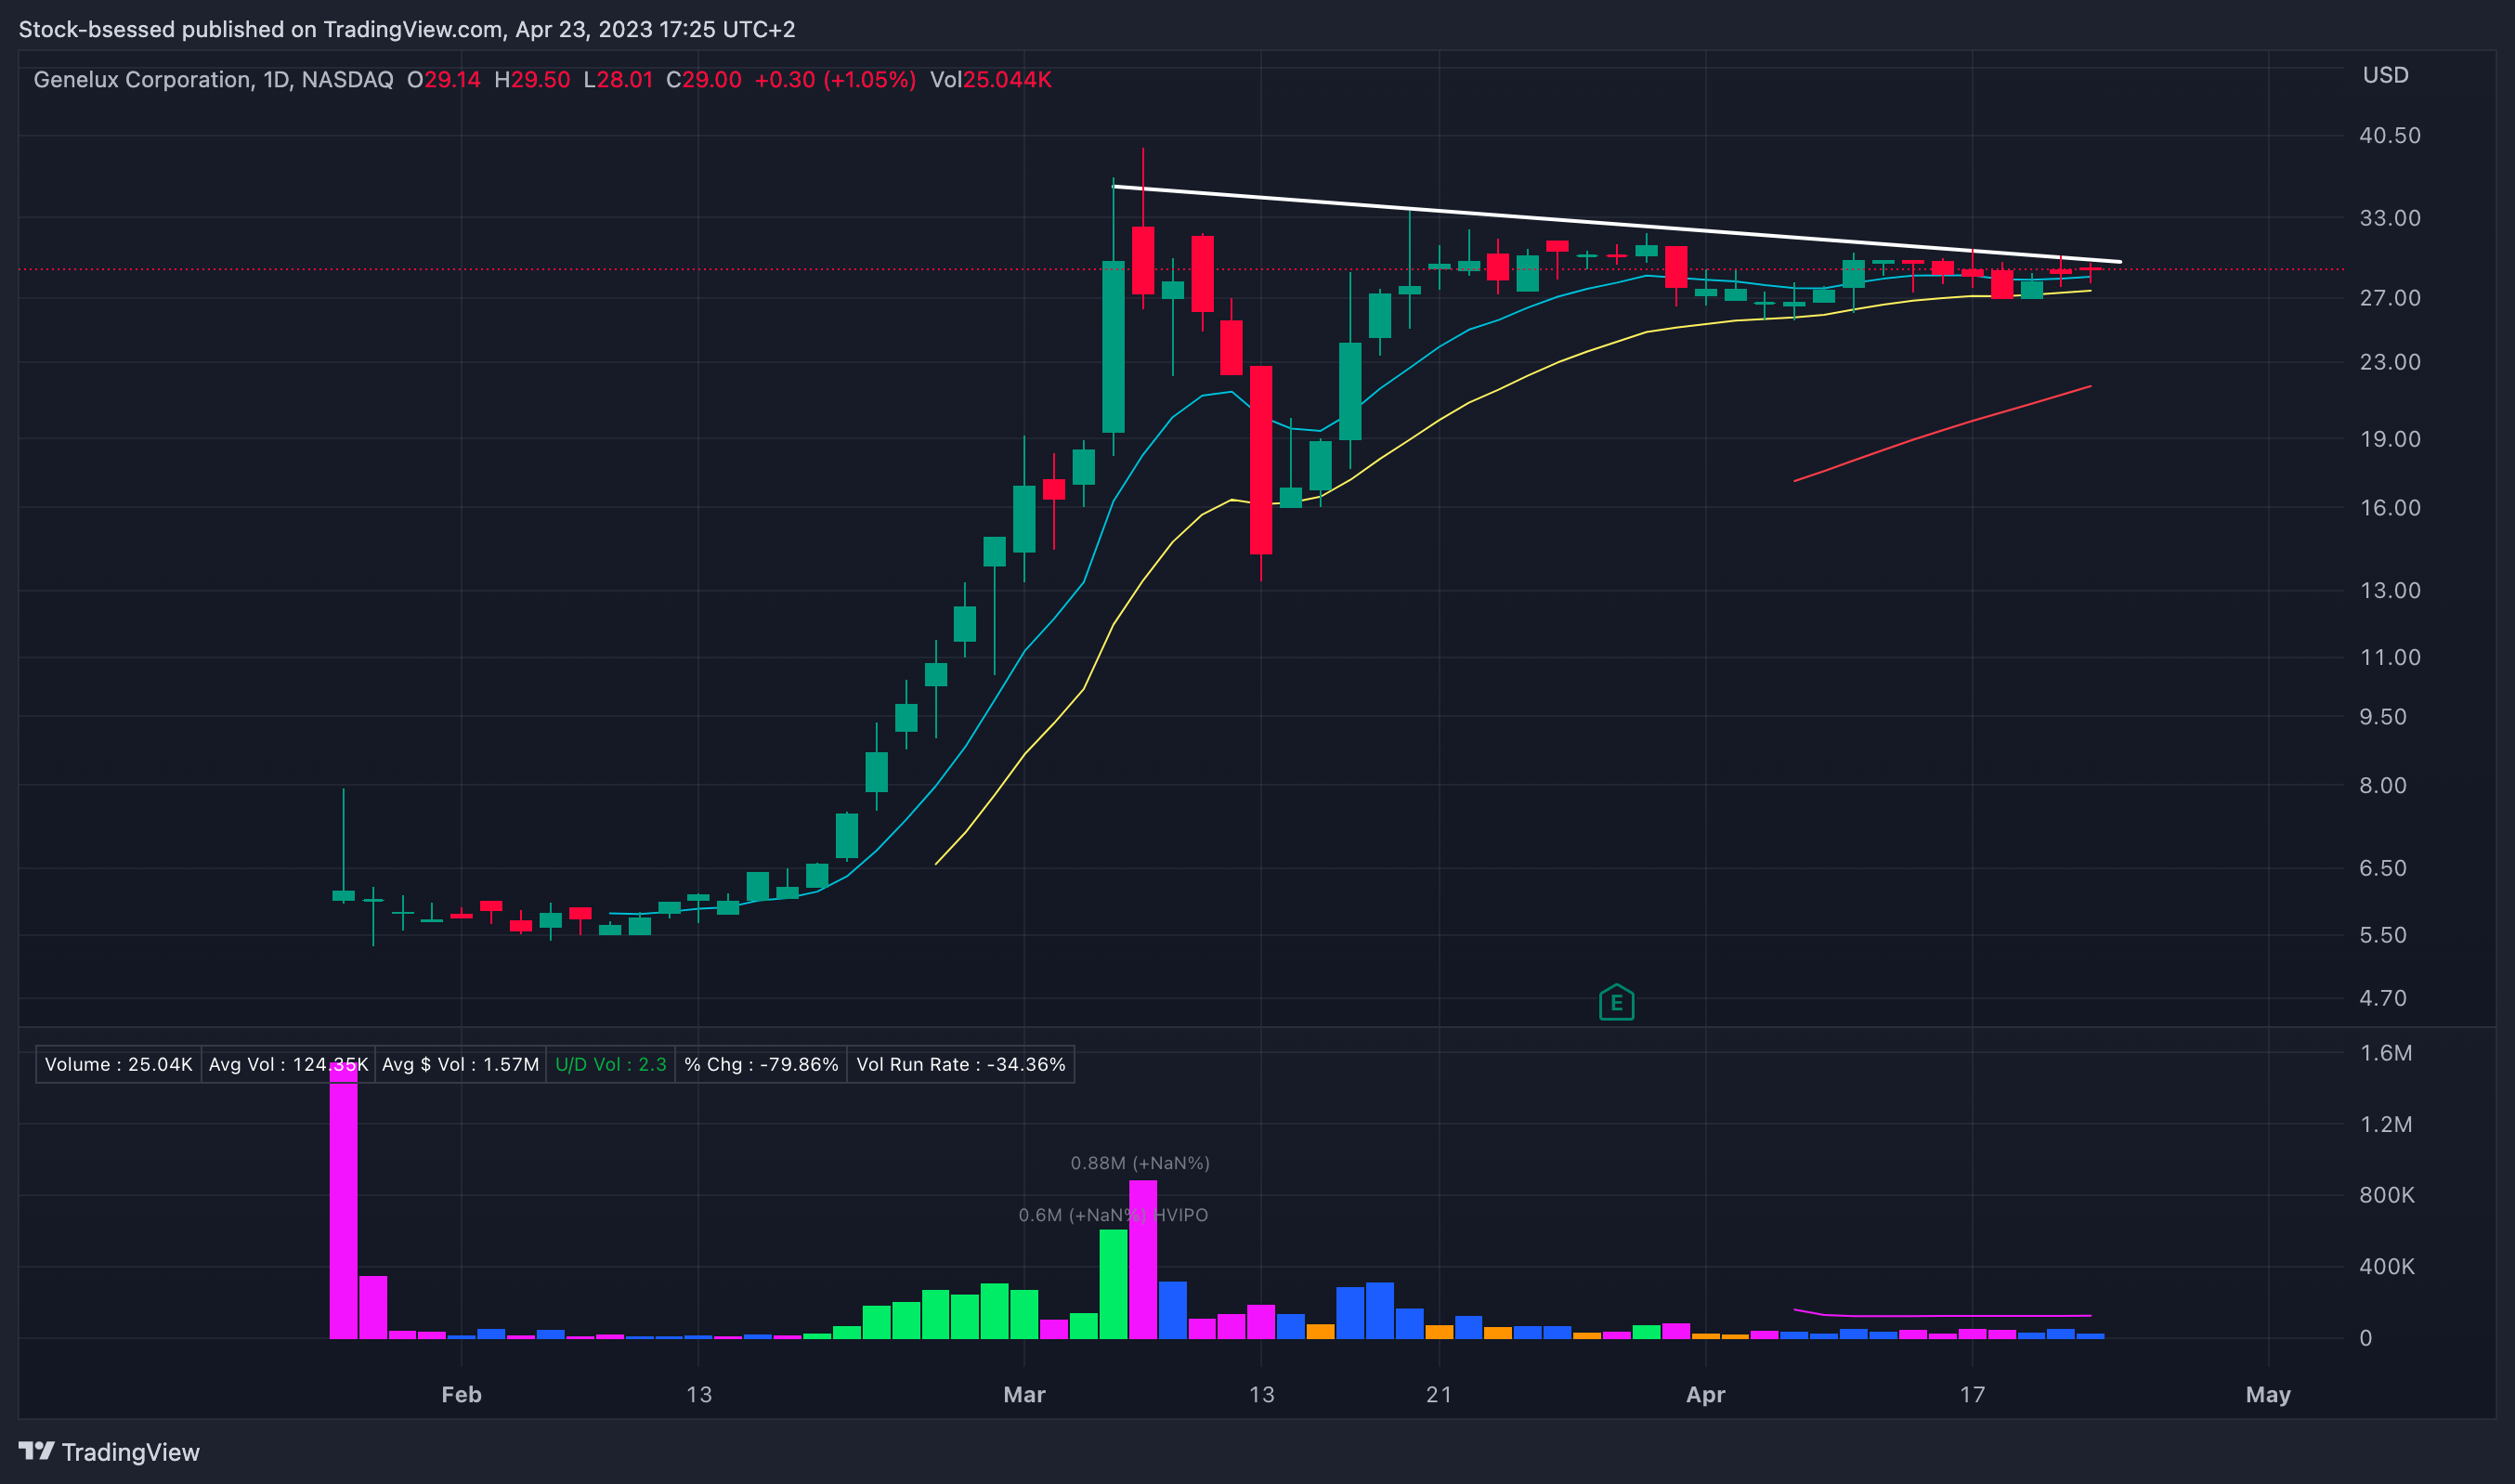

High-Tight Flags
Base Pivots
Hi Stockbsessed
I really like how you navigate these choppy waters to end up with very strong and profitable open positions.
Now wrt VKTX.
This stock rocketed up on 28/3, opening at 12.31, closing at 15.44 , a rise of 69% !
You bought it at 12.62, very near the opening bell.
This was on the news of a successful phase 1 obeisity trial.
My questions are. What alerted you to this stock?
And what made you decide to to buy so early on that day?
How did you balance the R/R in your head, knowing that protecting your capital is your no.1 (and no. 2) priorities?
Thank you and best wishes, Ram