Weekly Review & Focus List For Week of 20th March
Weekly Review & Focus List For Week of 20th March
NASDAQ Outperforms - Earnings, Sector & Leading Stock Analysis + 3 Helpful Scans

We had quite an eventful week in the markets with varying action between indexes and potential leadership stocks truly showing their hand as the nasdaq continued to outperform!
Stockbsessed is neither an investment or financial advisor. Stockbsessed does not provide financial advice and none of the information being provided is to be seen as such.
General Market Overview
Last session

Week
The overall thematic that was made very clear with the action shown over the course of this week was the evident outperformance by the nasdaq when compared to the relative weakness shown by smaller-cap stocks.
Large tech continues to mask some of the extent of the overall damage being done under the surface which is highlighted by breadth metrics: -2060 difference of declining issues on the NYSE last session.
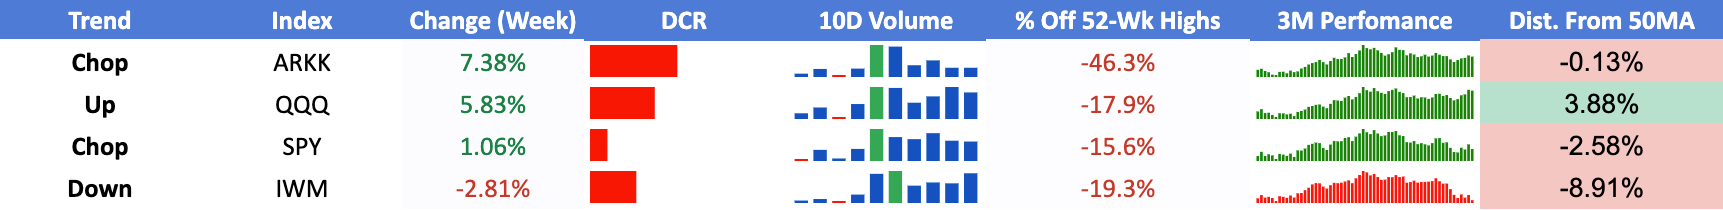
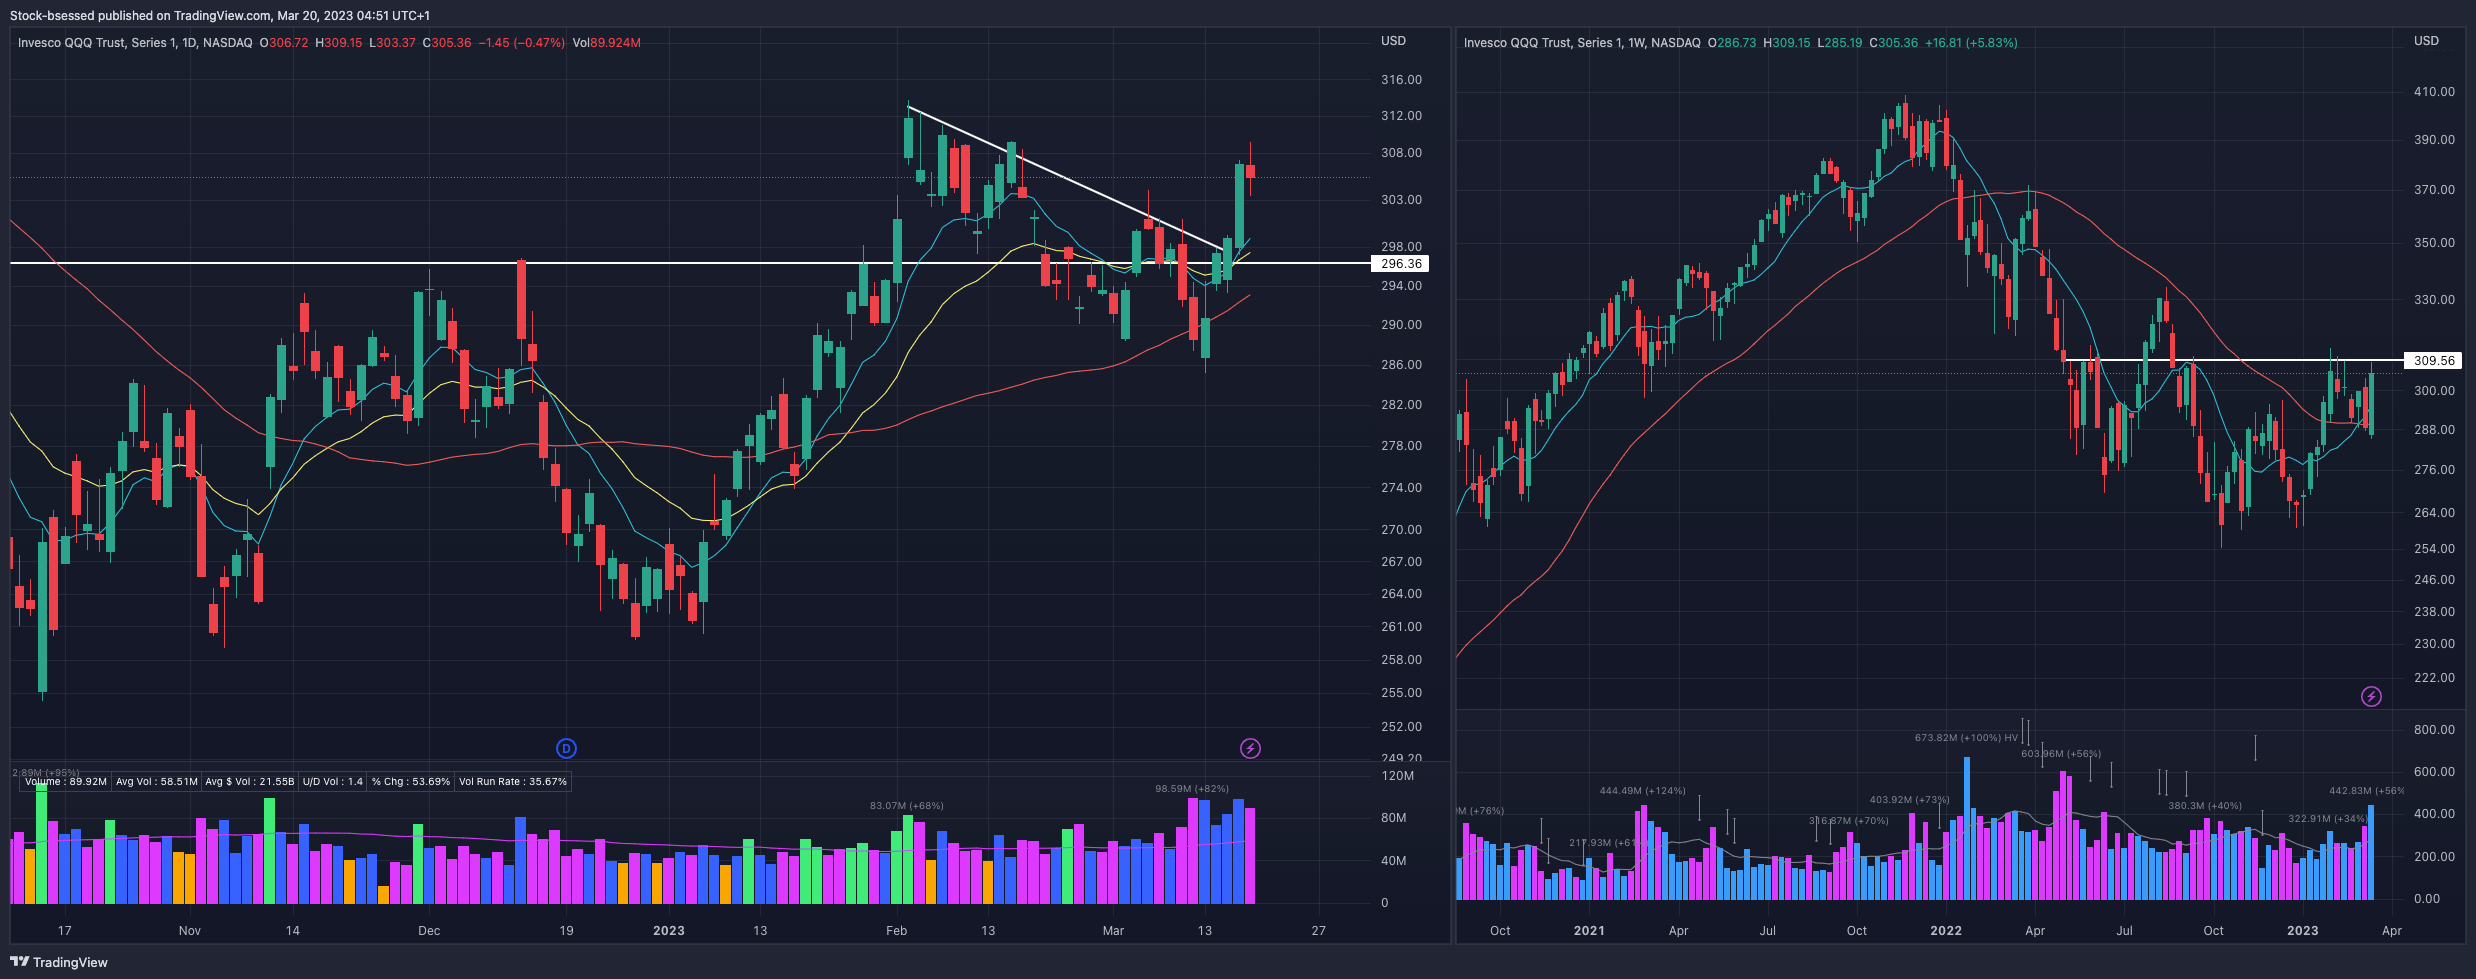
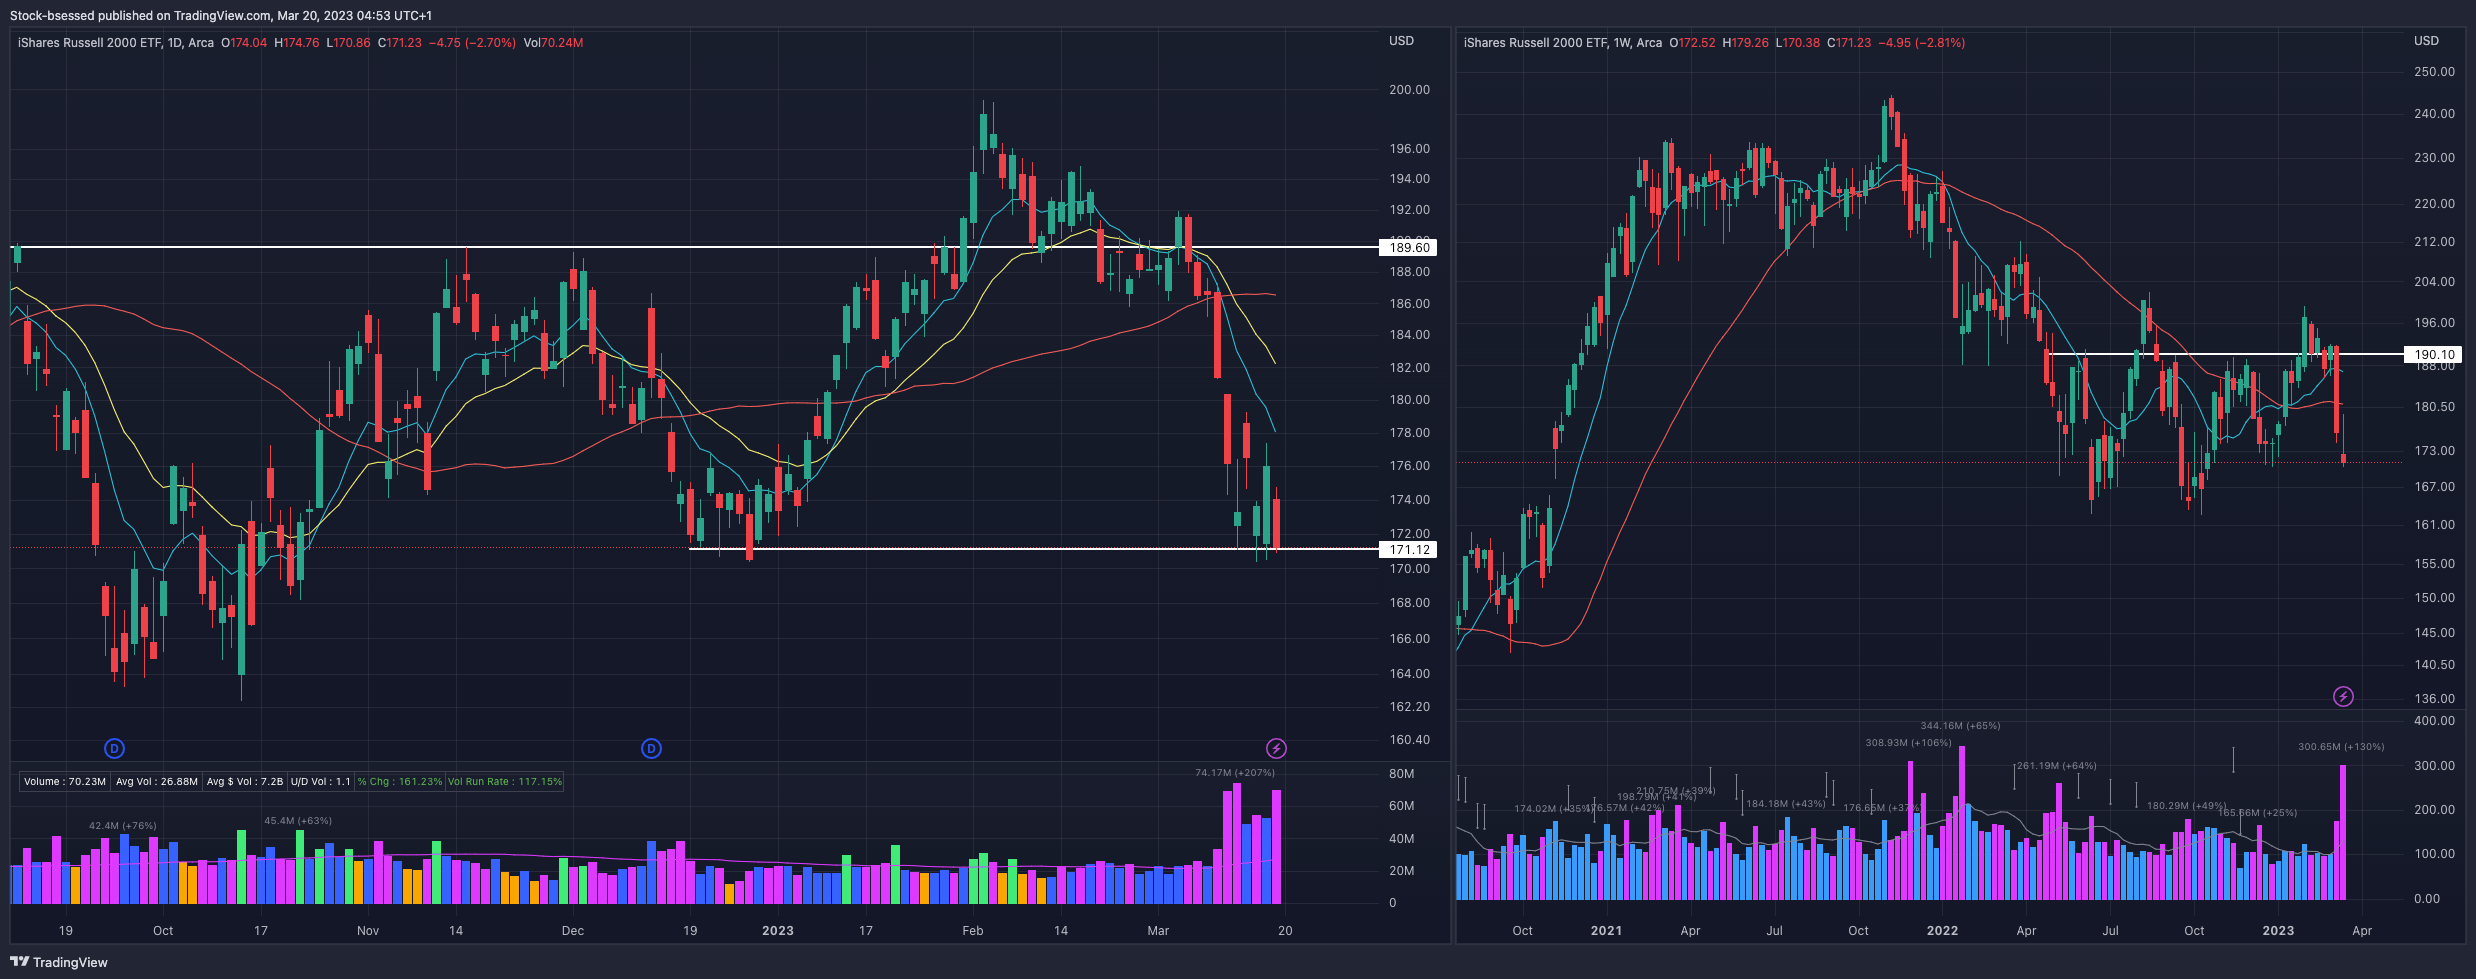
Thus it comes as no surprise that the QQQ chart looks the best while the IWM (small-caps) looks the worst.
Overall focus is currently on waiting for the market to prove itself in terms of abundant setups, breakout follow through and generally encouraging breadth metrics - which are not seeing enough of just yet.
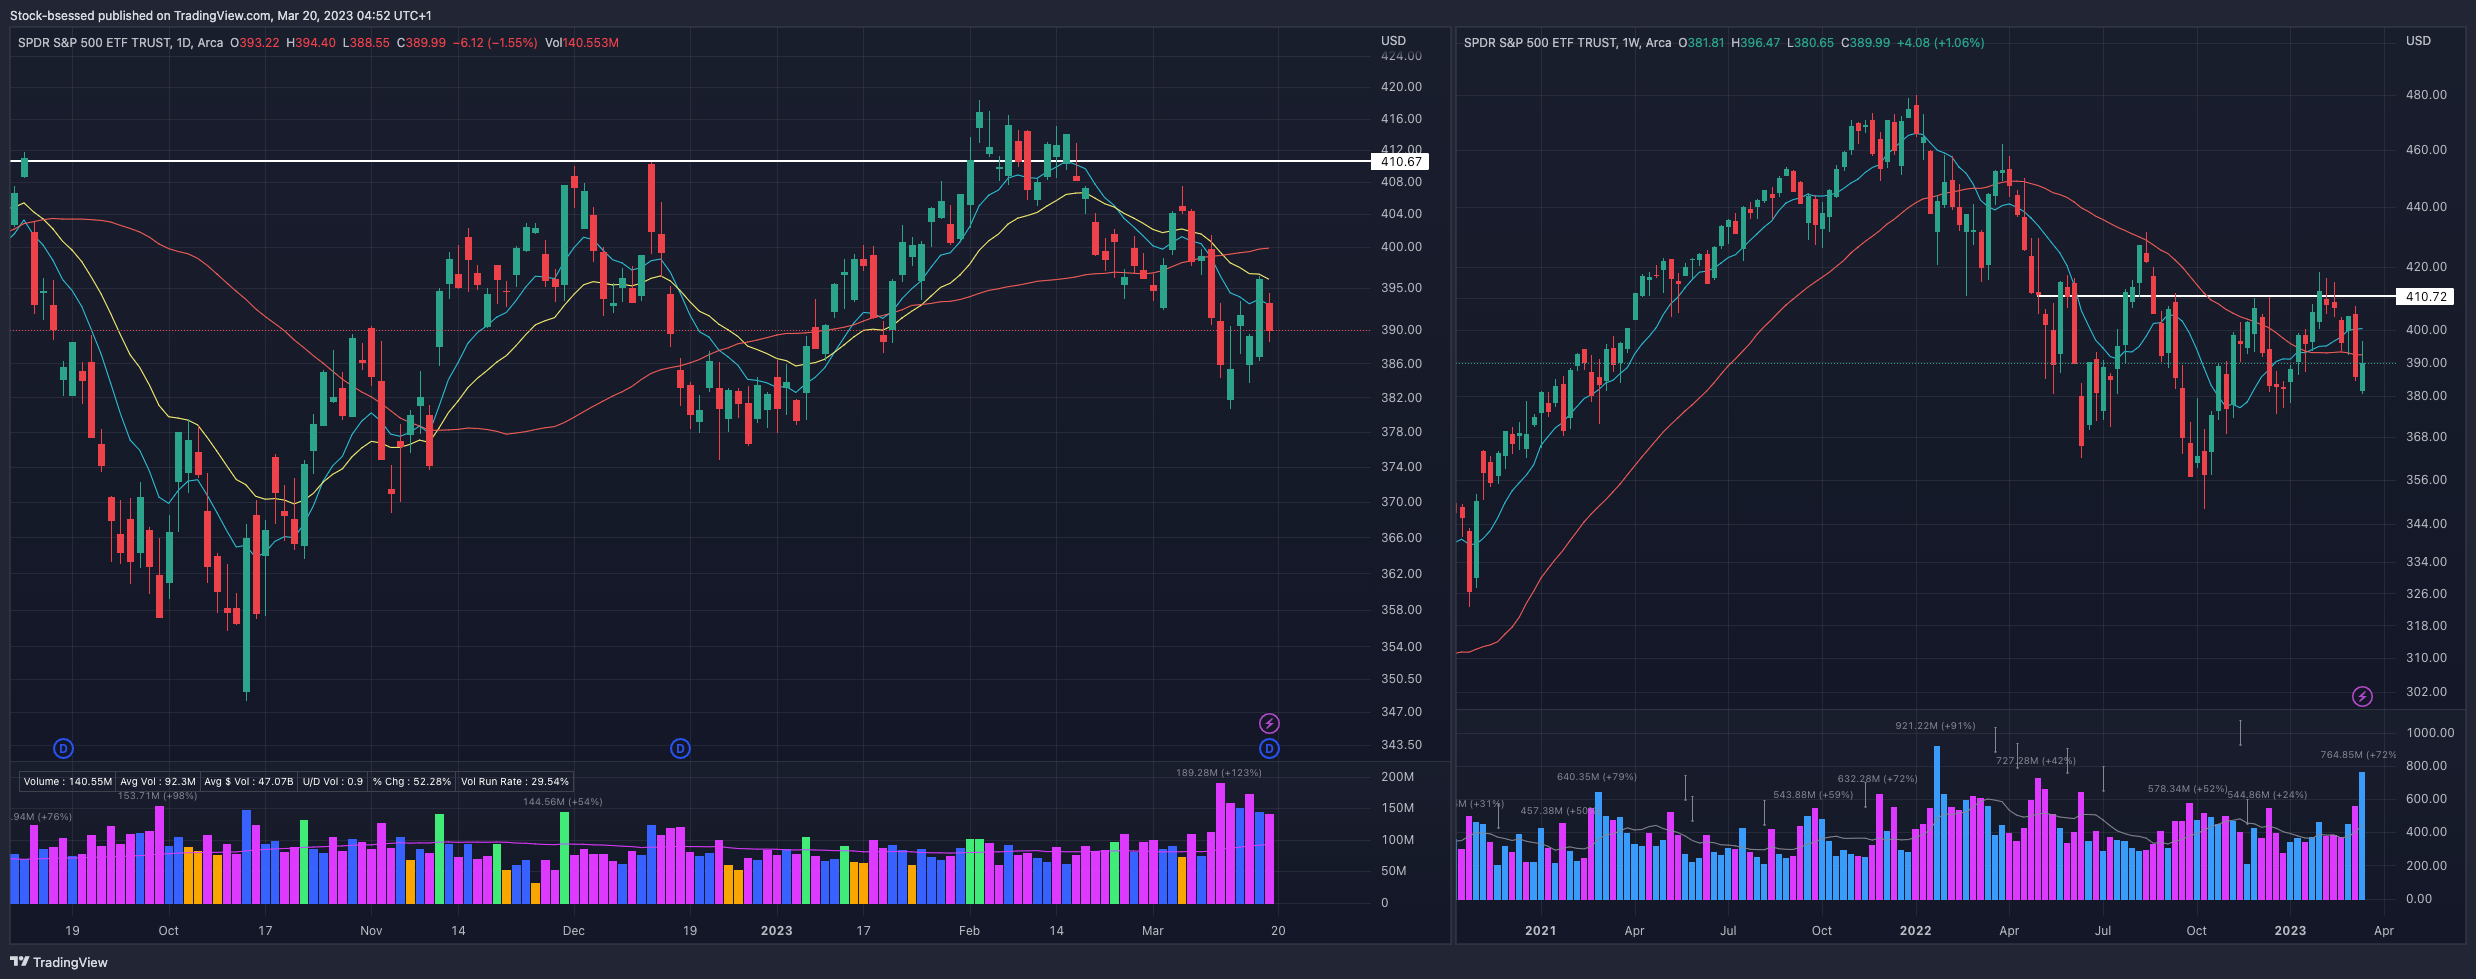
SPY 0.00%↑ Still struggling to decisively reclaim the short-term moving averages after stalling out at the 20EMA on Thursday and losing the 10EMA once again last session. Potential bear flag forming on the daily chart:
QQQ 0.00%↑ A nice recent shakeout right below the 50DMA with subsequent follow through to reclaim the 10 and 20EMAs before pushing out and breaking above the DTL rather quickly with little rest. Weekly chart on the right shows the importance of the 309-310 level where resistance was found this week:
IWM 0.00%↑ Clearly the weakest index here where a loss of 170 may indicate further potential downside to around the 165 area. Below all key moving averages on both the daily and weekly charts with a recent pick up in volume as the selling got going:
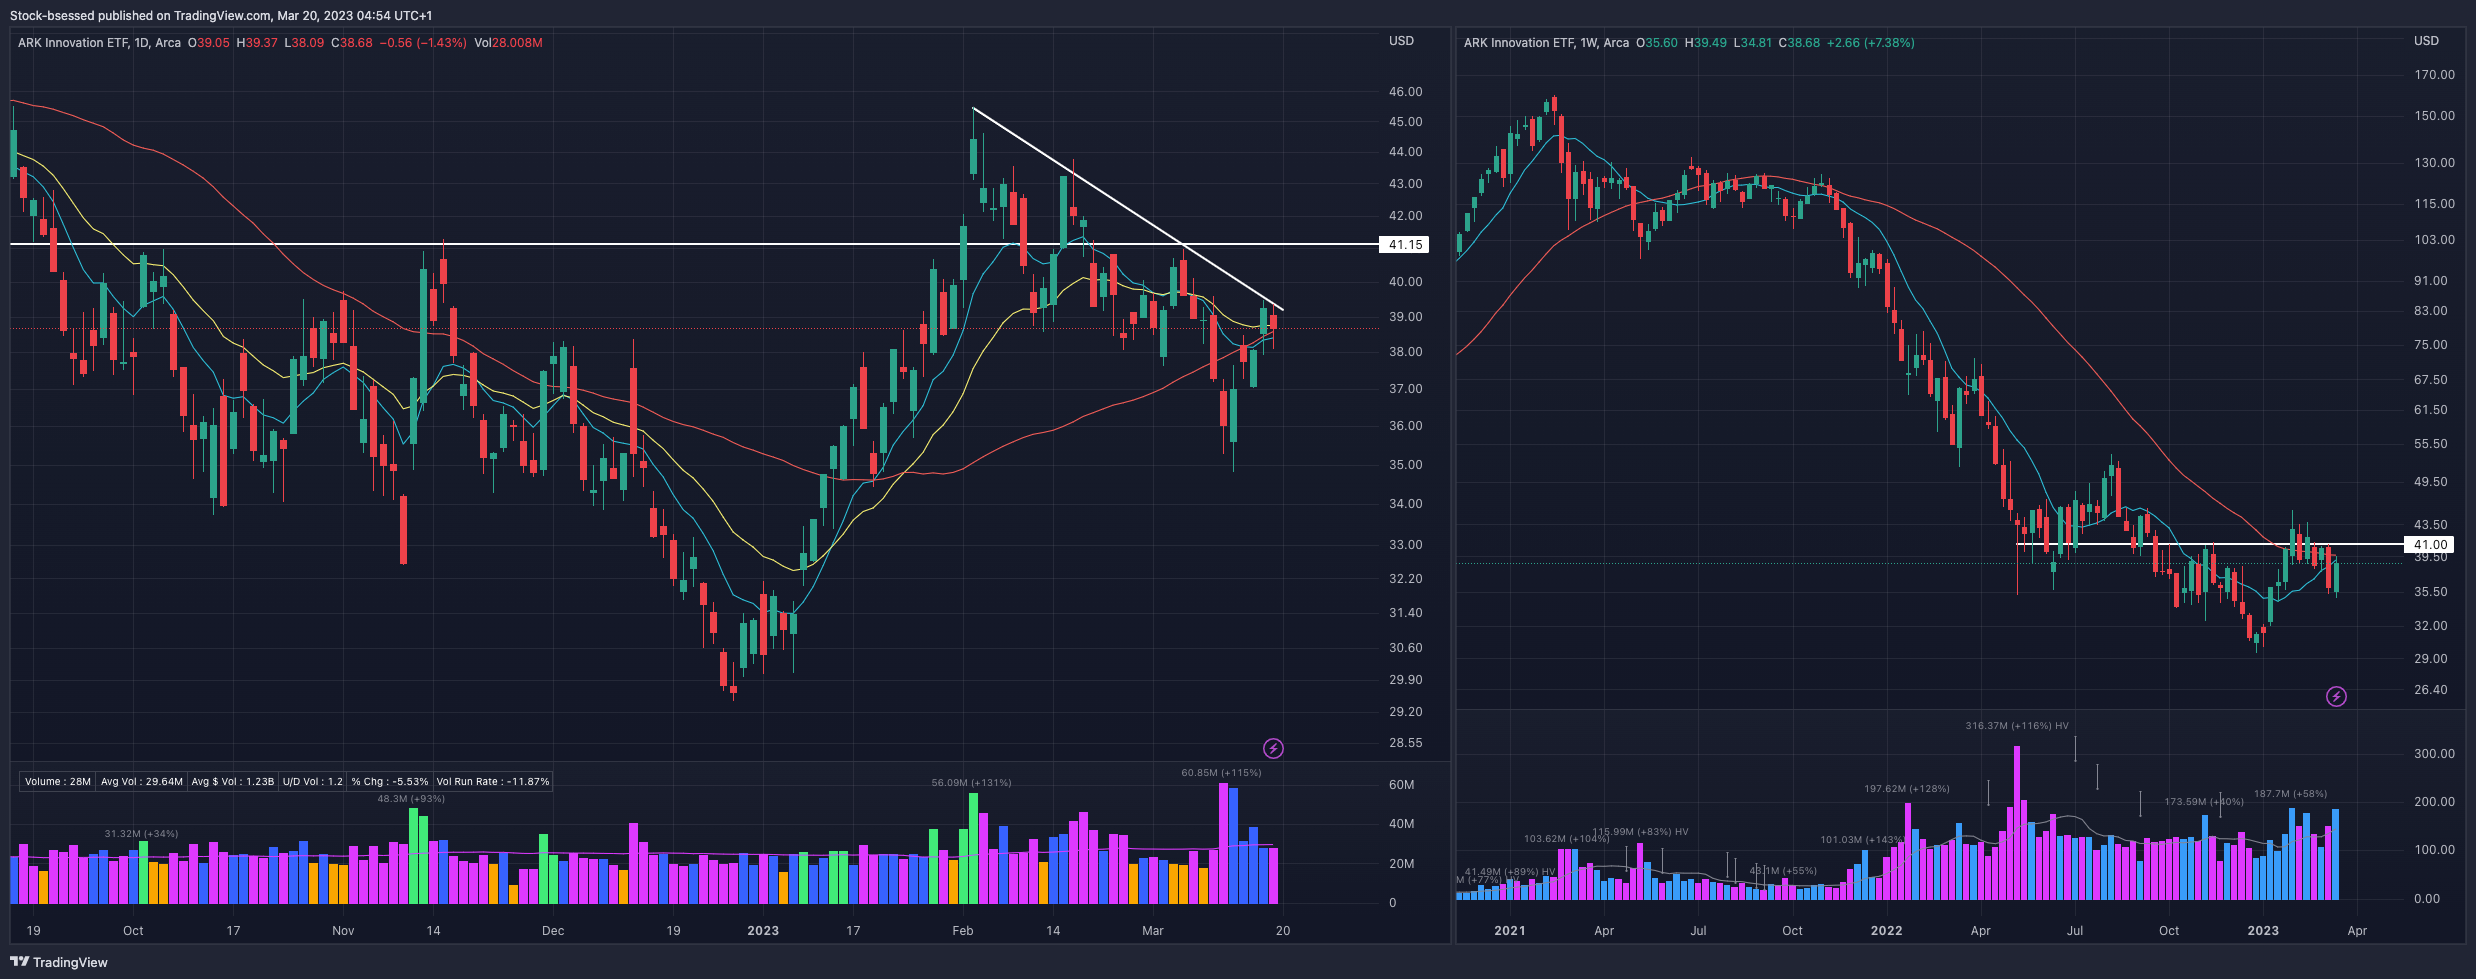
ARKK 0.00%↑ Flagging nicely with an inside day last session as it sits right at the confluence of 10 EMA, 20 EMA and 50DMA below this descending trend line:
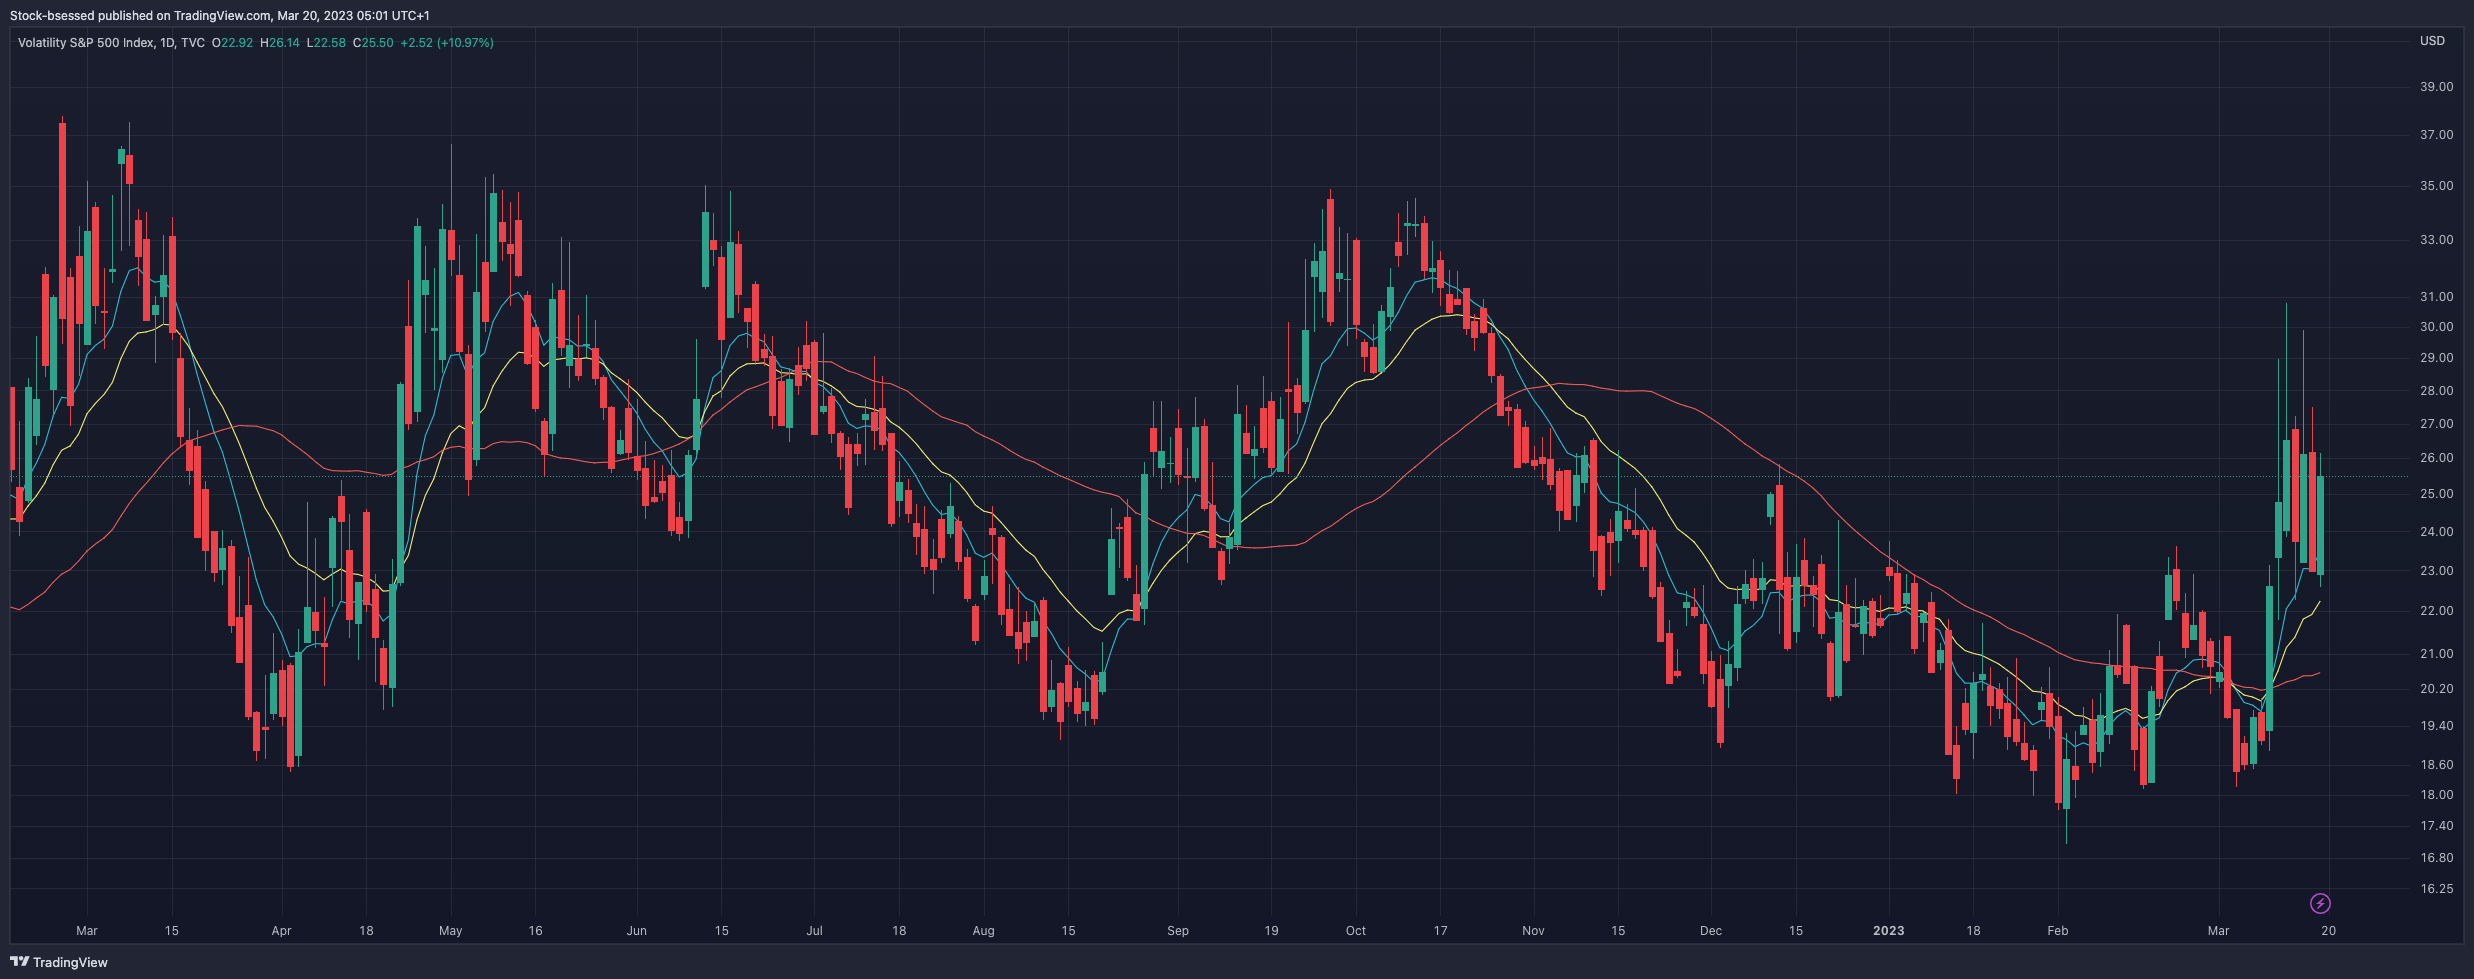
$VIX A couple recent spikes here as volatility picked up last week - would not be opposed to seeing more of a drastic spike in order to align with a more concrete potential bottom
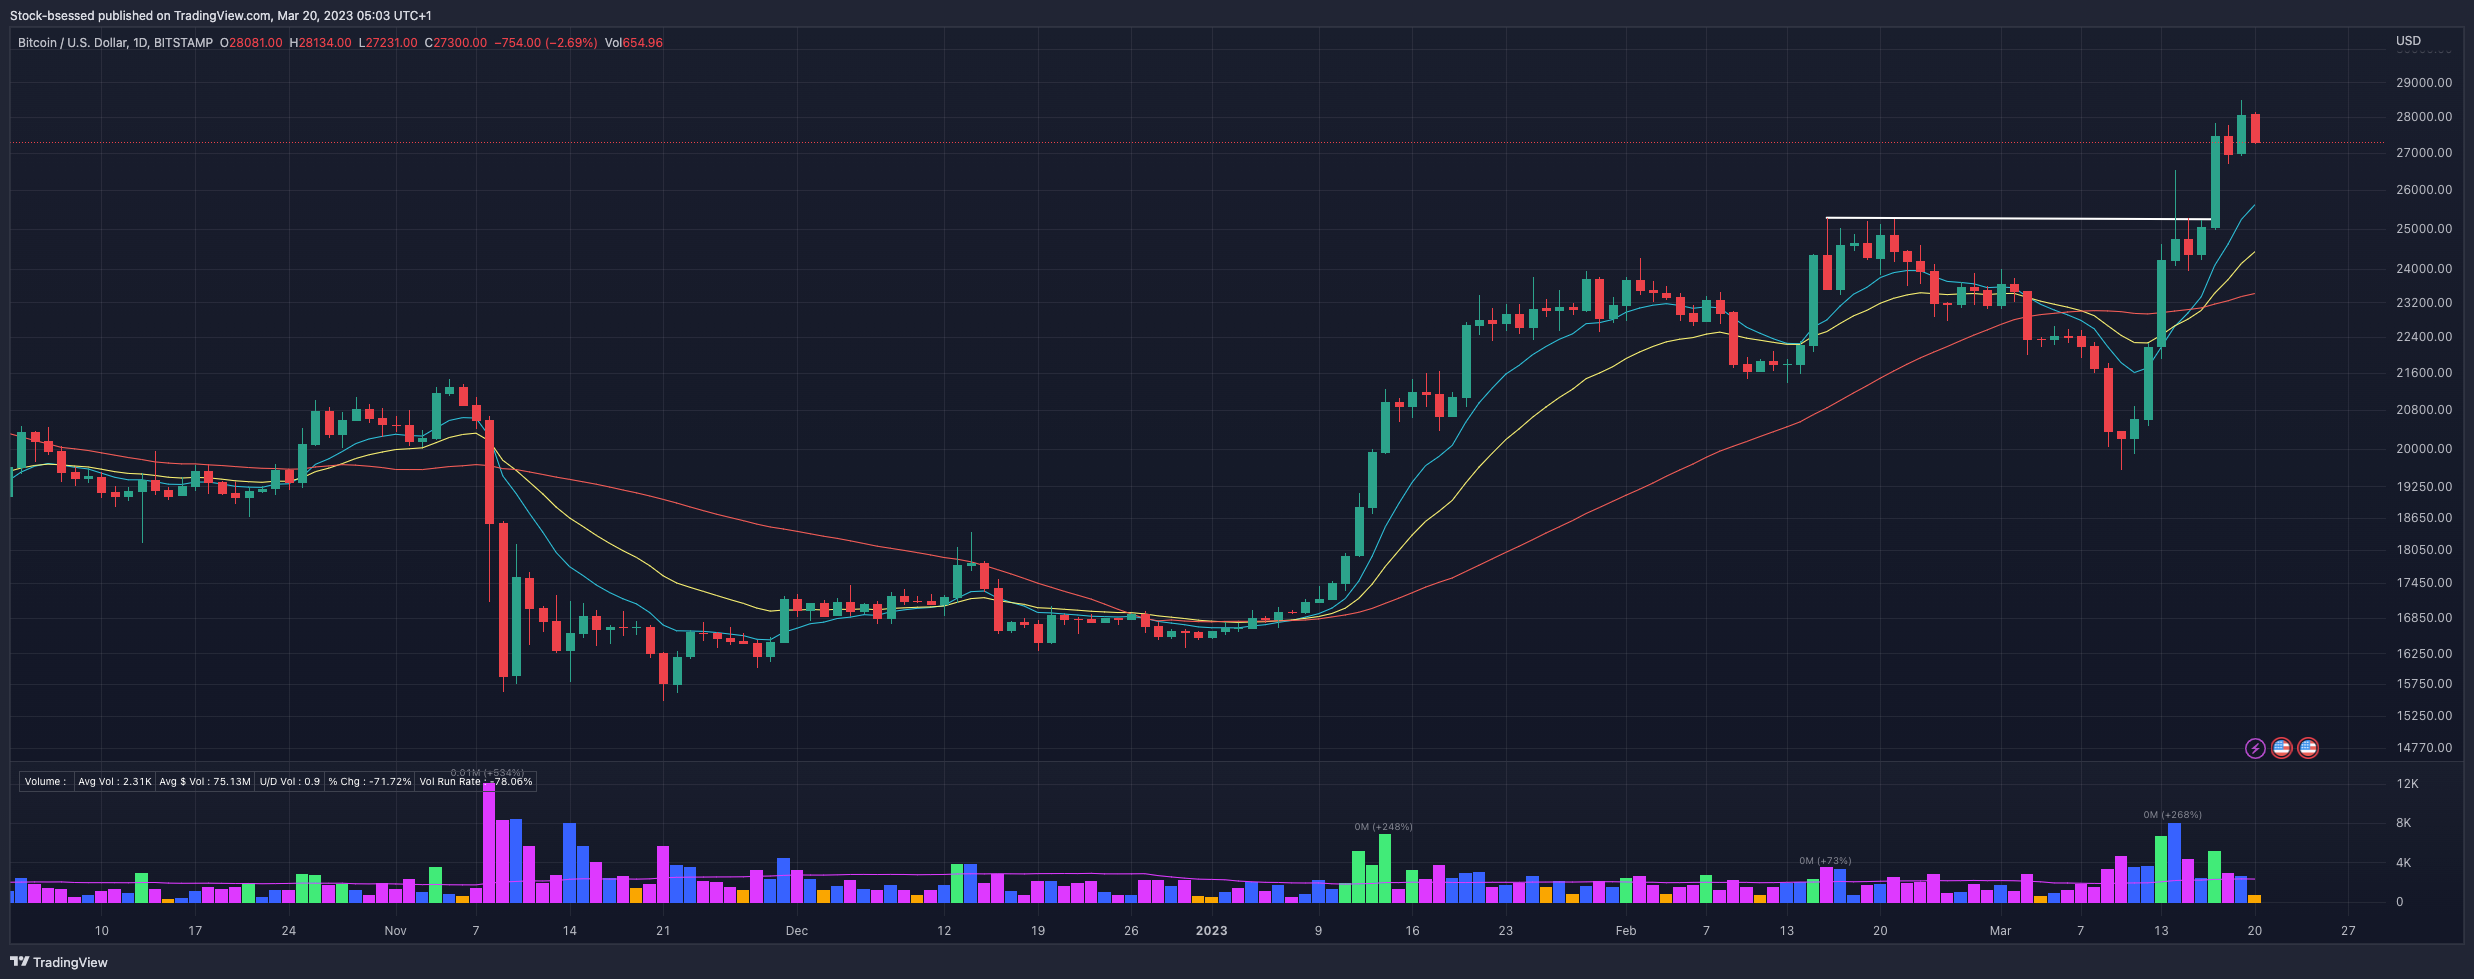
$BTC Bitcoin continues outperforming as the digital gold narrative may be gaining steam after the recent traditional banking system debacle
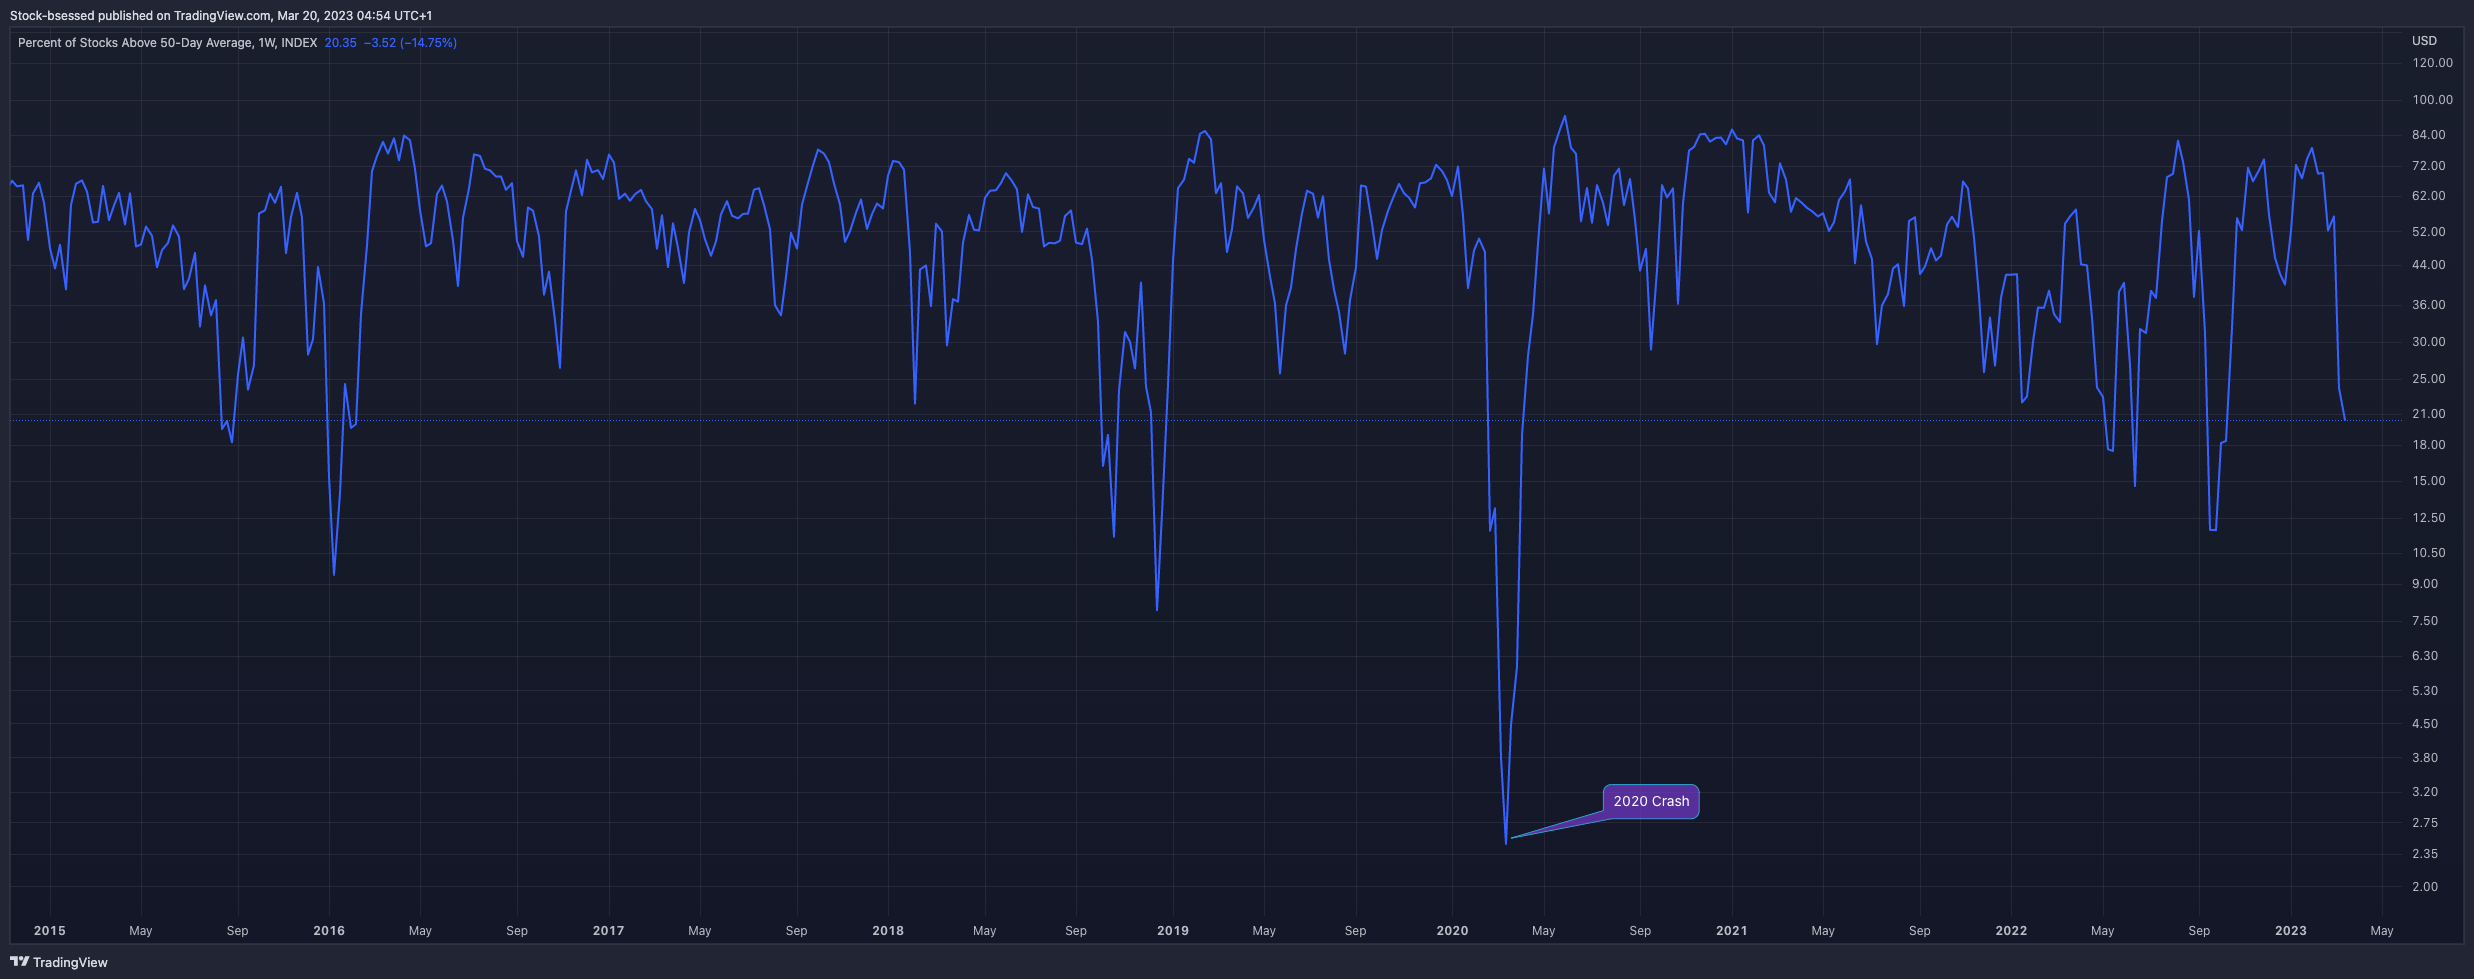
MMFI - PERCENT OF STOCKS ABOVE 50-DAY AVERAGE
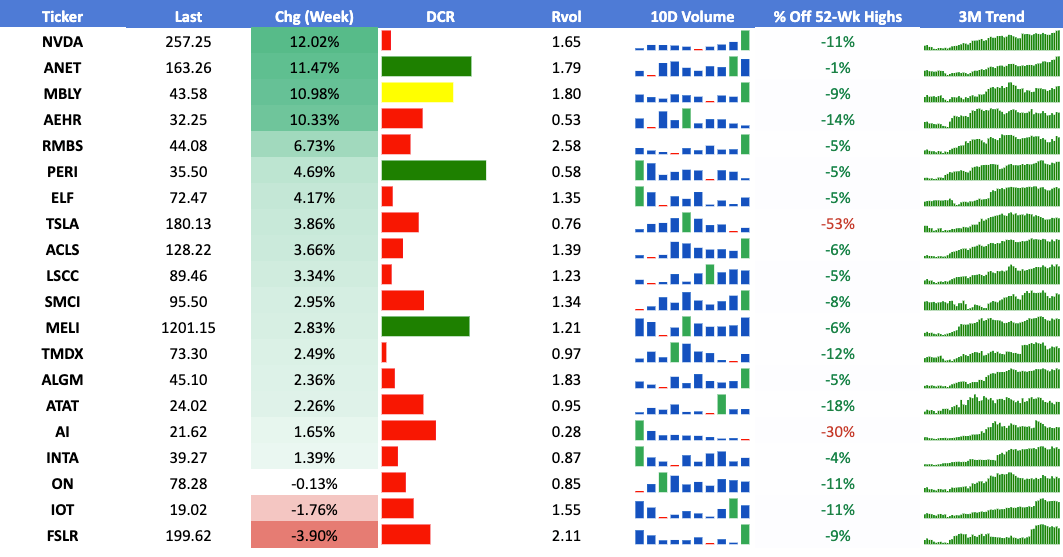
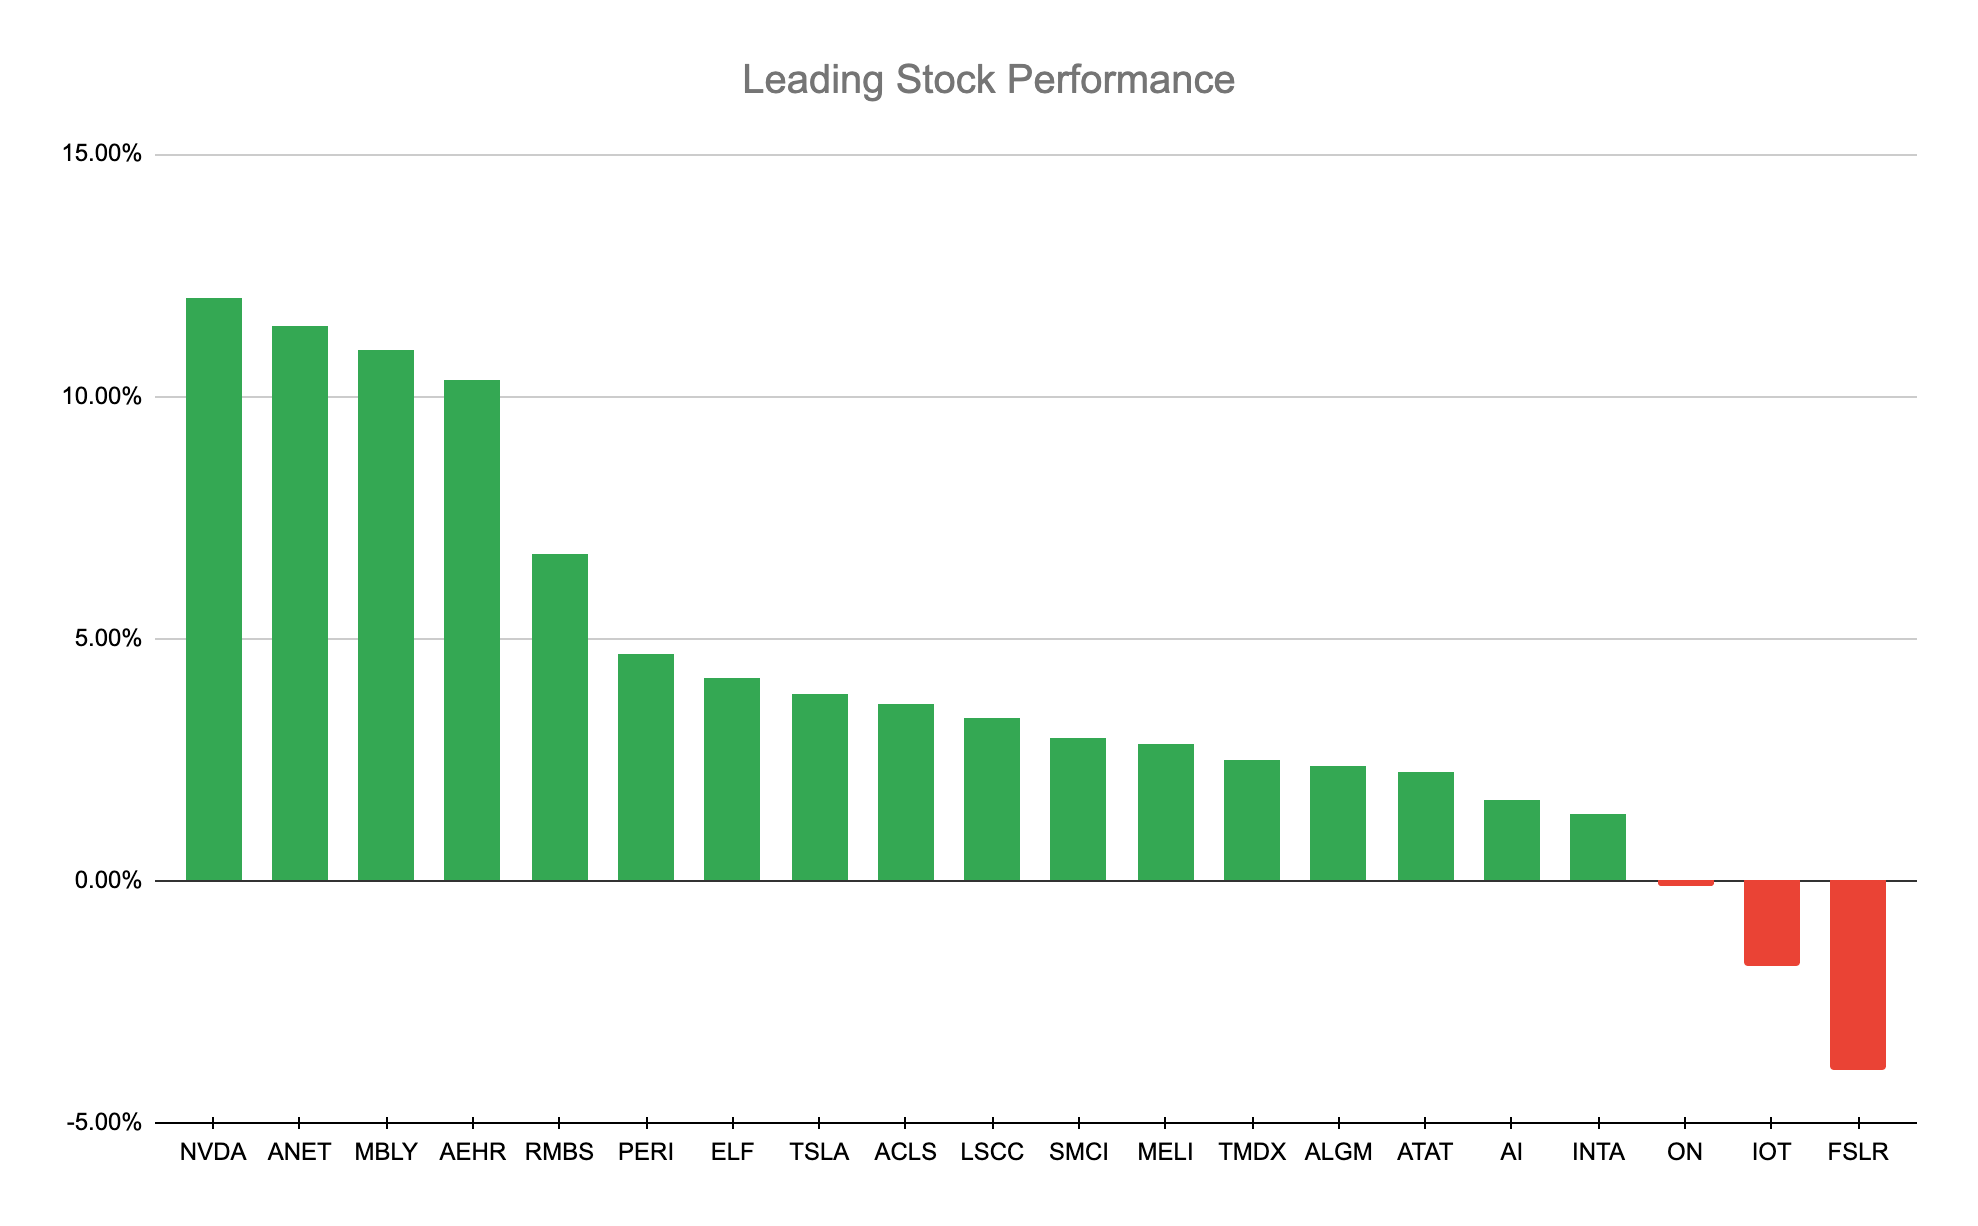
Leading Stocks Analysis
Daily:
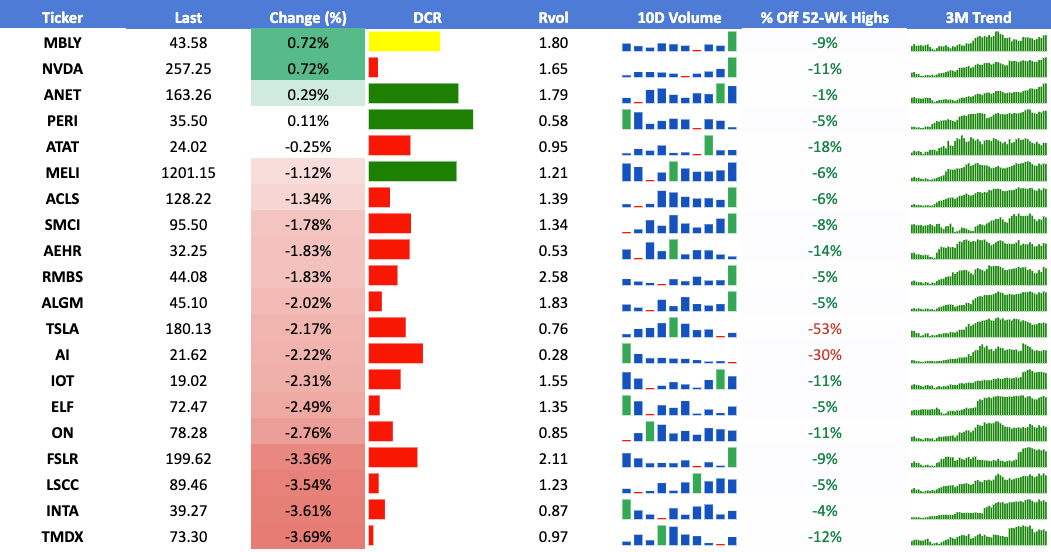

I am linking the leaders watchlist in tradingview for your convenience, here
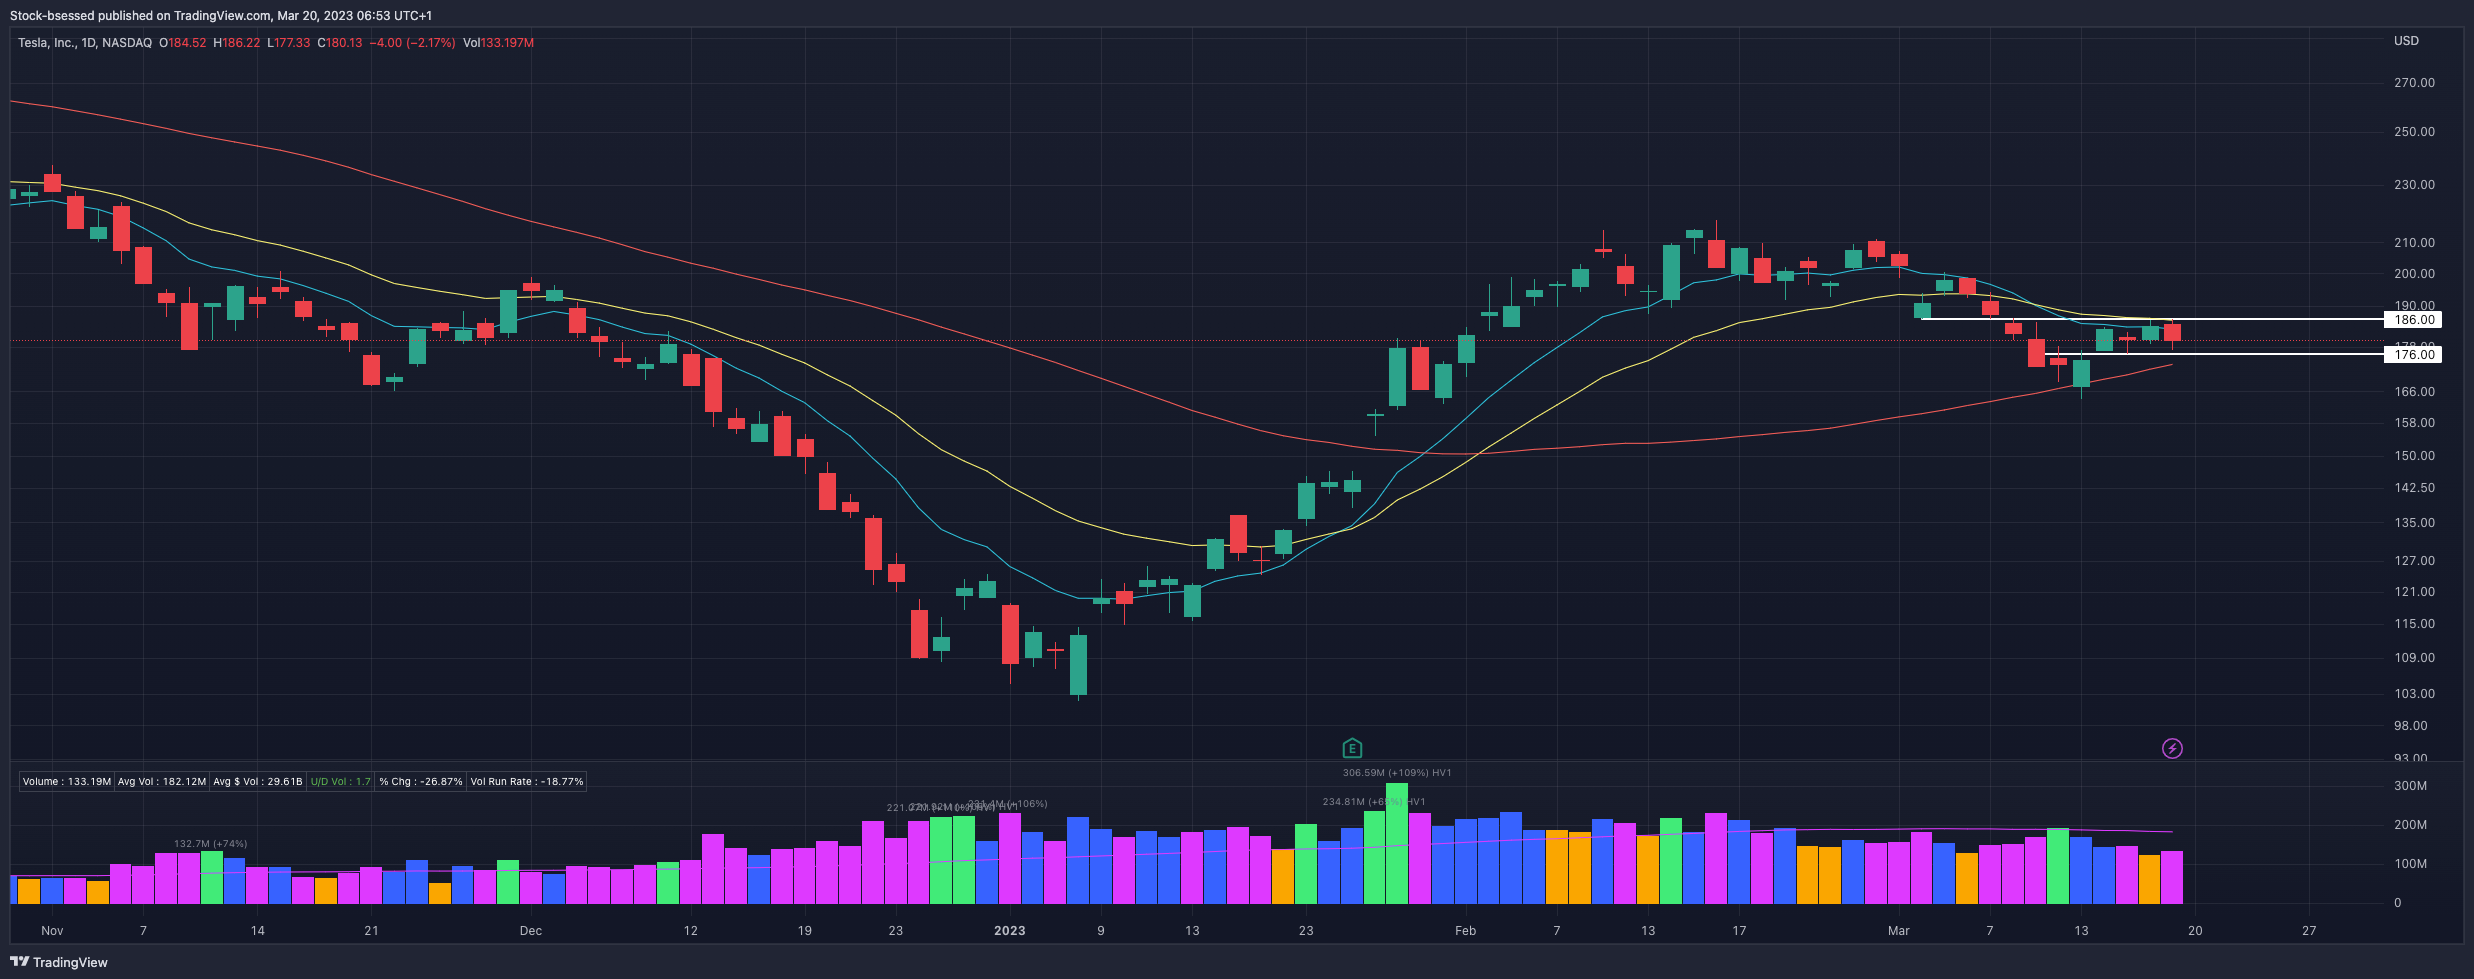
TSLA 0.00%↑ Now between this important 186-176 area as it also struggled with short-term KMAs this week and will now be watching for a break of either direction to indicate any potential trend:
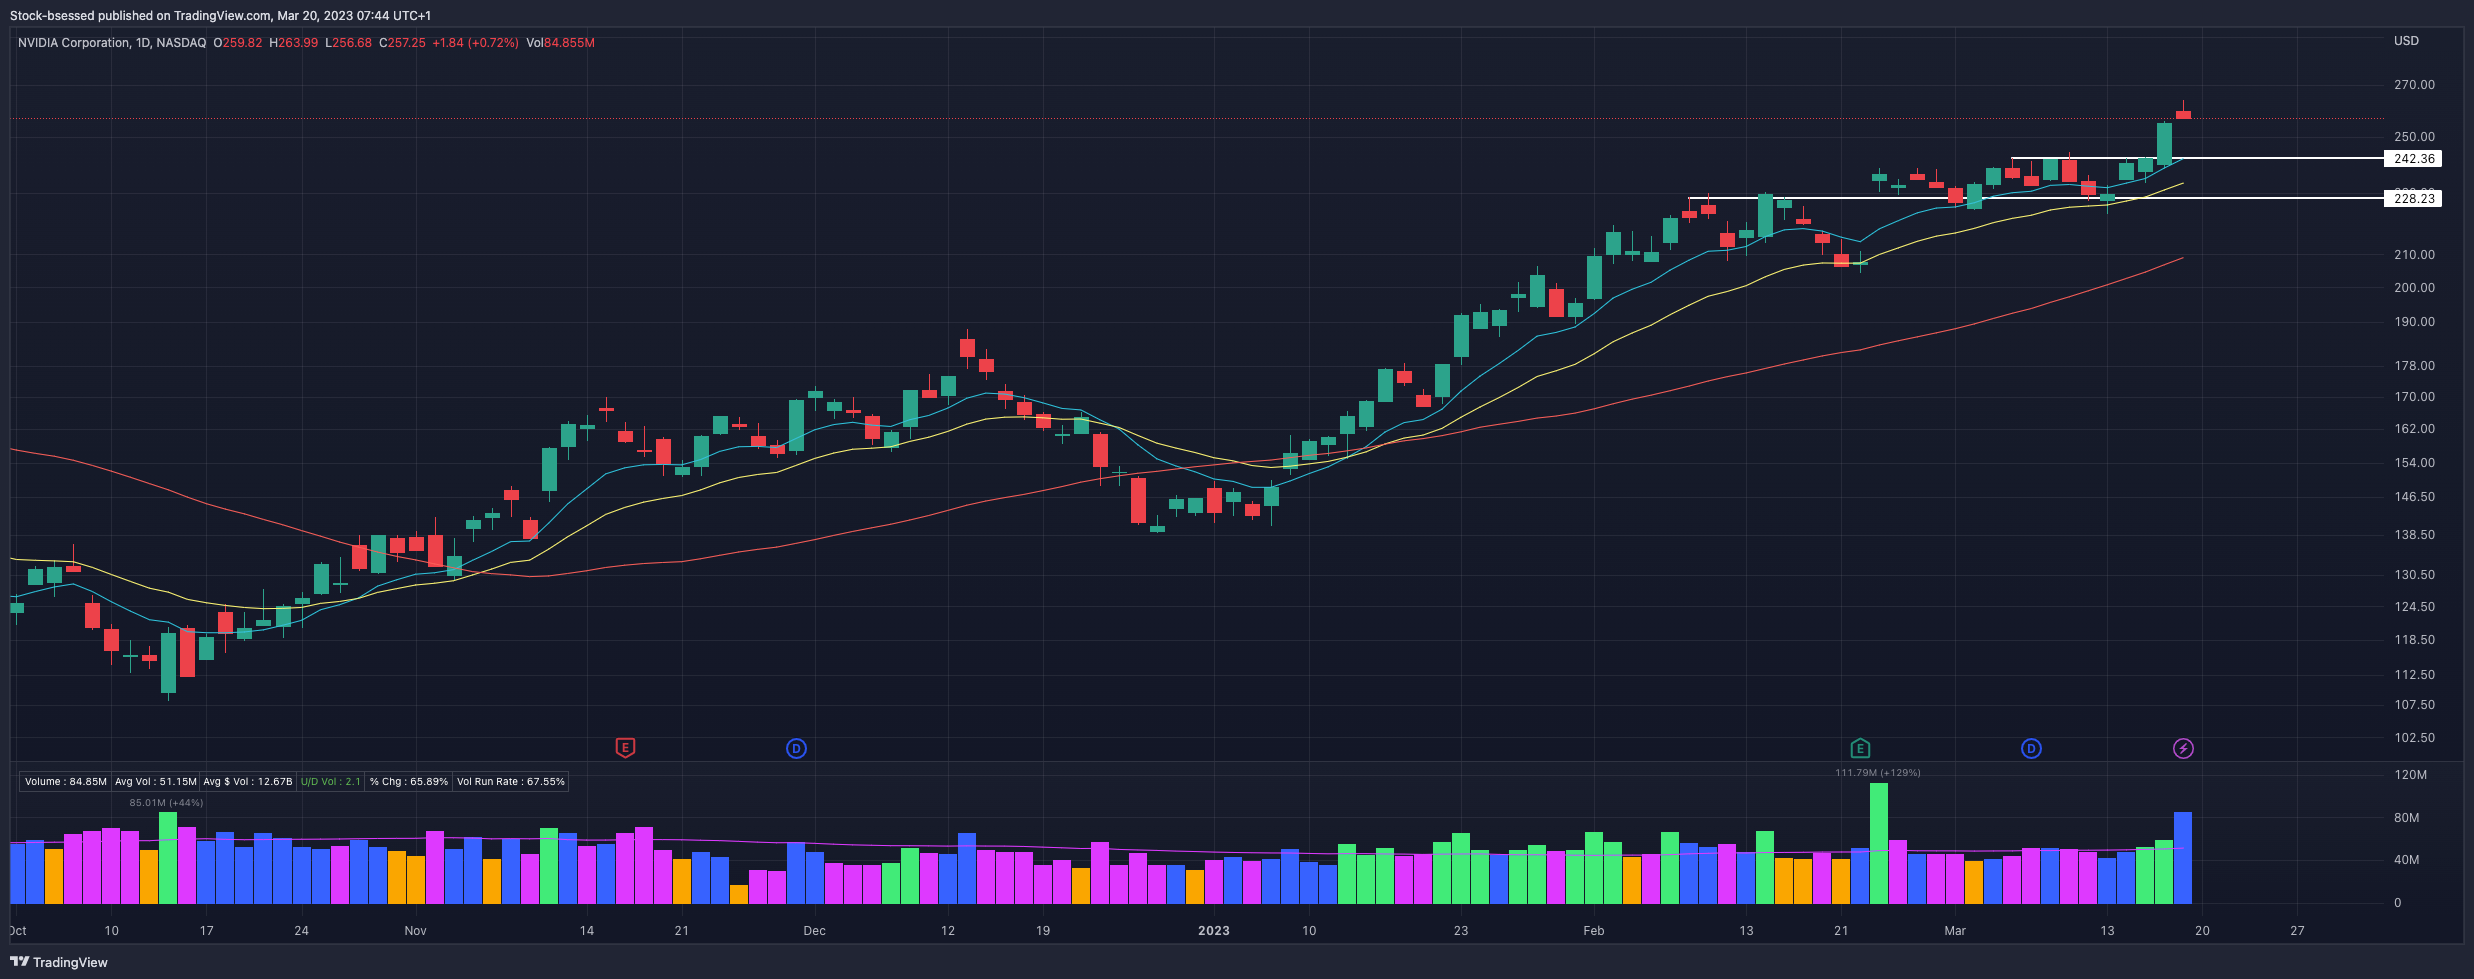
NVDA 0.00%↑ Nvidia continues to show clear relative strength, backed by institutional demand and overall group strength due to semiconductor outperformance - this liquid leader is one to keep on watch for additional setups:
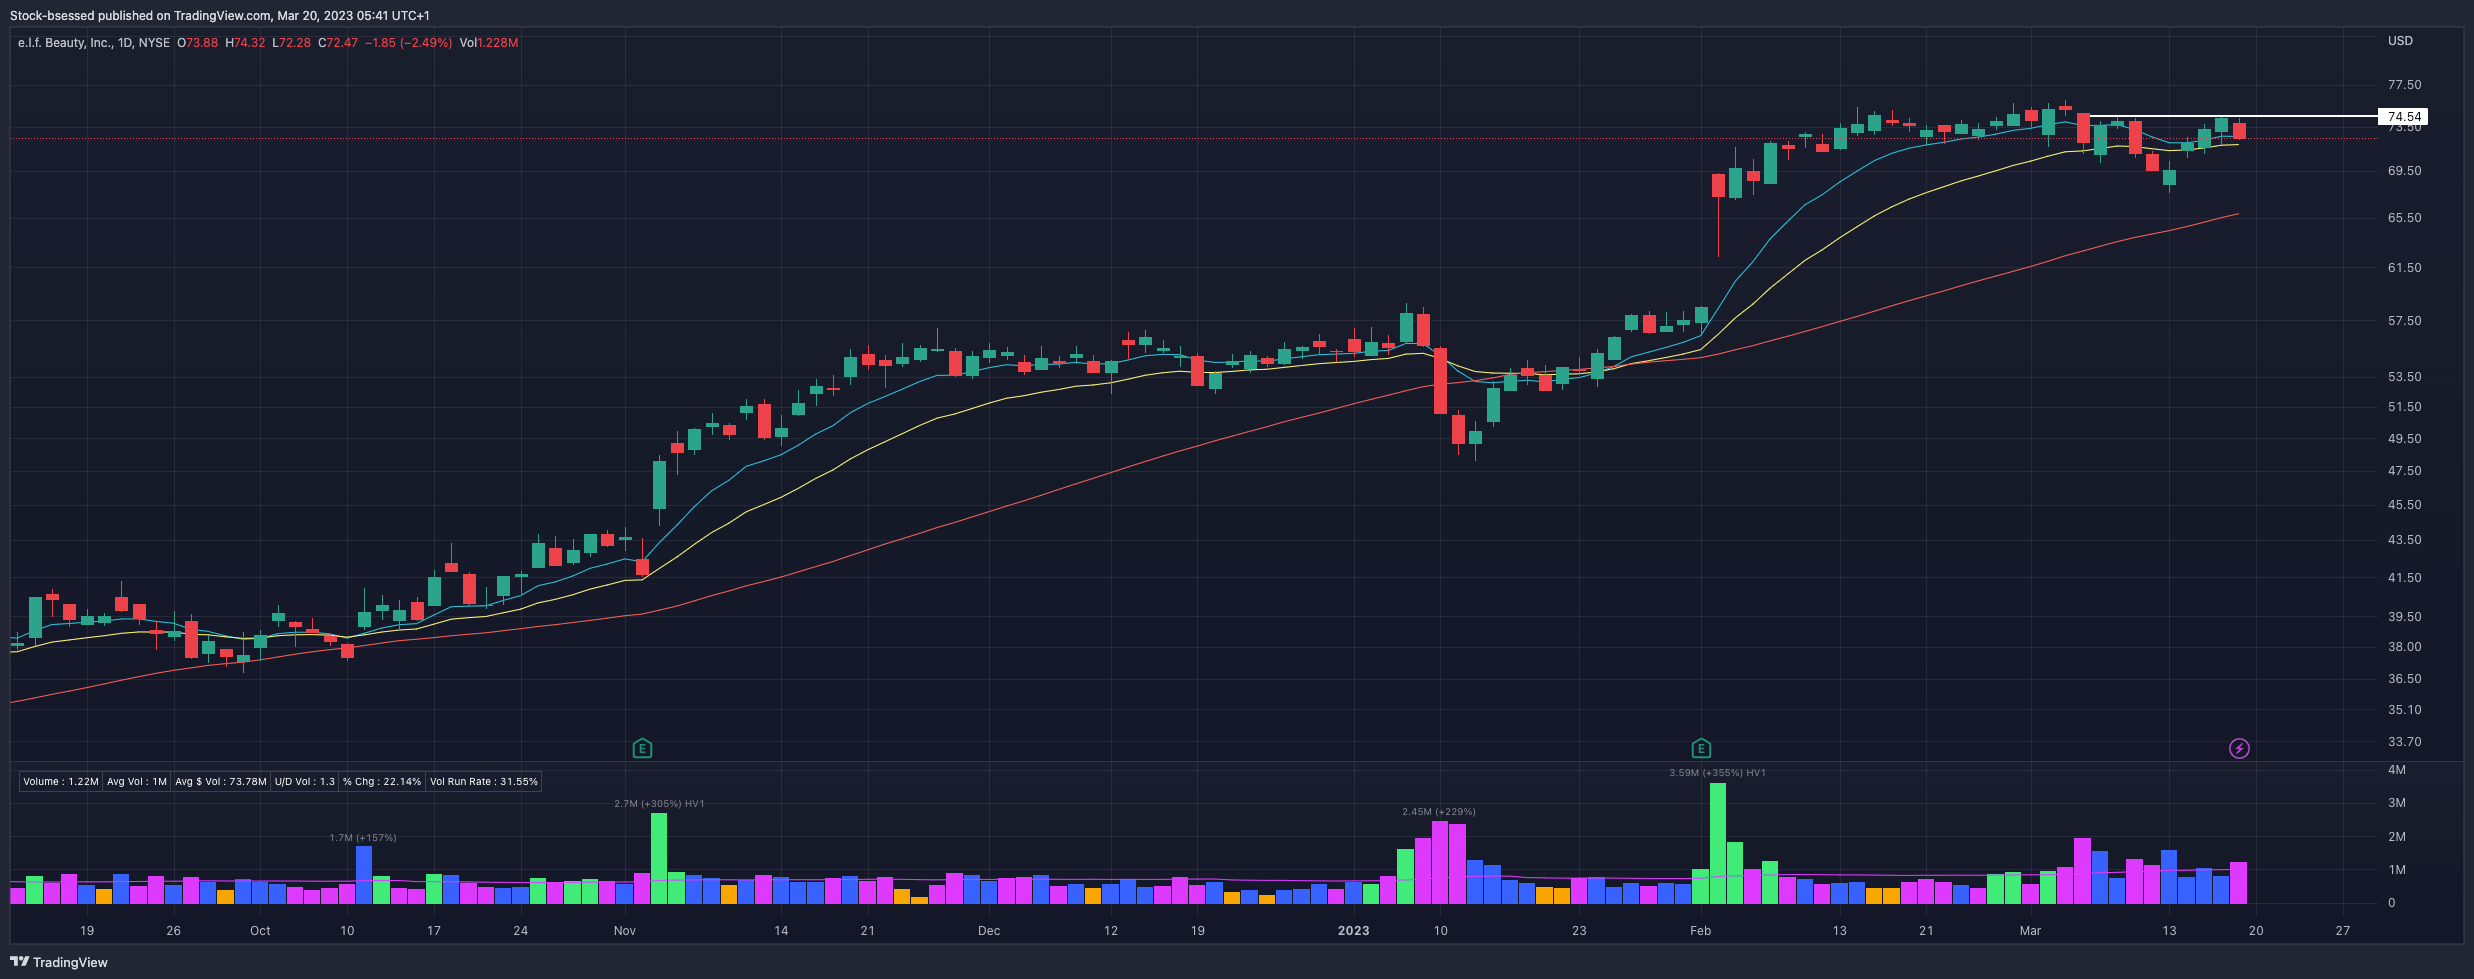
ELF 0.00%↑ Reclaims the 20EMA after a recent shakeout and continues grinding higher after a positive earnings report. Does not seem to be one that really gets going with momentum but rather grinds upwards in a slow and steady fashion trending along KMAs:
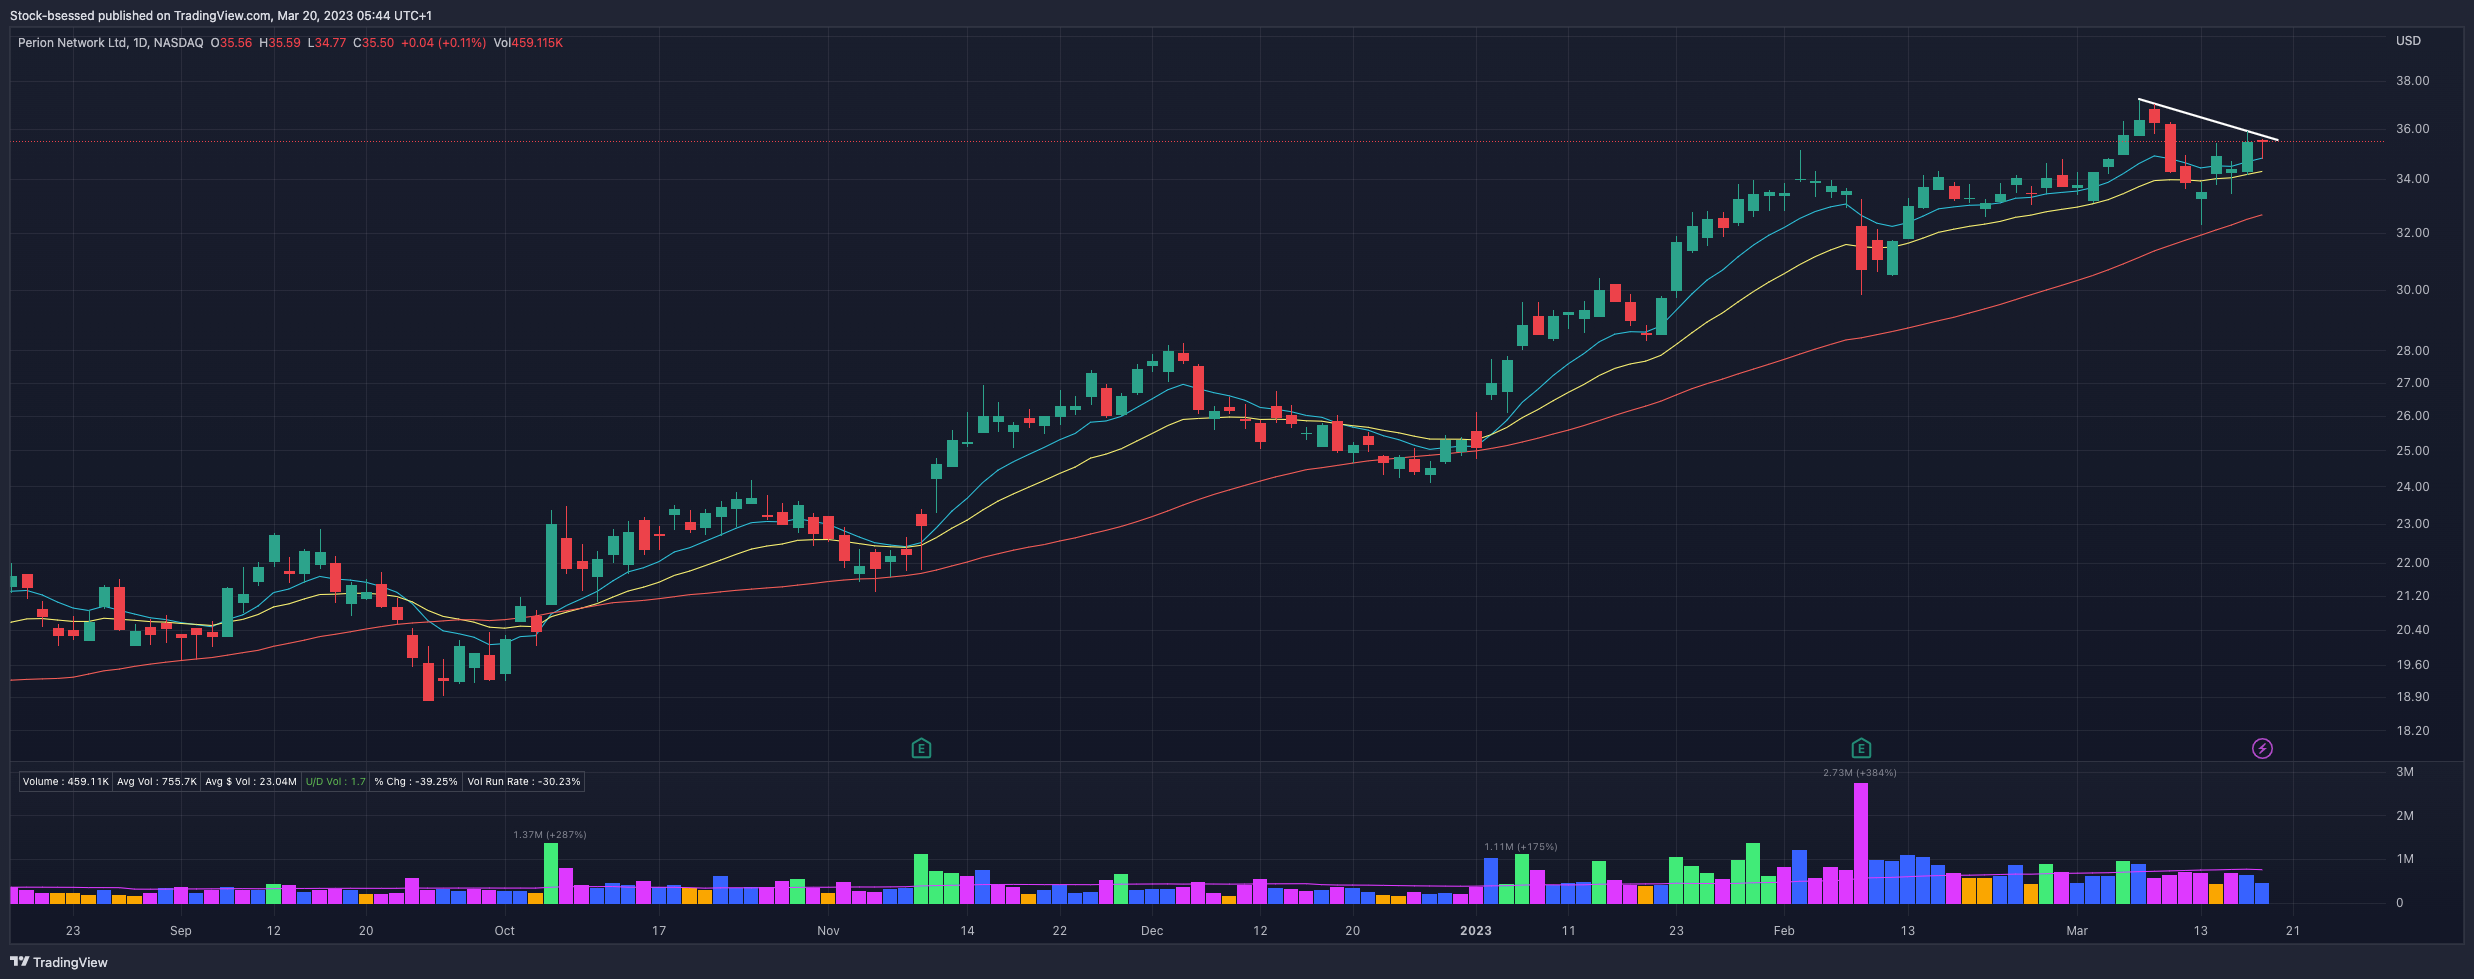
PERI 0.00%↑ Closes with a strong DCR after finding buyers intra-day at the 10EMA and may now need some time to tighten up more right under this DTL:
IOT 0.00%↑ Continues flagging above the 20EMA as it pulls back slightly following an earnings-fuelled run up:

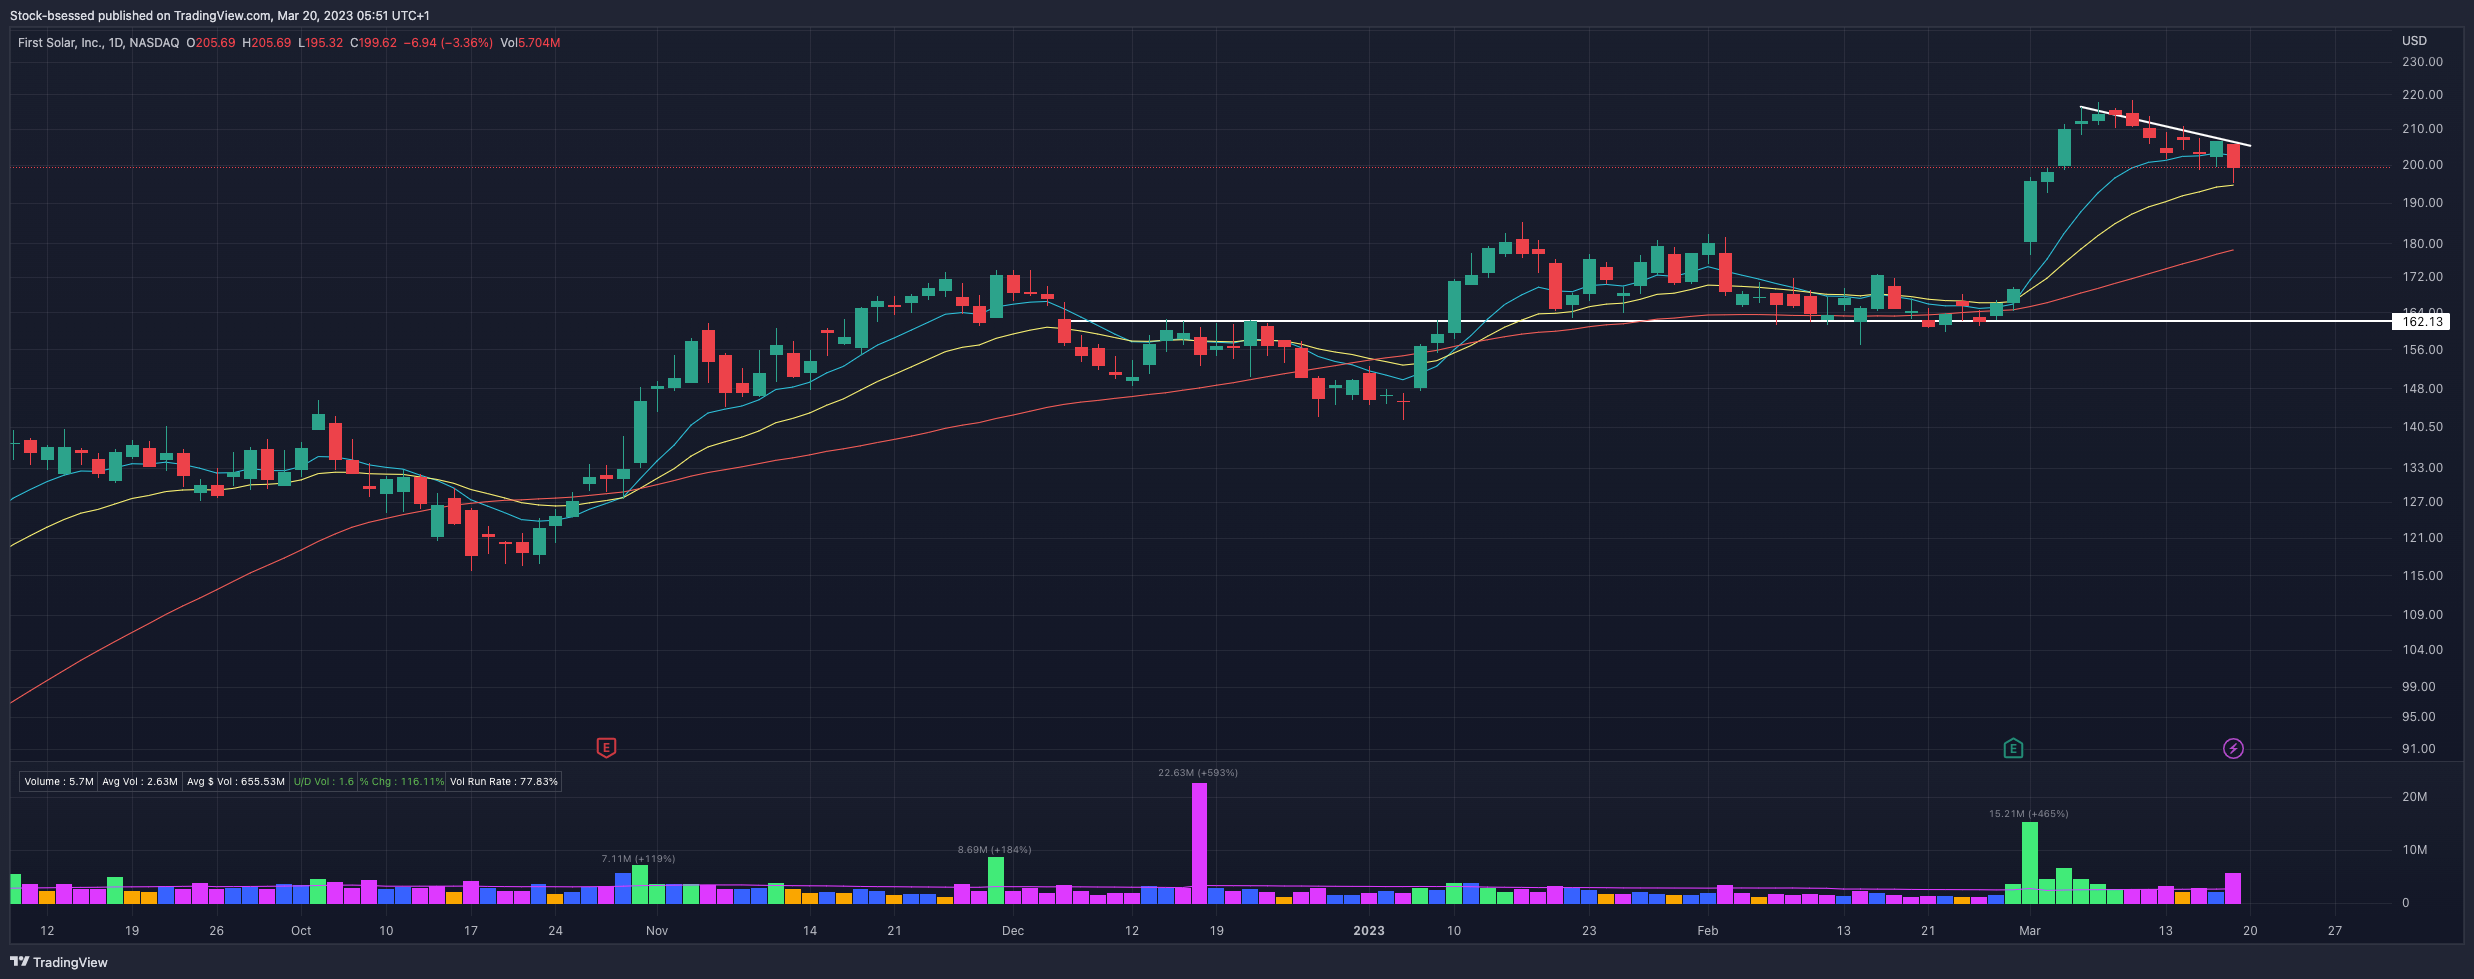
FSLR 0.00%↑ Closes just under the 200 whole number but manages to hold the 20EMA once more on this pullback, would prefer seeing stronger closes but interested in how this will act on strength vs the DTL above:
Weekly:
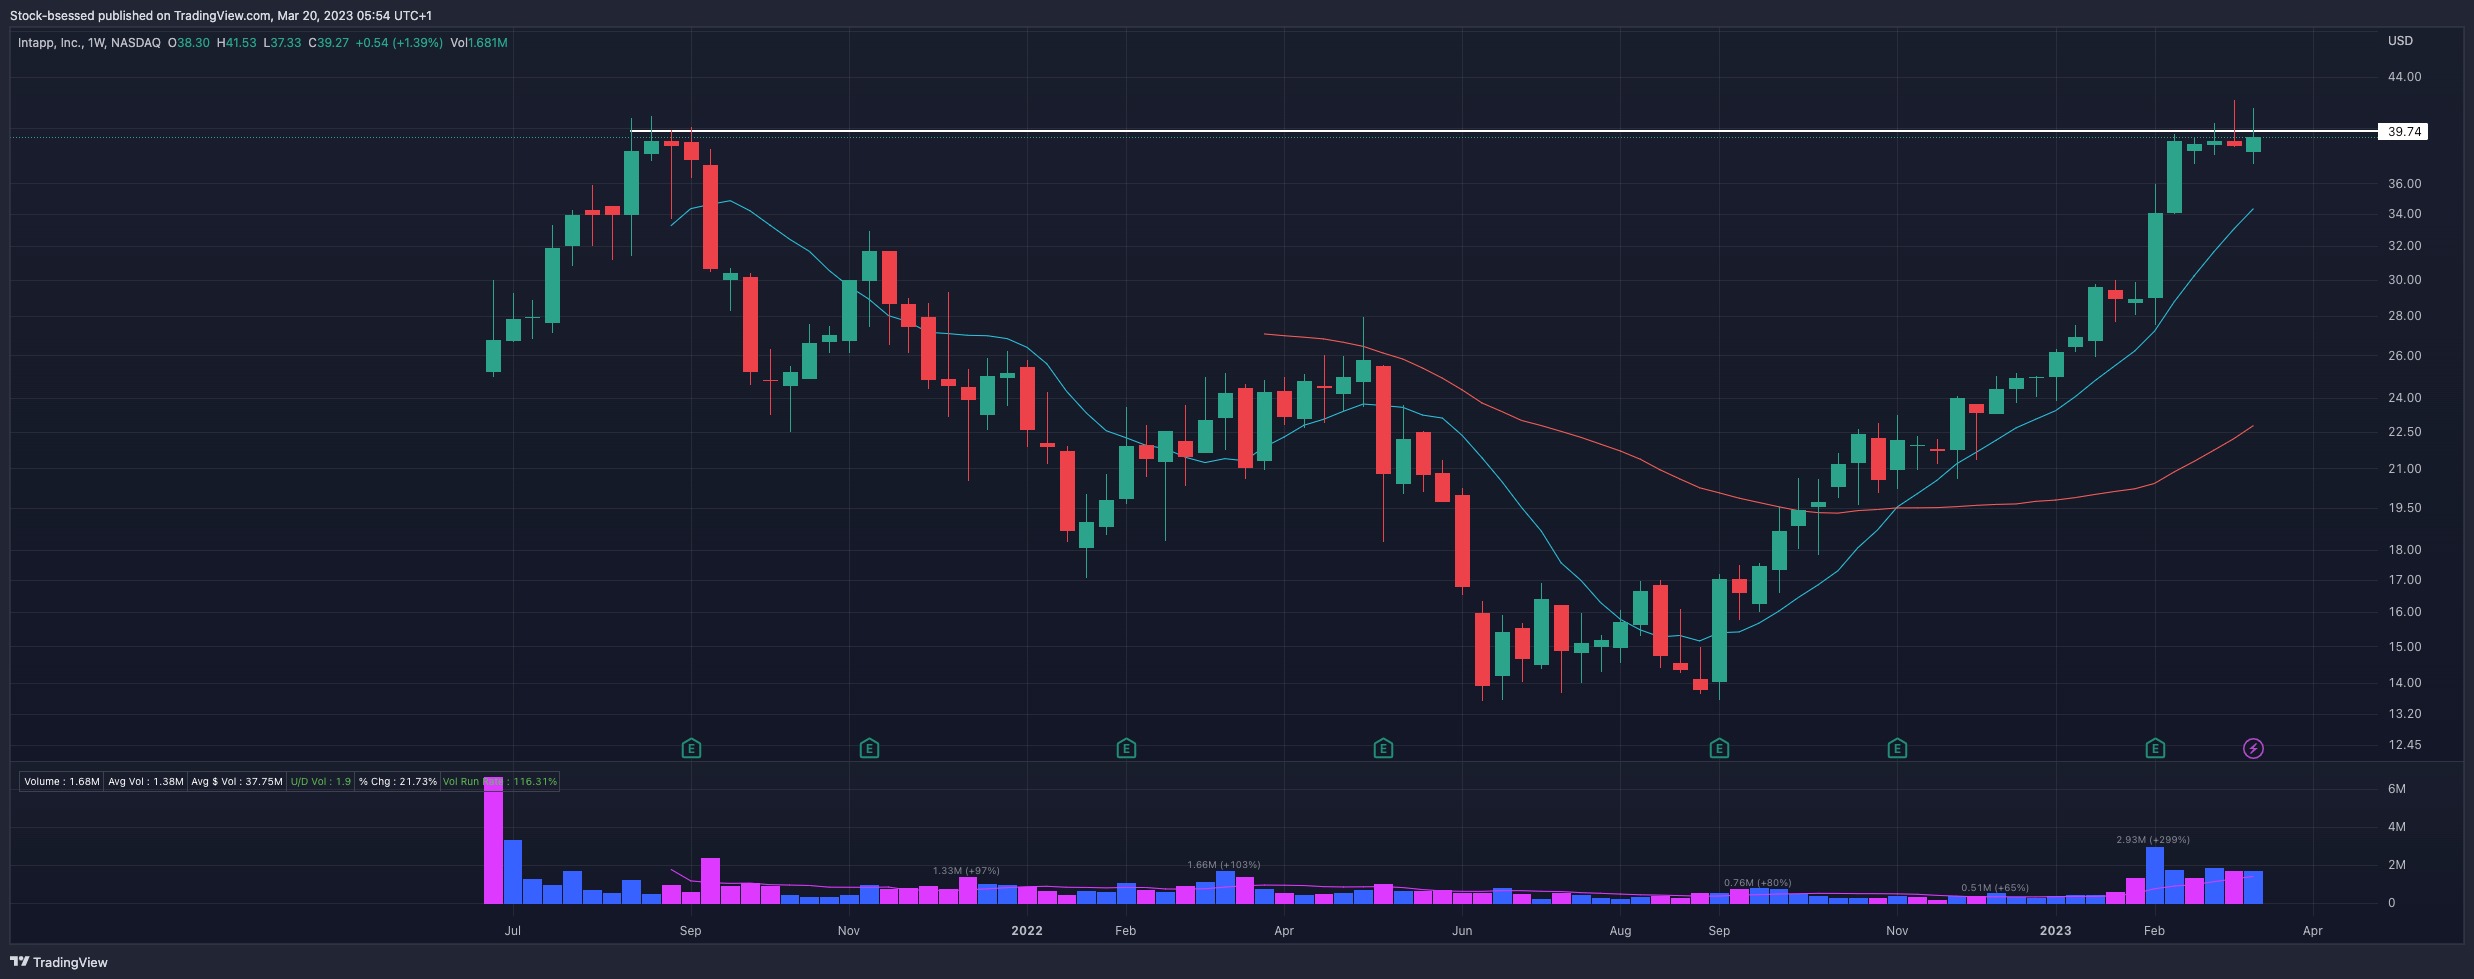
INTA 0.00%↑ This young IPO is getting may be setting up here at all time highs with tight closes the last 5 weeks as it sits right under this 40 area:
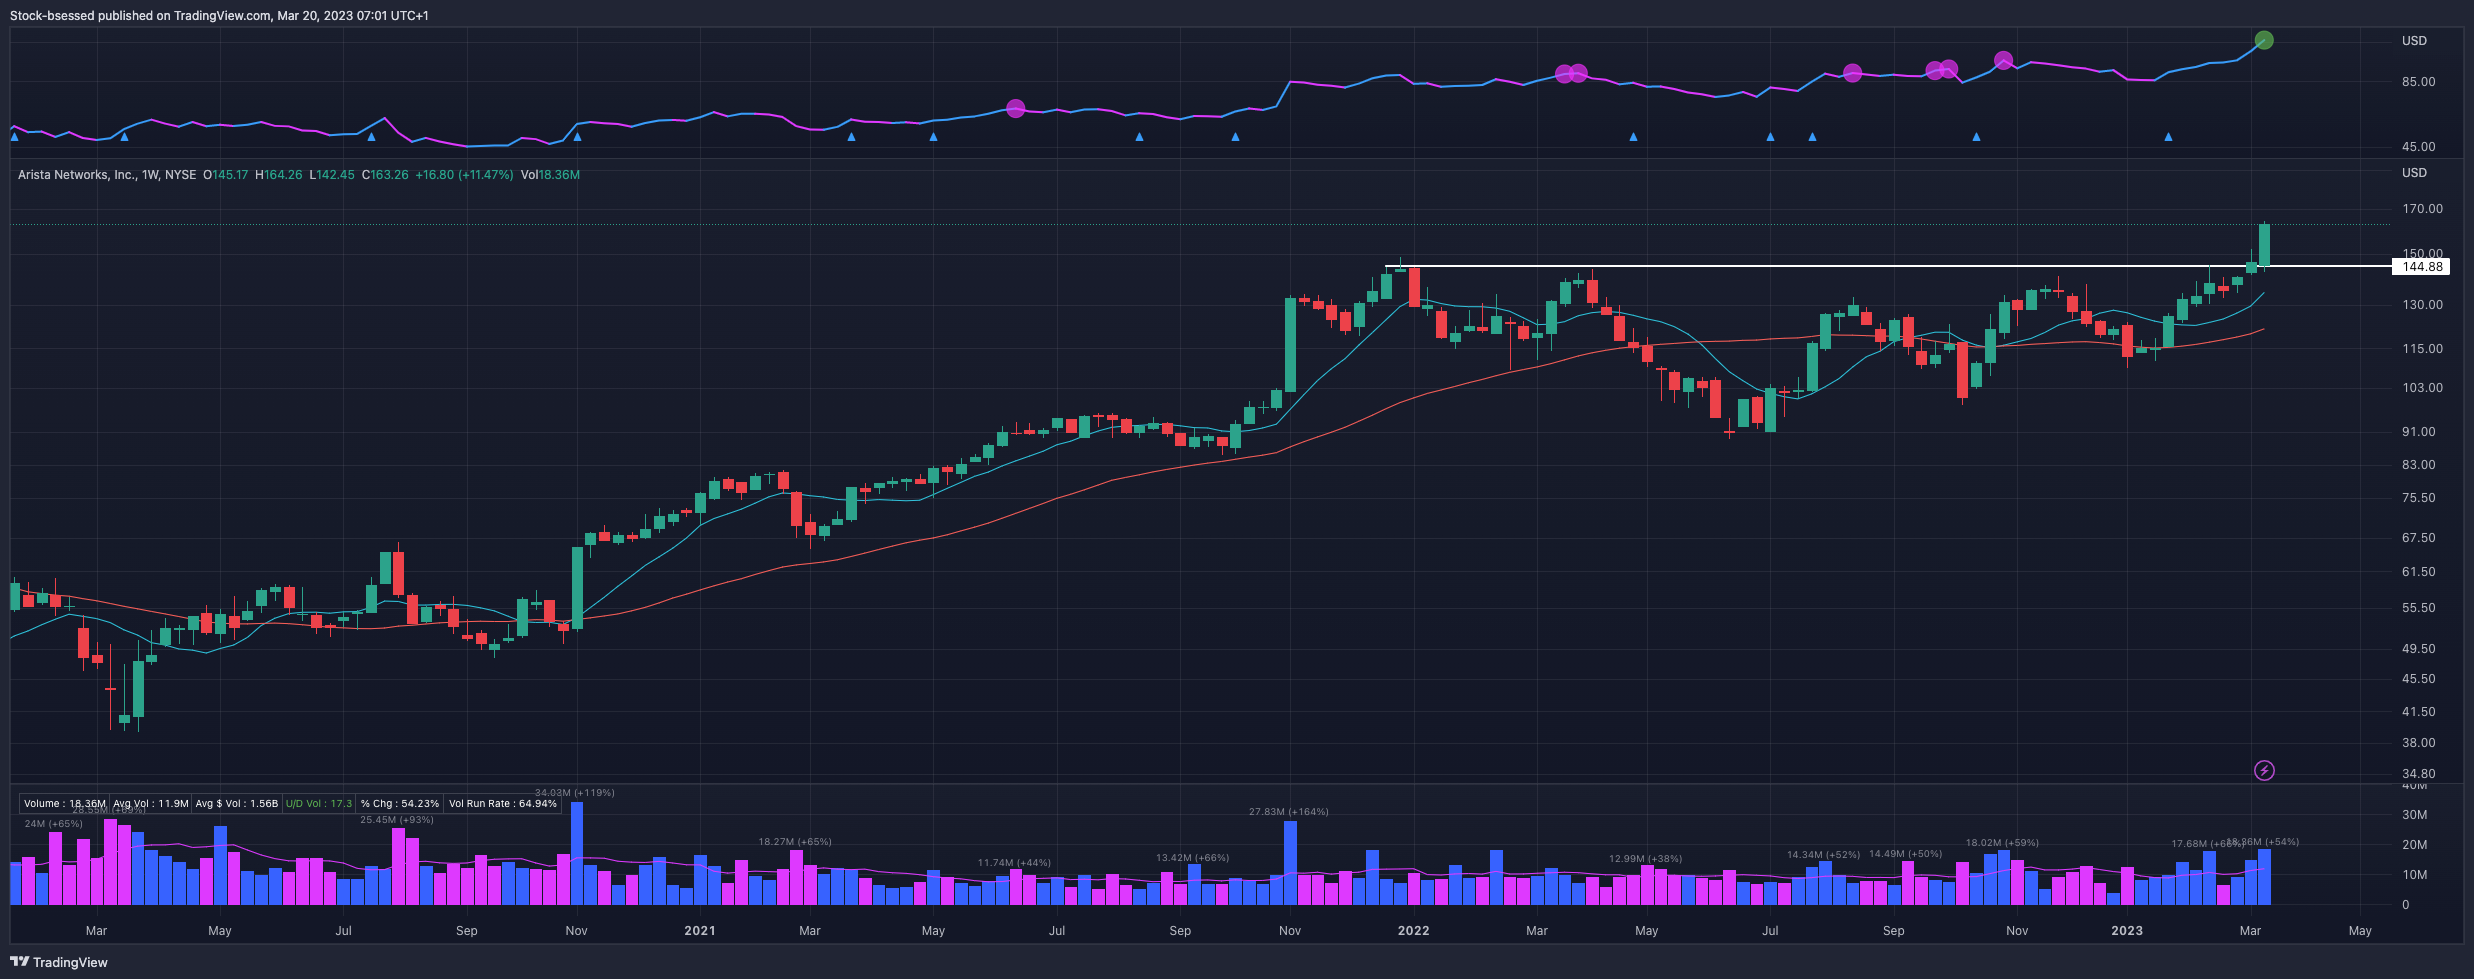
ANET 0.00%↑ Excellent strength here with clear RS as the base was being built and now pushes out to new highs on the first opportunity as the market pressure eases off slightly - showing clear leadership capabilities as it is acting like a basketball under water:
ATAT 0.00%↑ Continues to hold the important 23 area as it flags nicely up here and gets tight. A negative is the wicks in these candles as sellers seem to gain control of quick upward thrusts of momentum:

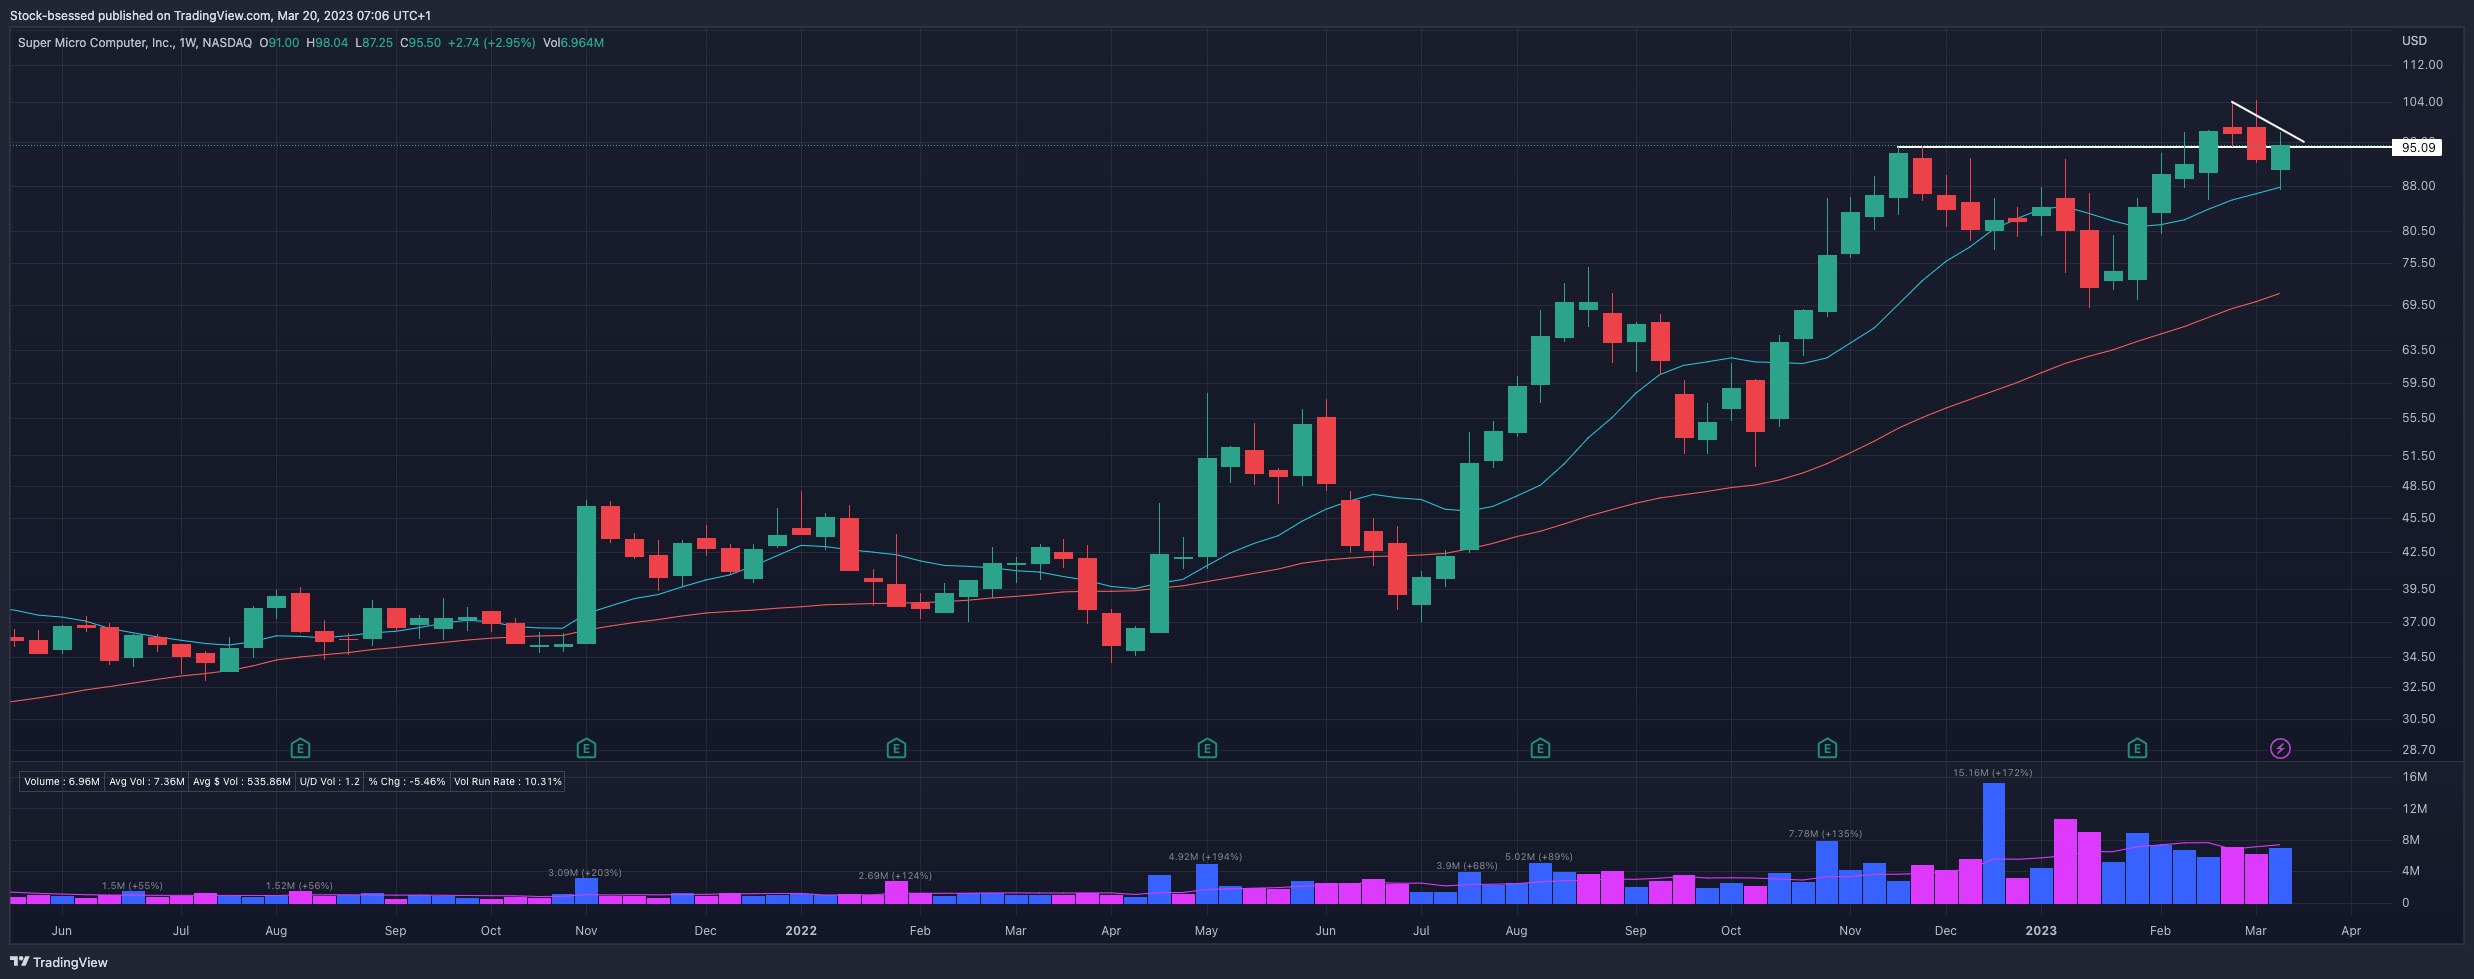
SMCI 0.00%↑ Pushed out of its base recently and now came back in to find clear demand at the 10WMA to close the week off strong as it continues to flag nicely above previous base pivot:
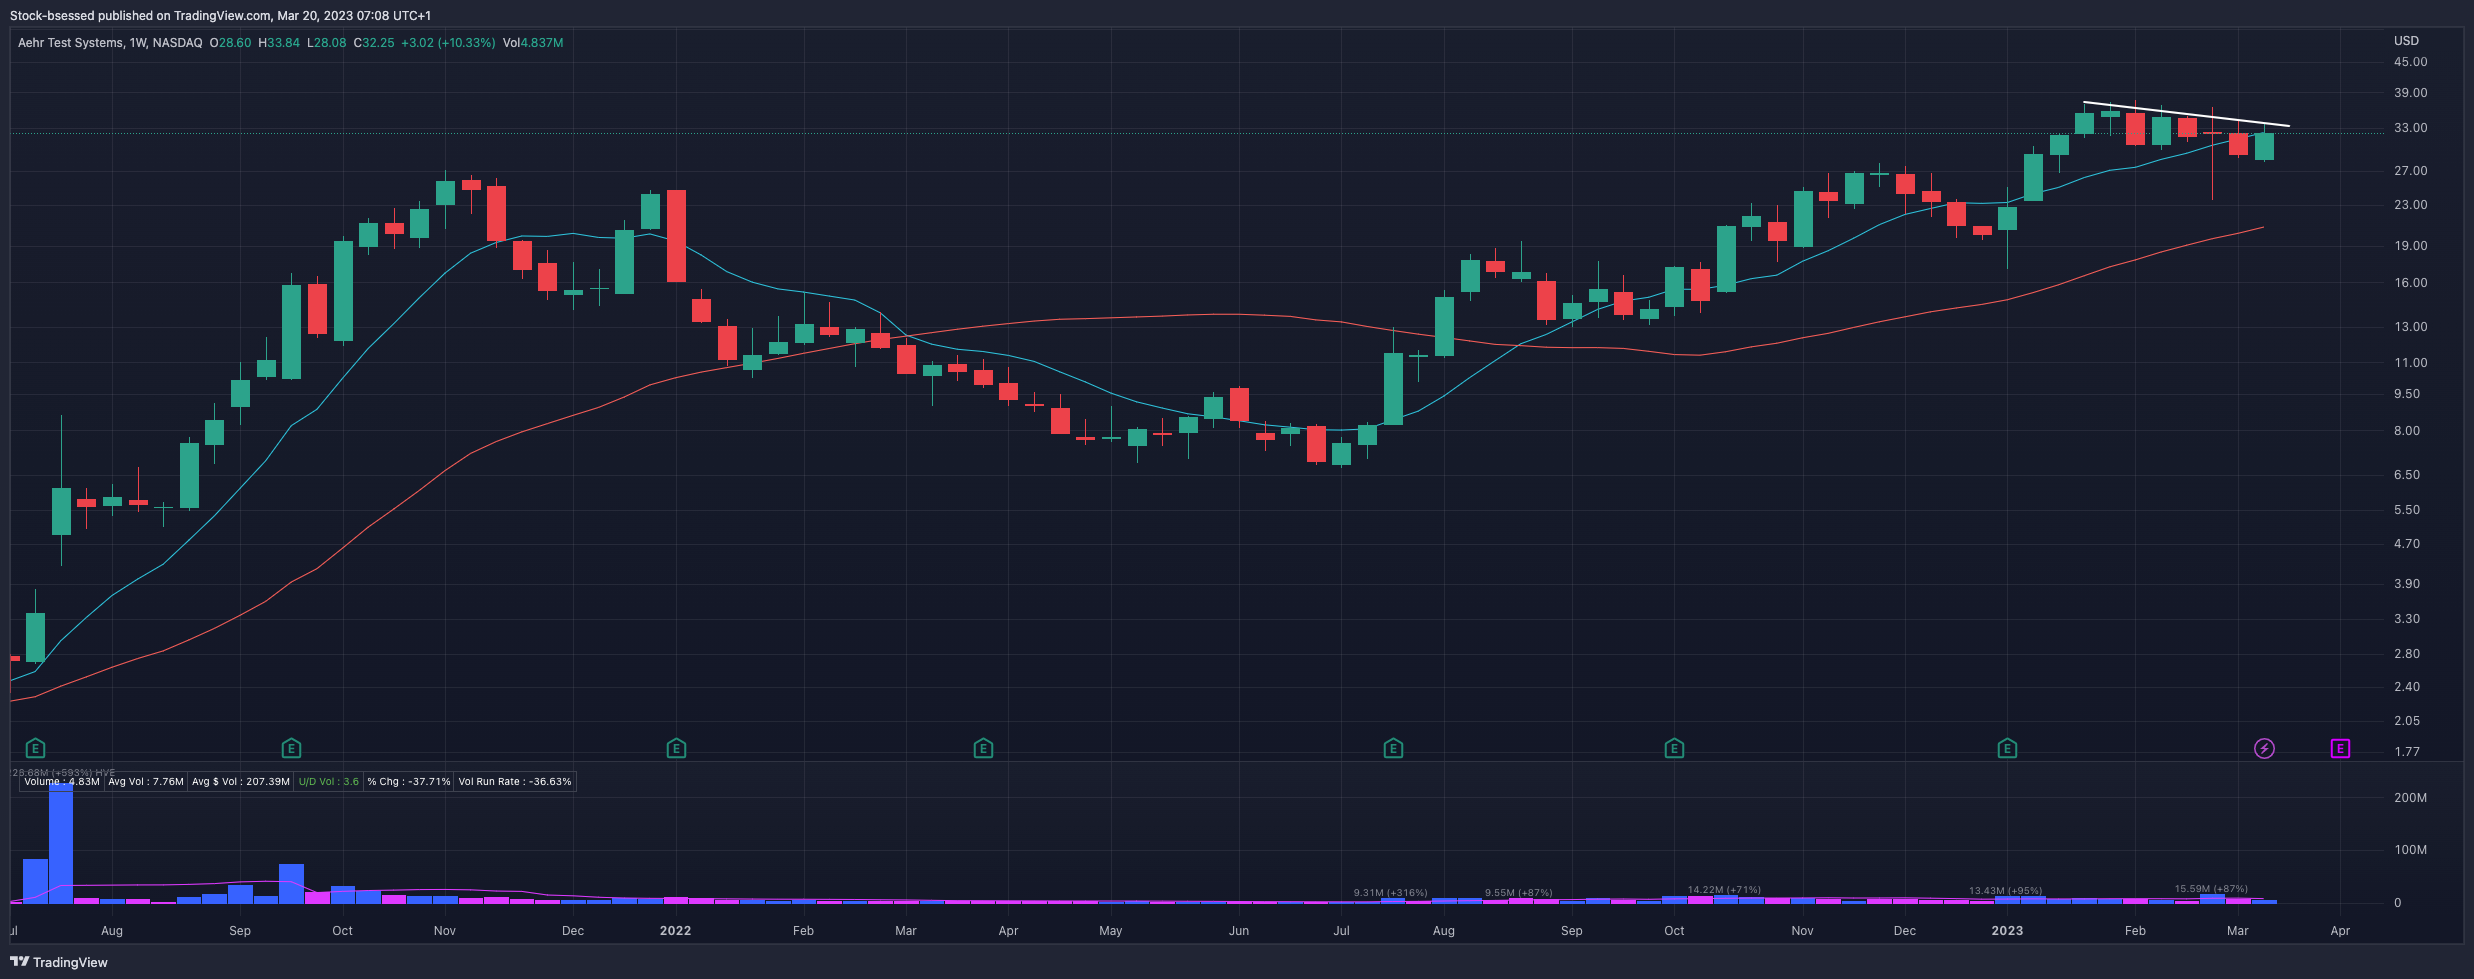
AEHR 0.00%↑ While the daily here is quite volatile and wide-ranging, the weekly chart seems to be flagging quite nicely as it attempts to get tight up here:
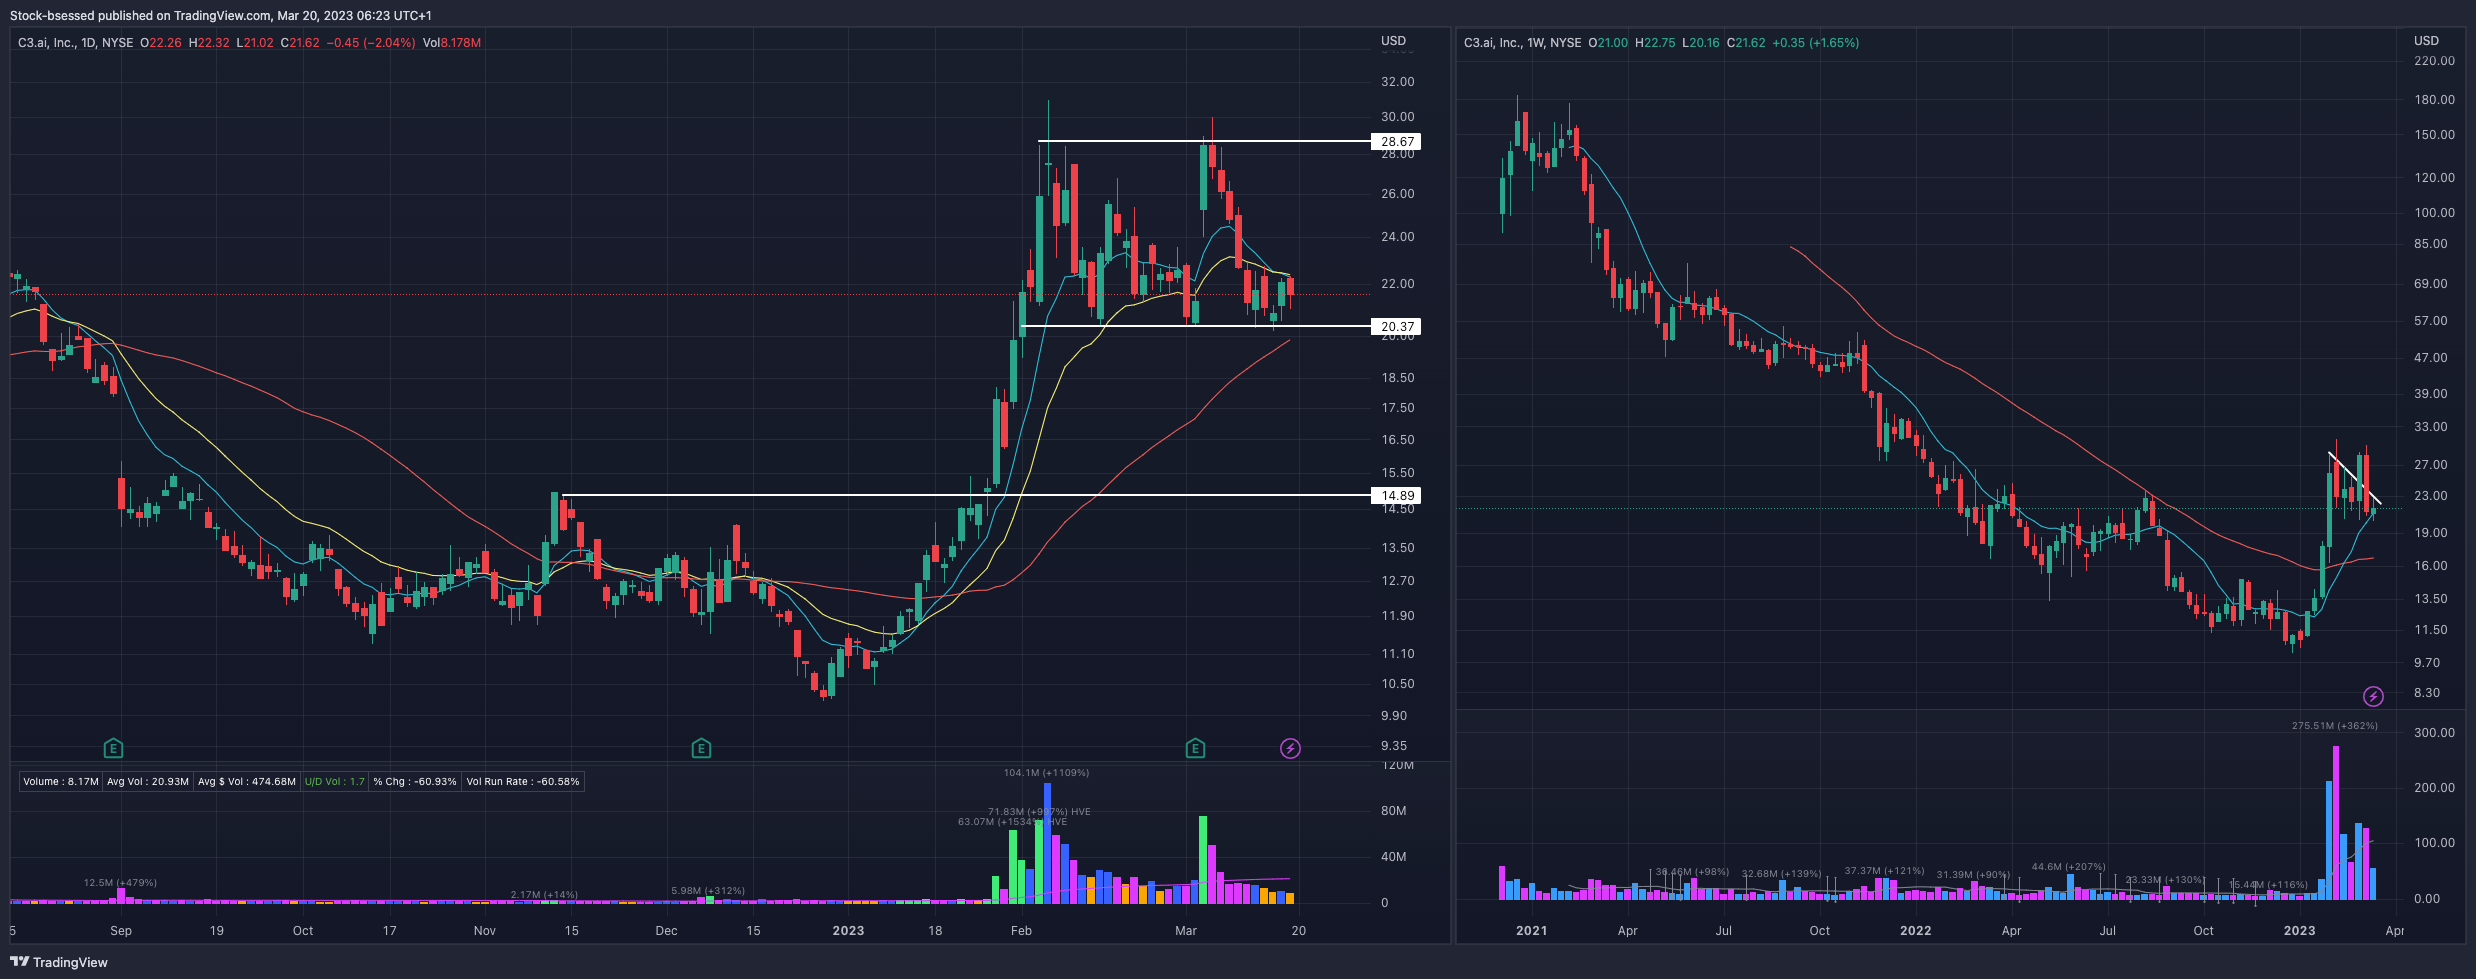
AI 0.00%↑ Continues to be range-bound between this 20-30 area, still to wide and loose for my liking as ranges continue to be erratic making risk management very difficult - weekly chart shows a nice overall flag:
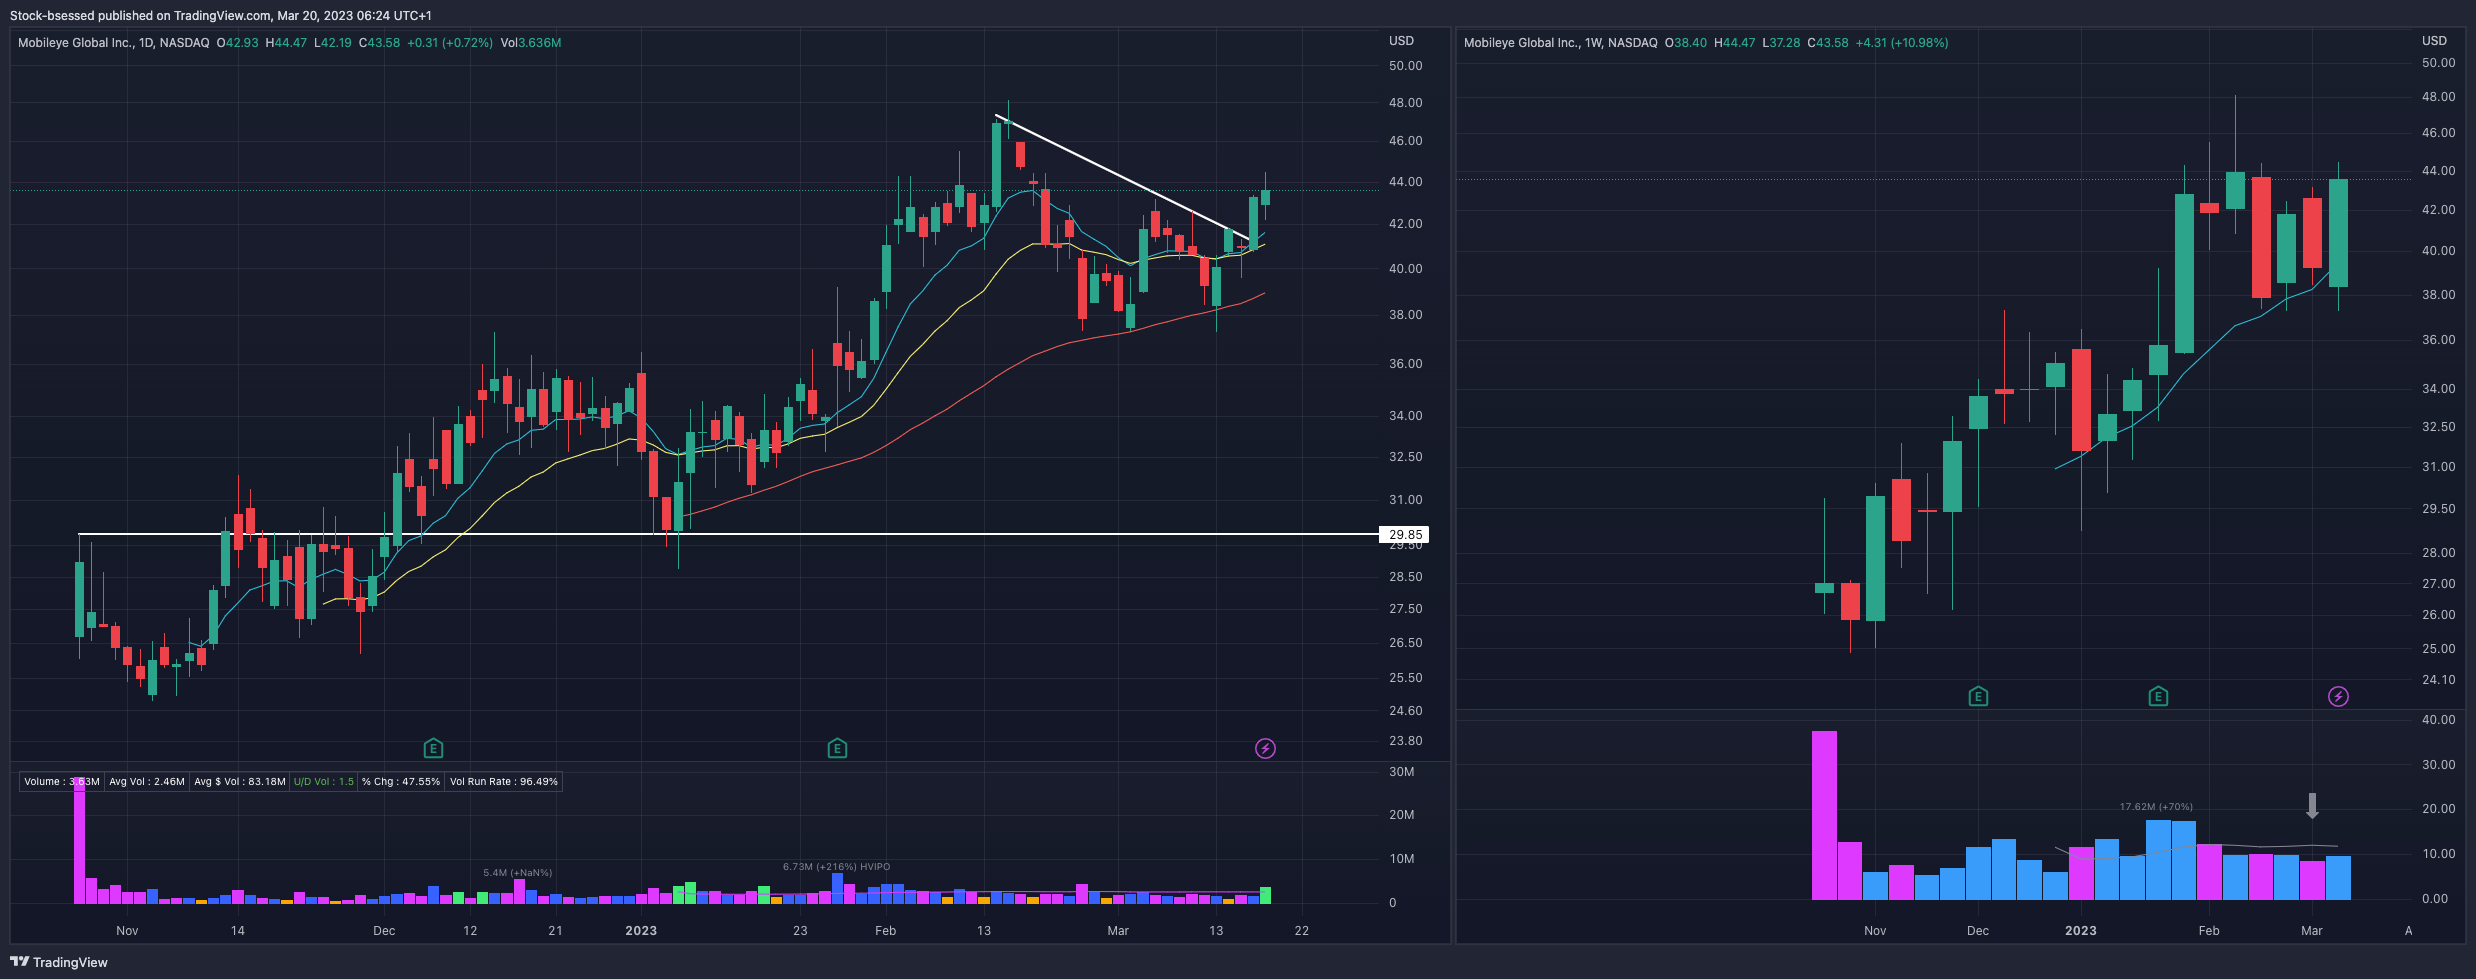
MBLY 0.00%↑ Shakes out below the 10/20EMA and closes strong on Wednesday to follow through and finish the week off strong as it broke through this DTL. The weekly continues trending nicely along with the 10WMA:
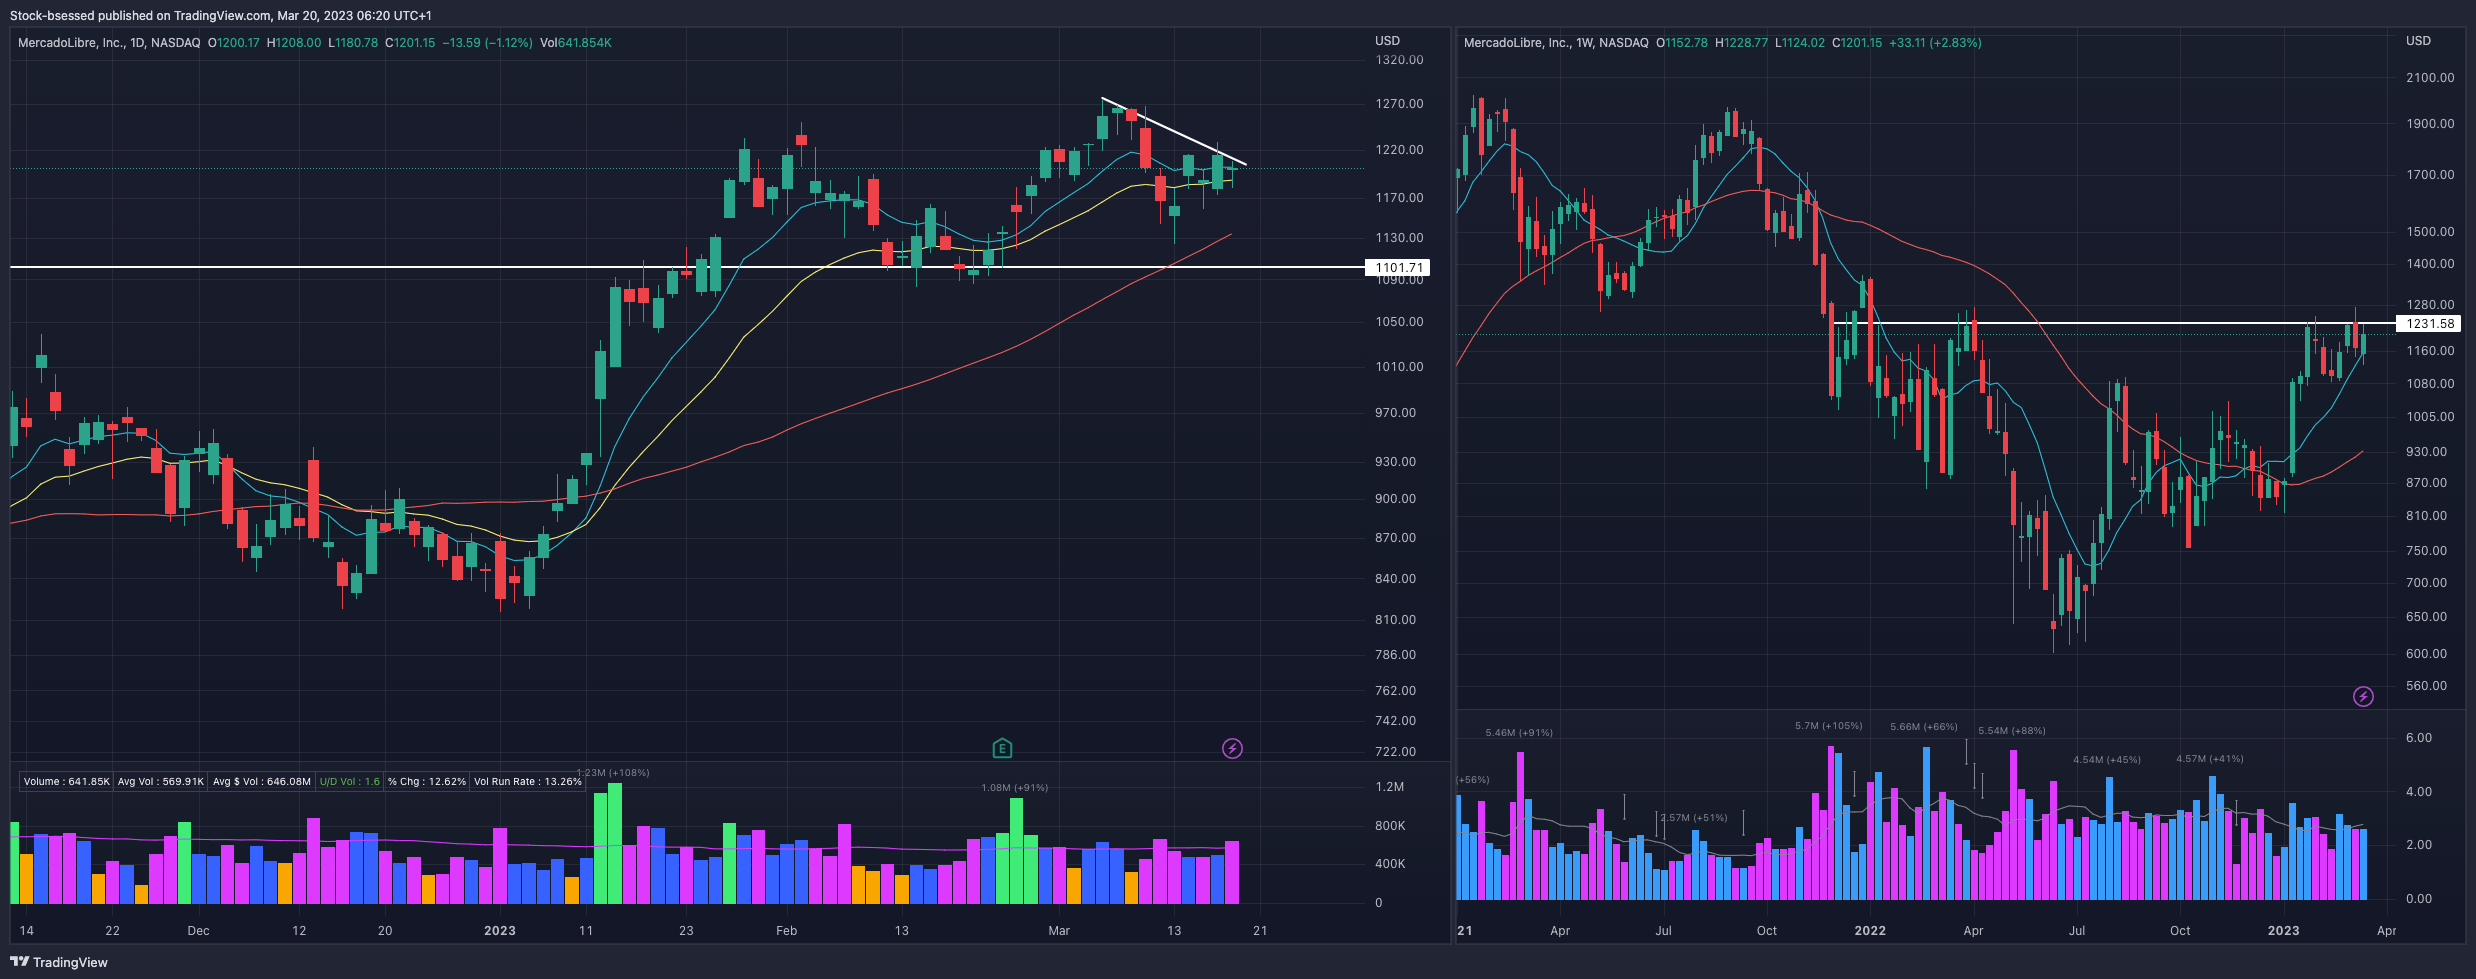
MELI 0.00%↑ A good close with this inside day to close right at the 10EMA but above the 20EMA as it attempts to flag out above previous base pivot. Seeing how it handles this DTL:
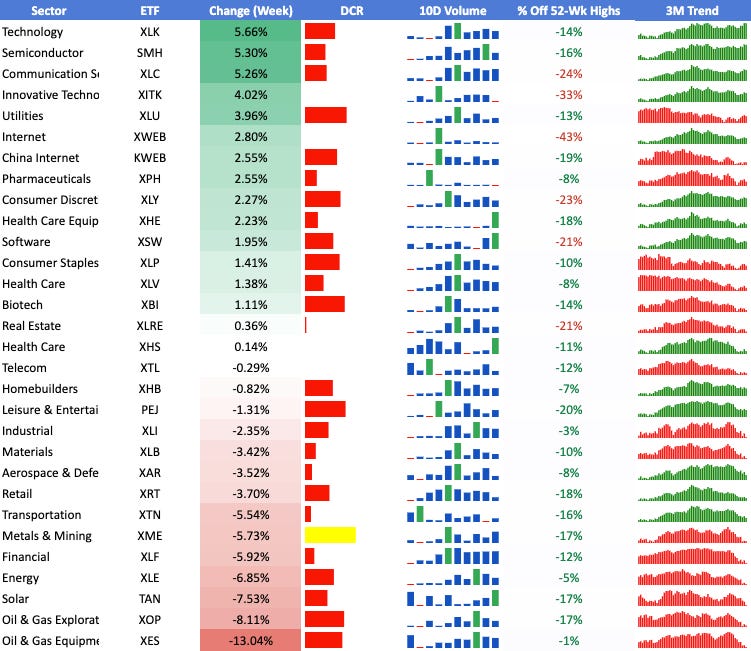
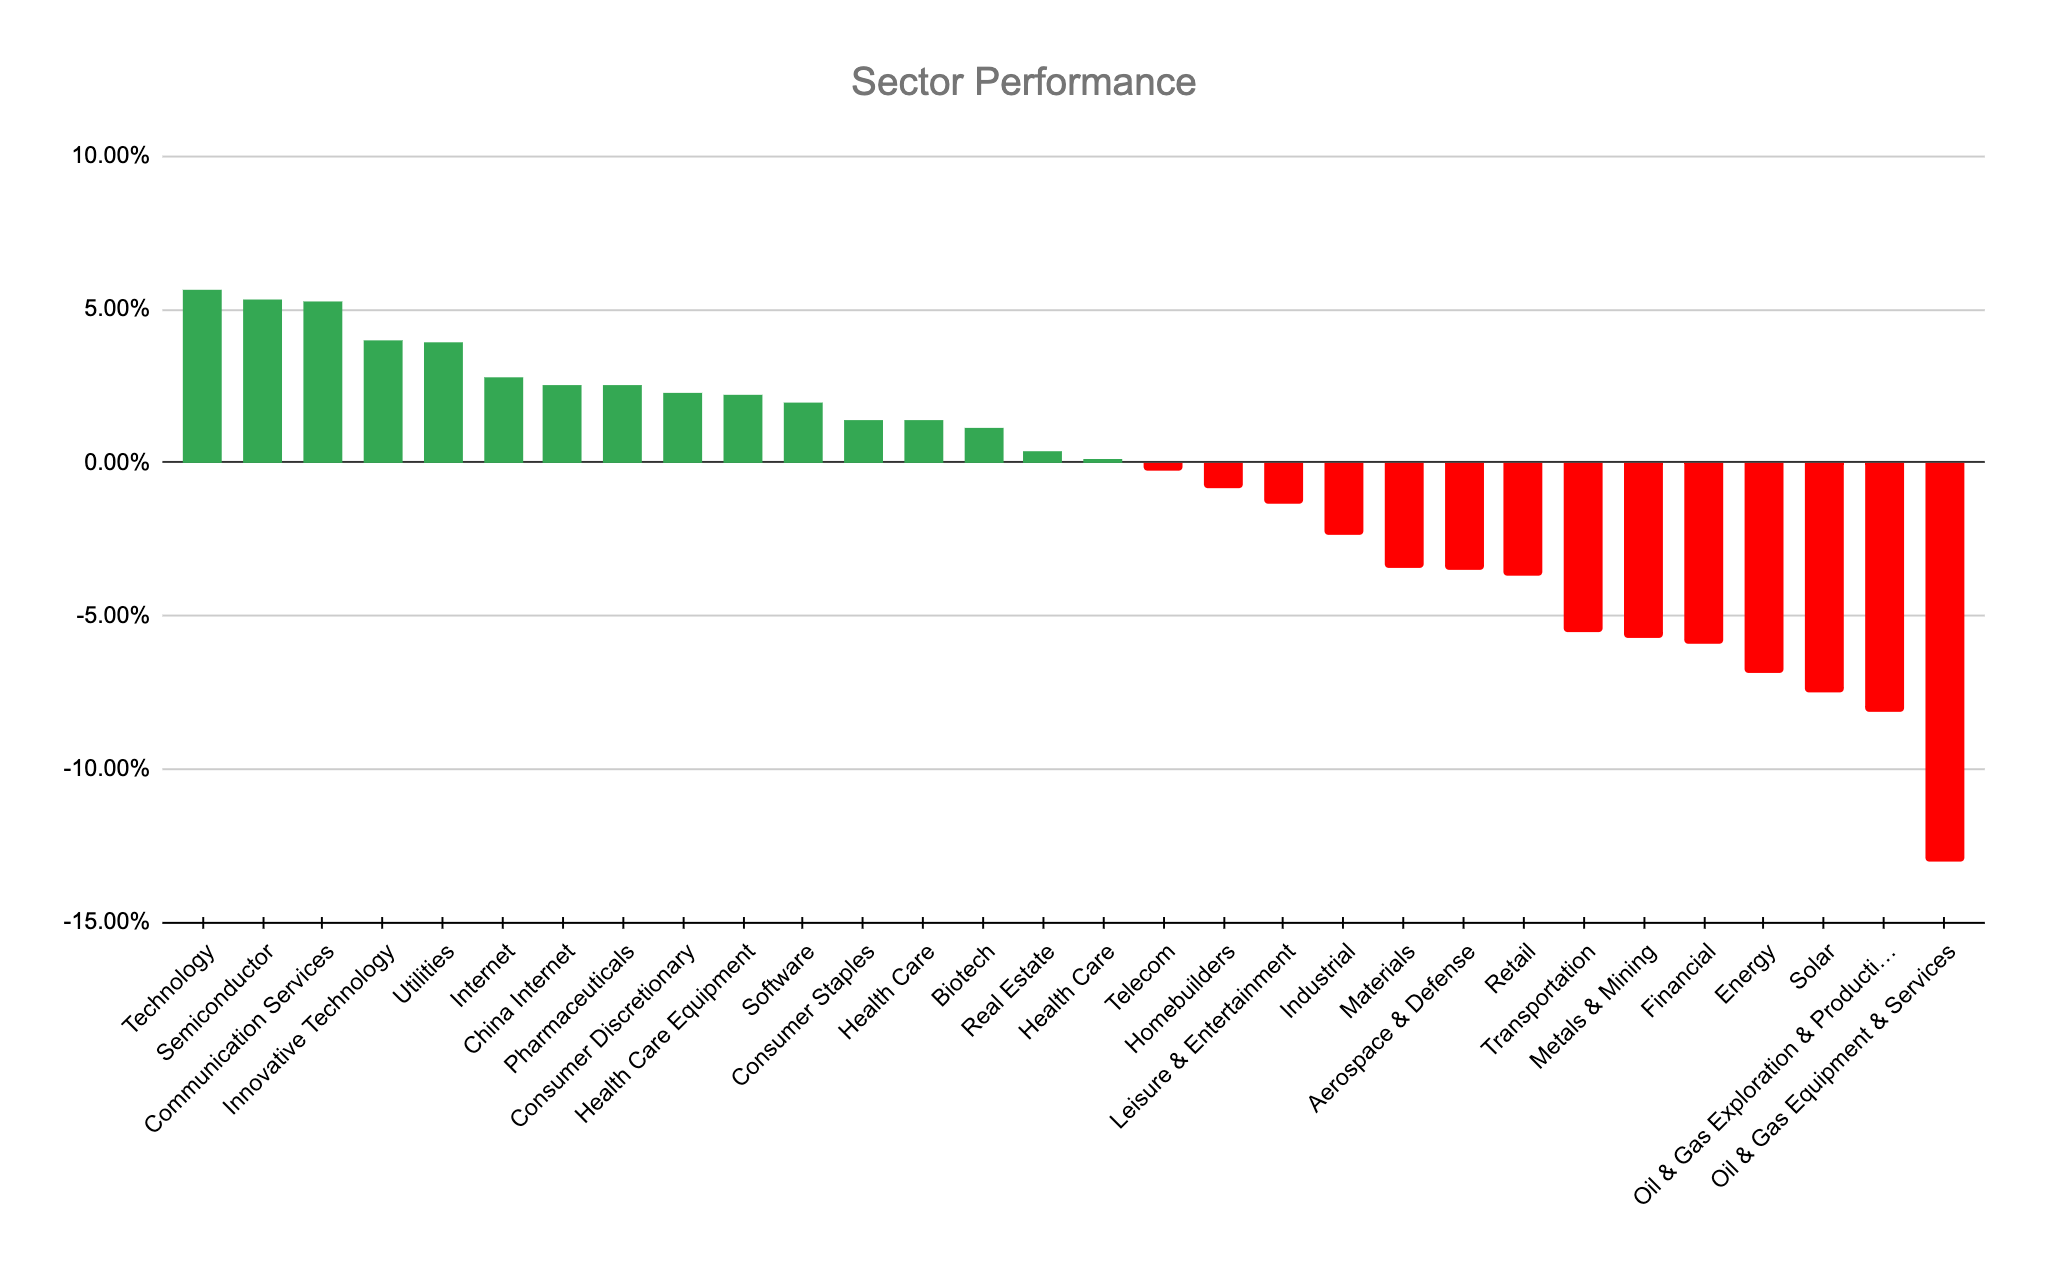
Sector Analysis
Daily:

I am linking the sectors watchlist in tradingview for your convenience, here
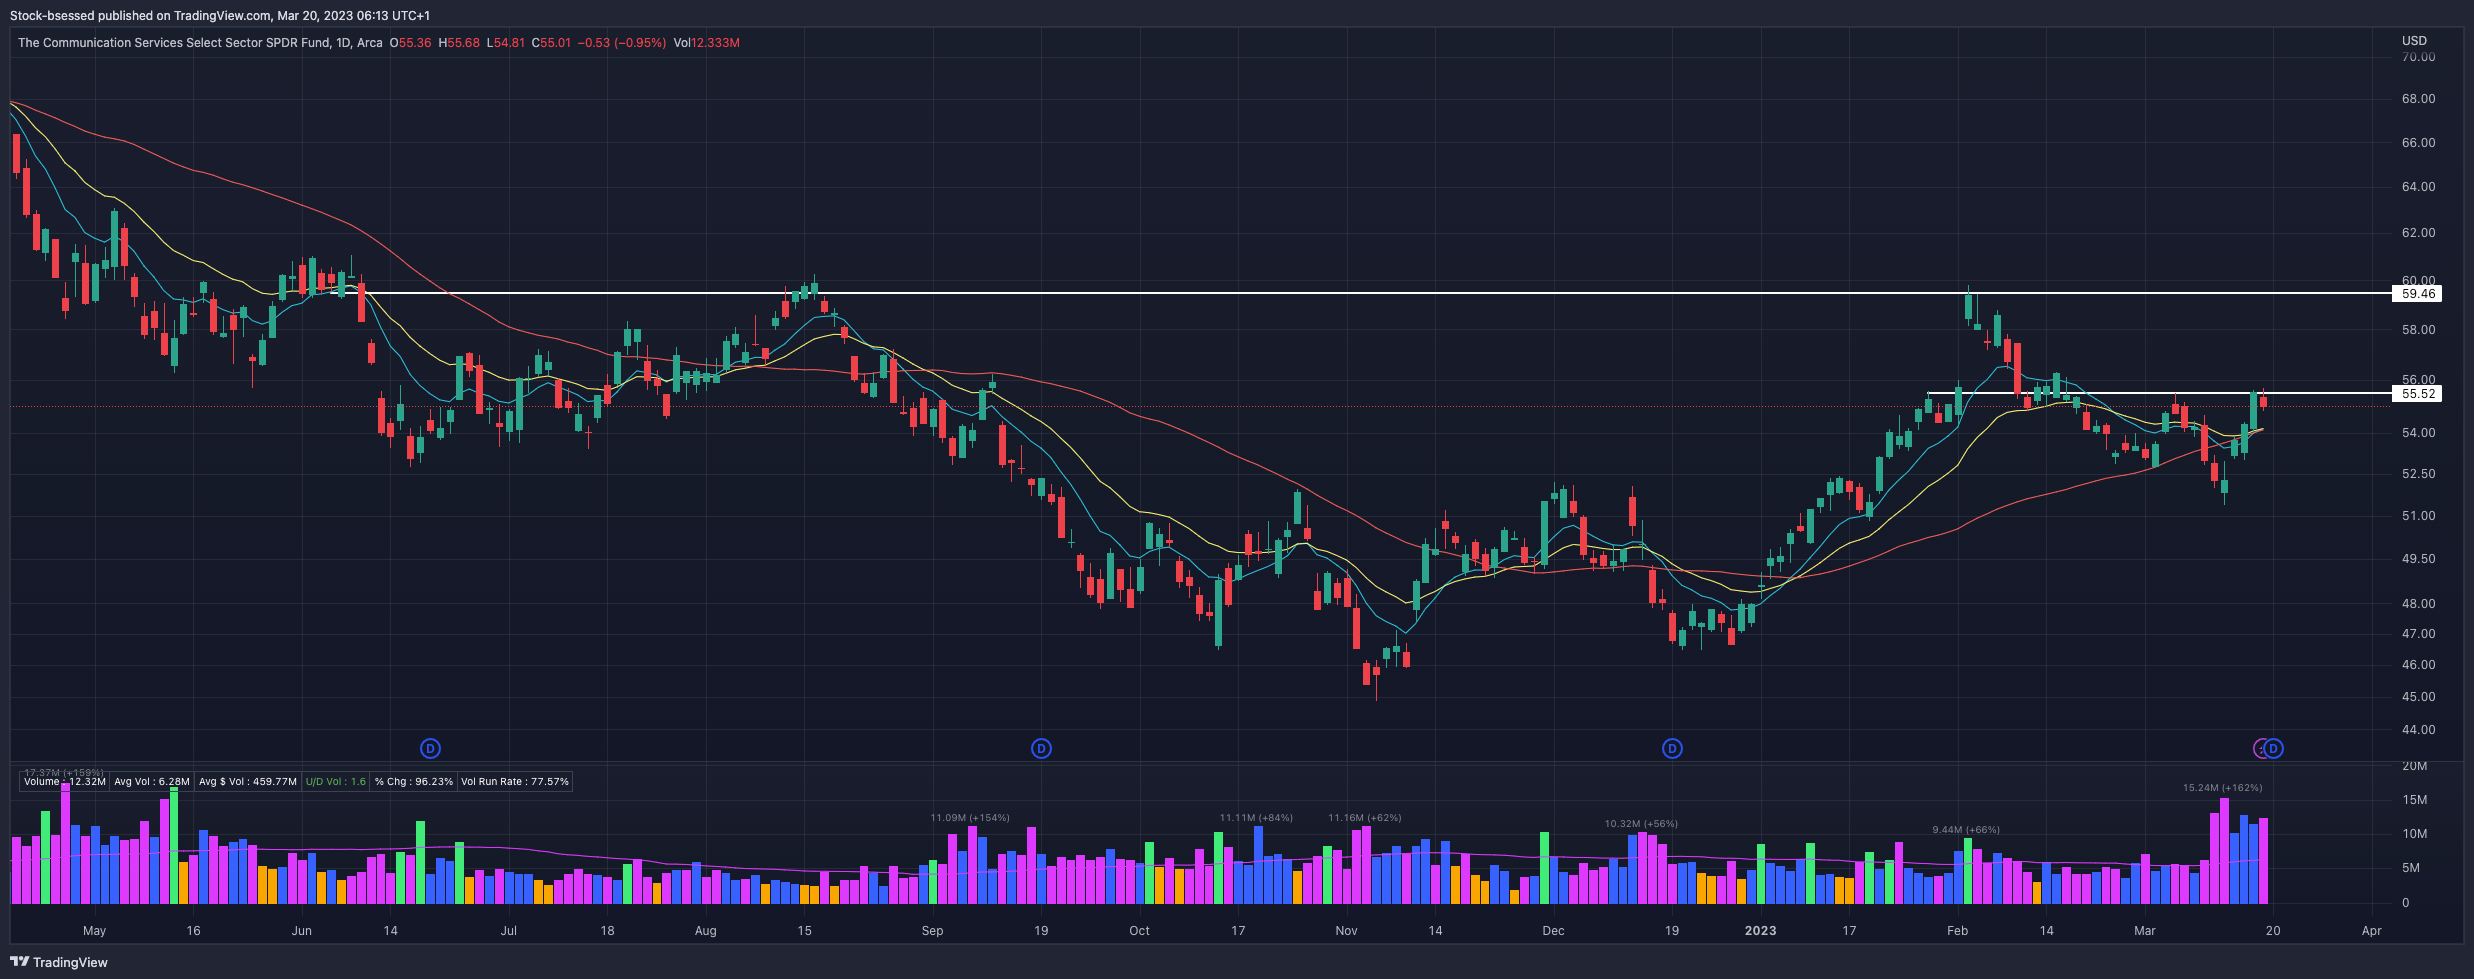
XLC 0.00%↑ A nice reclaim of the key moving averages with a strong showing this week, stalling out right at a key area below the 56 region as KMAs attempt to bunch up and get tight:
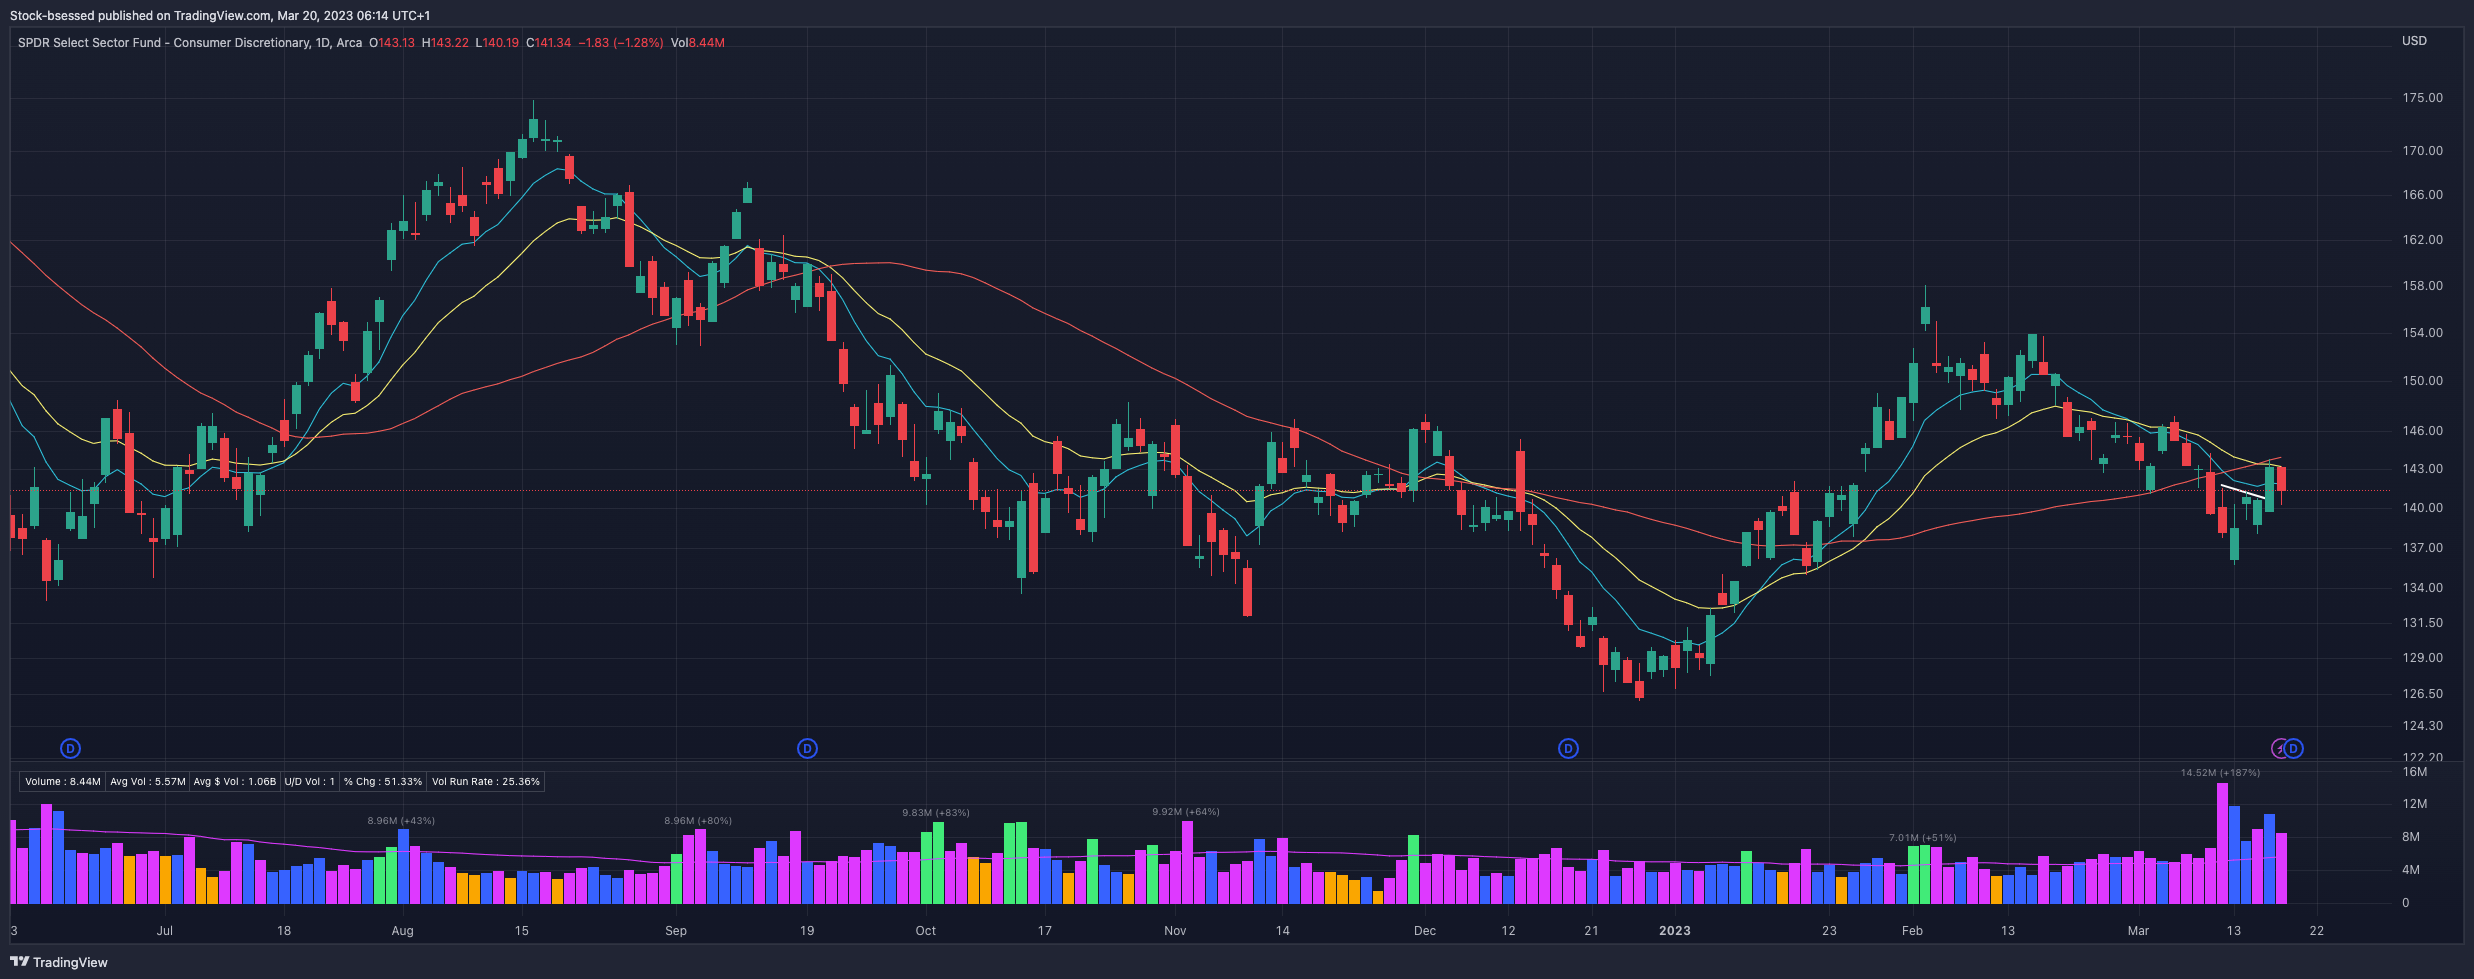
XLY 0.00%↑ Gets a pop above this short-term descending trend line and pushed up right to the 20EMA until finding some resistance:
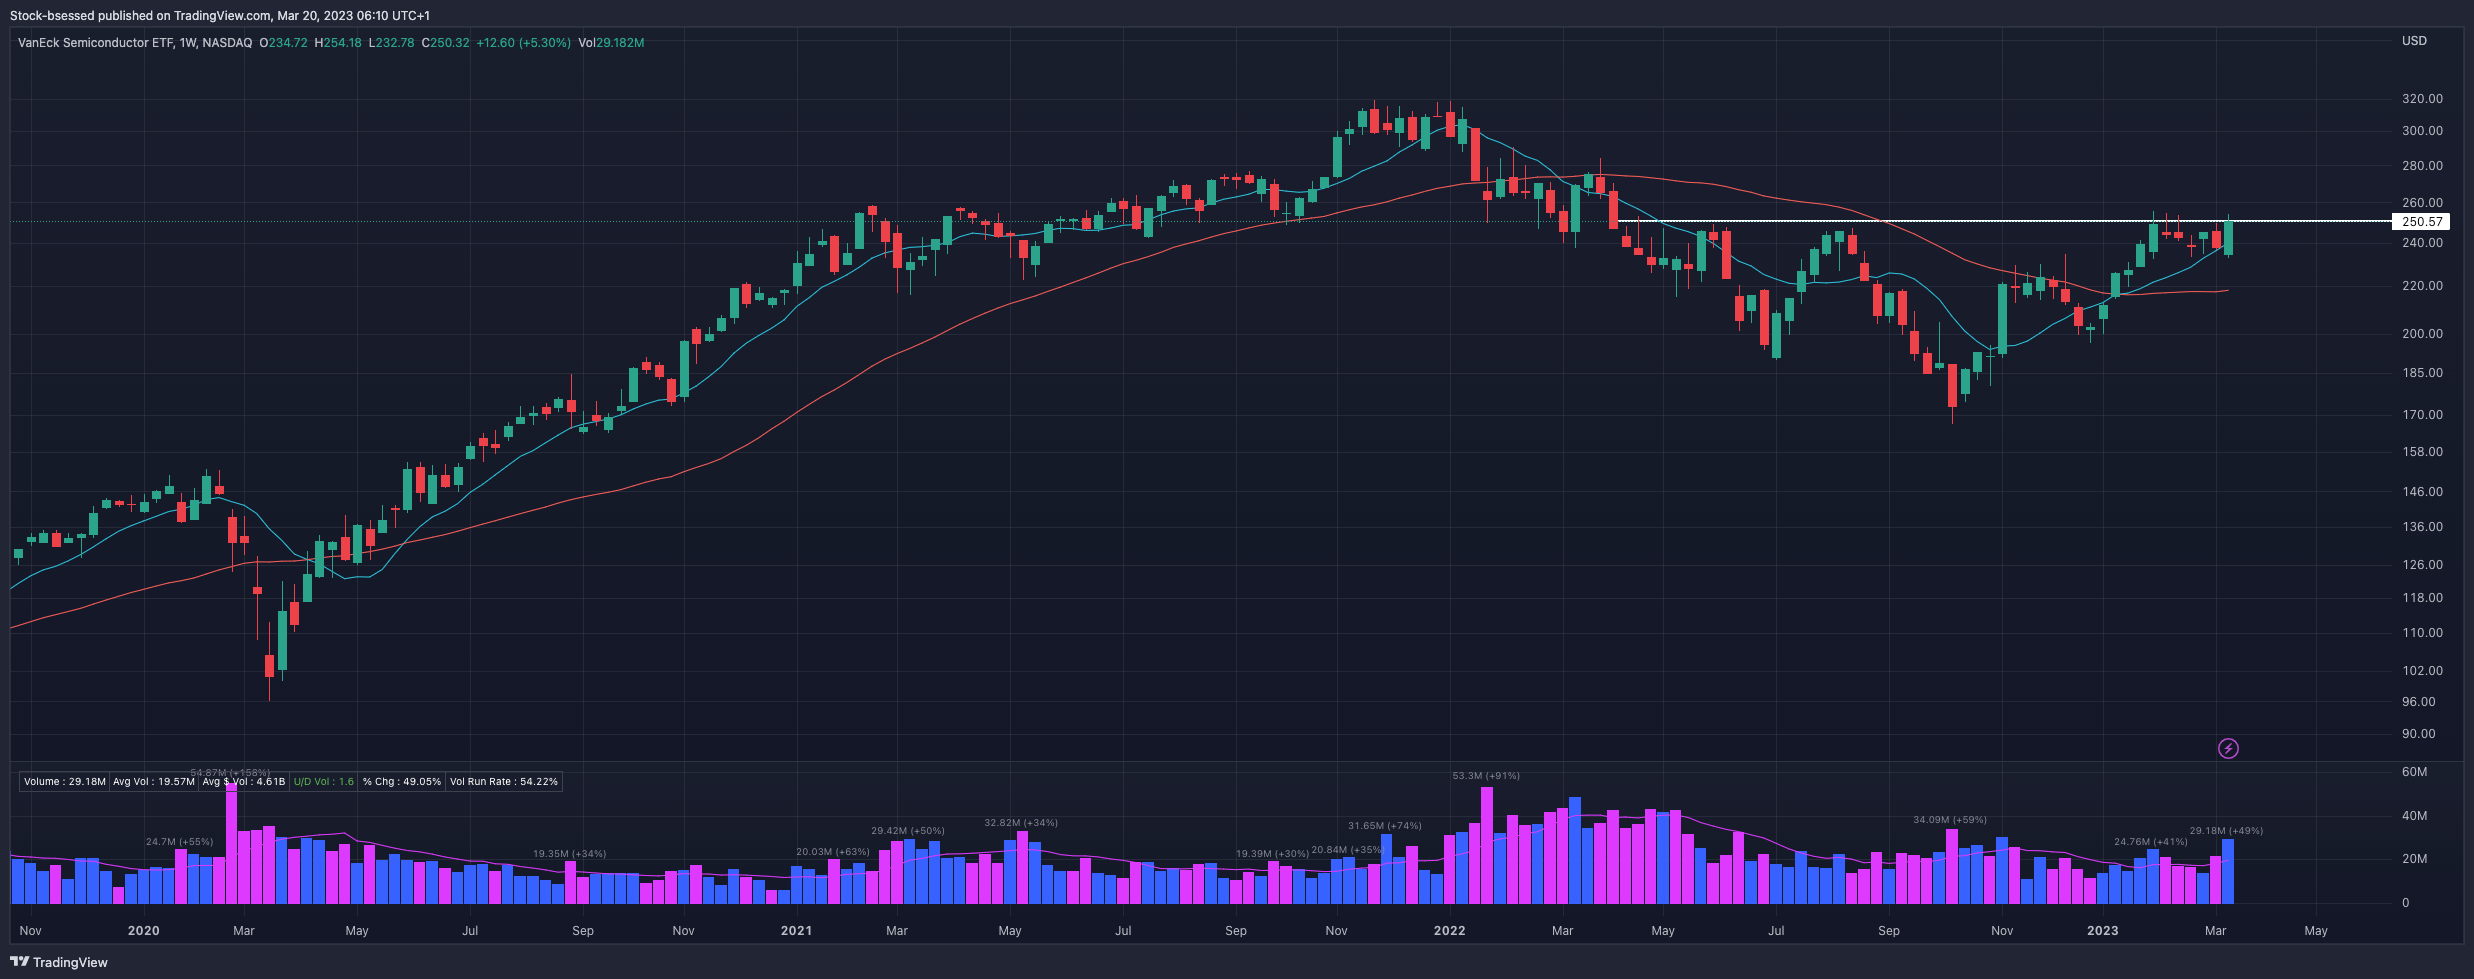
Weekly:
SMH 0.00%↑ Semiconductors continue to show clear strength both as a potential leadership group as well as due to encouraging action by its individual components. Will be watching for a push out above this week's high to get it moving out of this base:
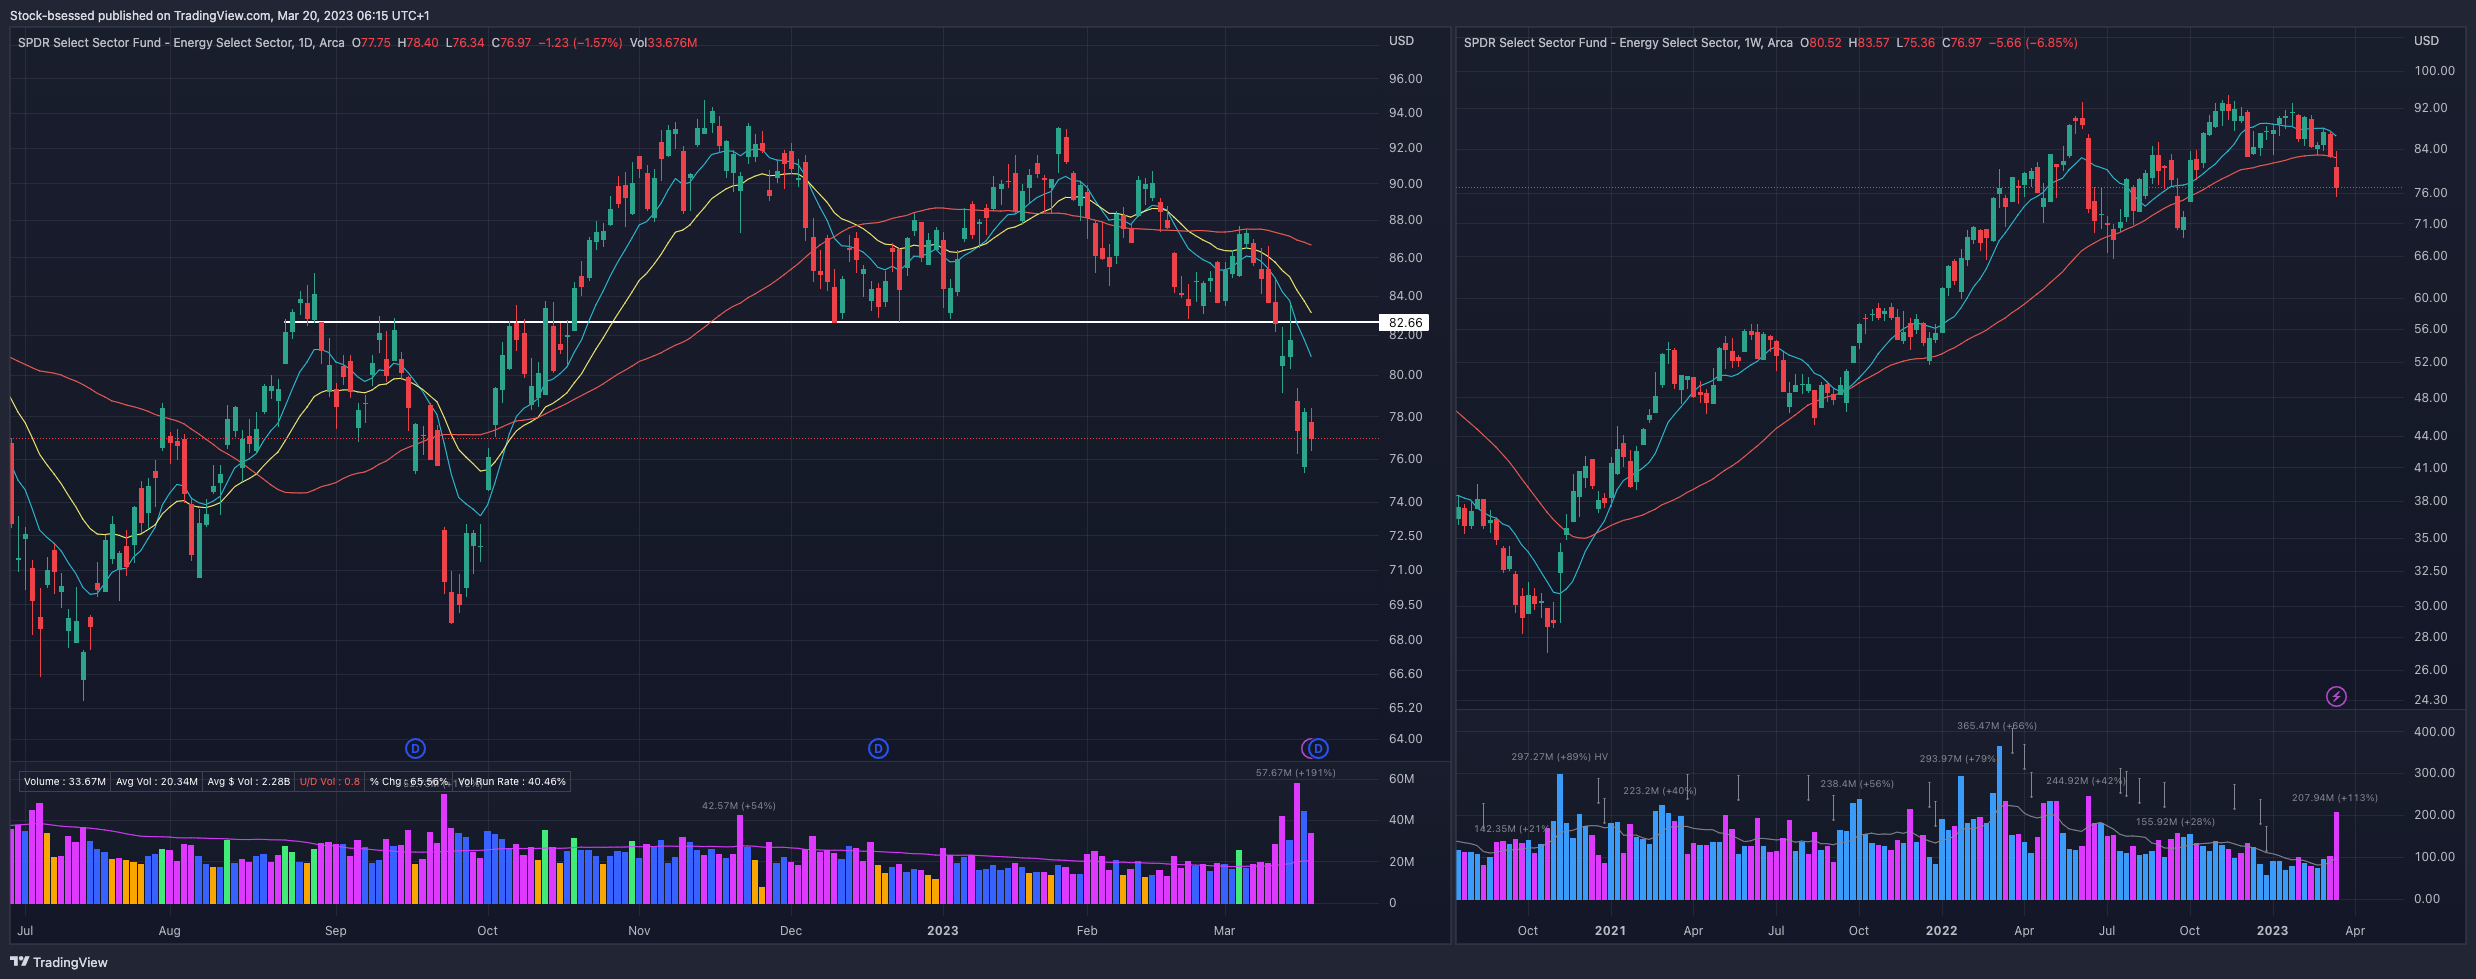
XLE 0.00%↑ Continued distribution as sellers maintain control on increased volume since the breakdown of the 82 area:
XLF 0.00%↑ Highly-news driven and volatile area of the market right now with some selling on big increases in volume:

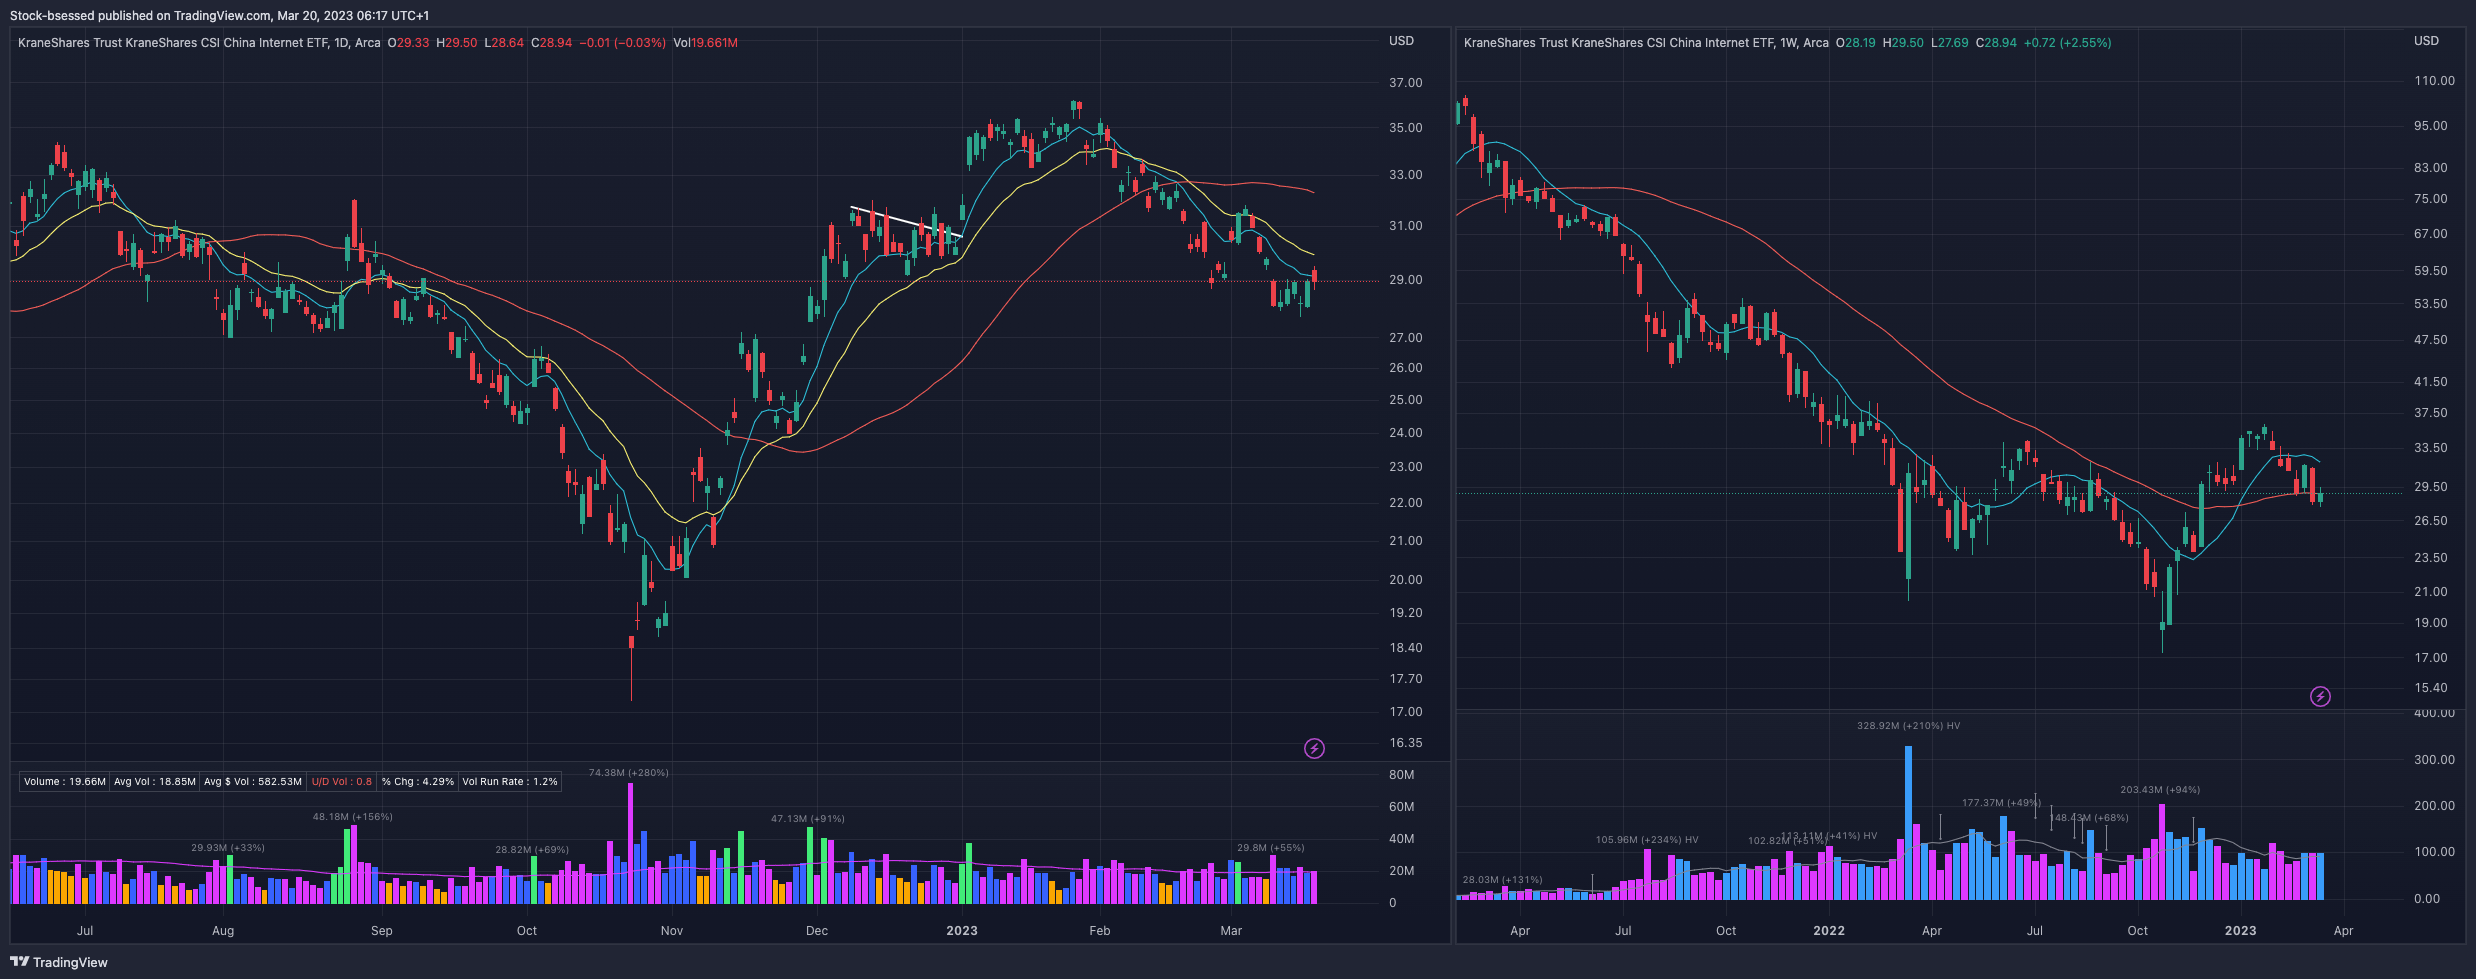
KWEB 0.00%↑ Daily chart shows a messier picture but the weekly shows there was strong upside momentum to start the year and is now pulling back to the 10WMA:
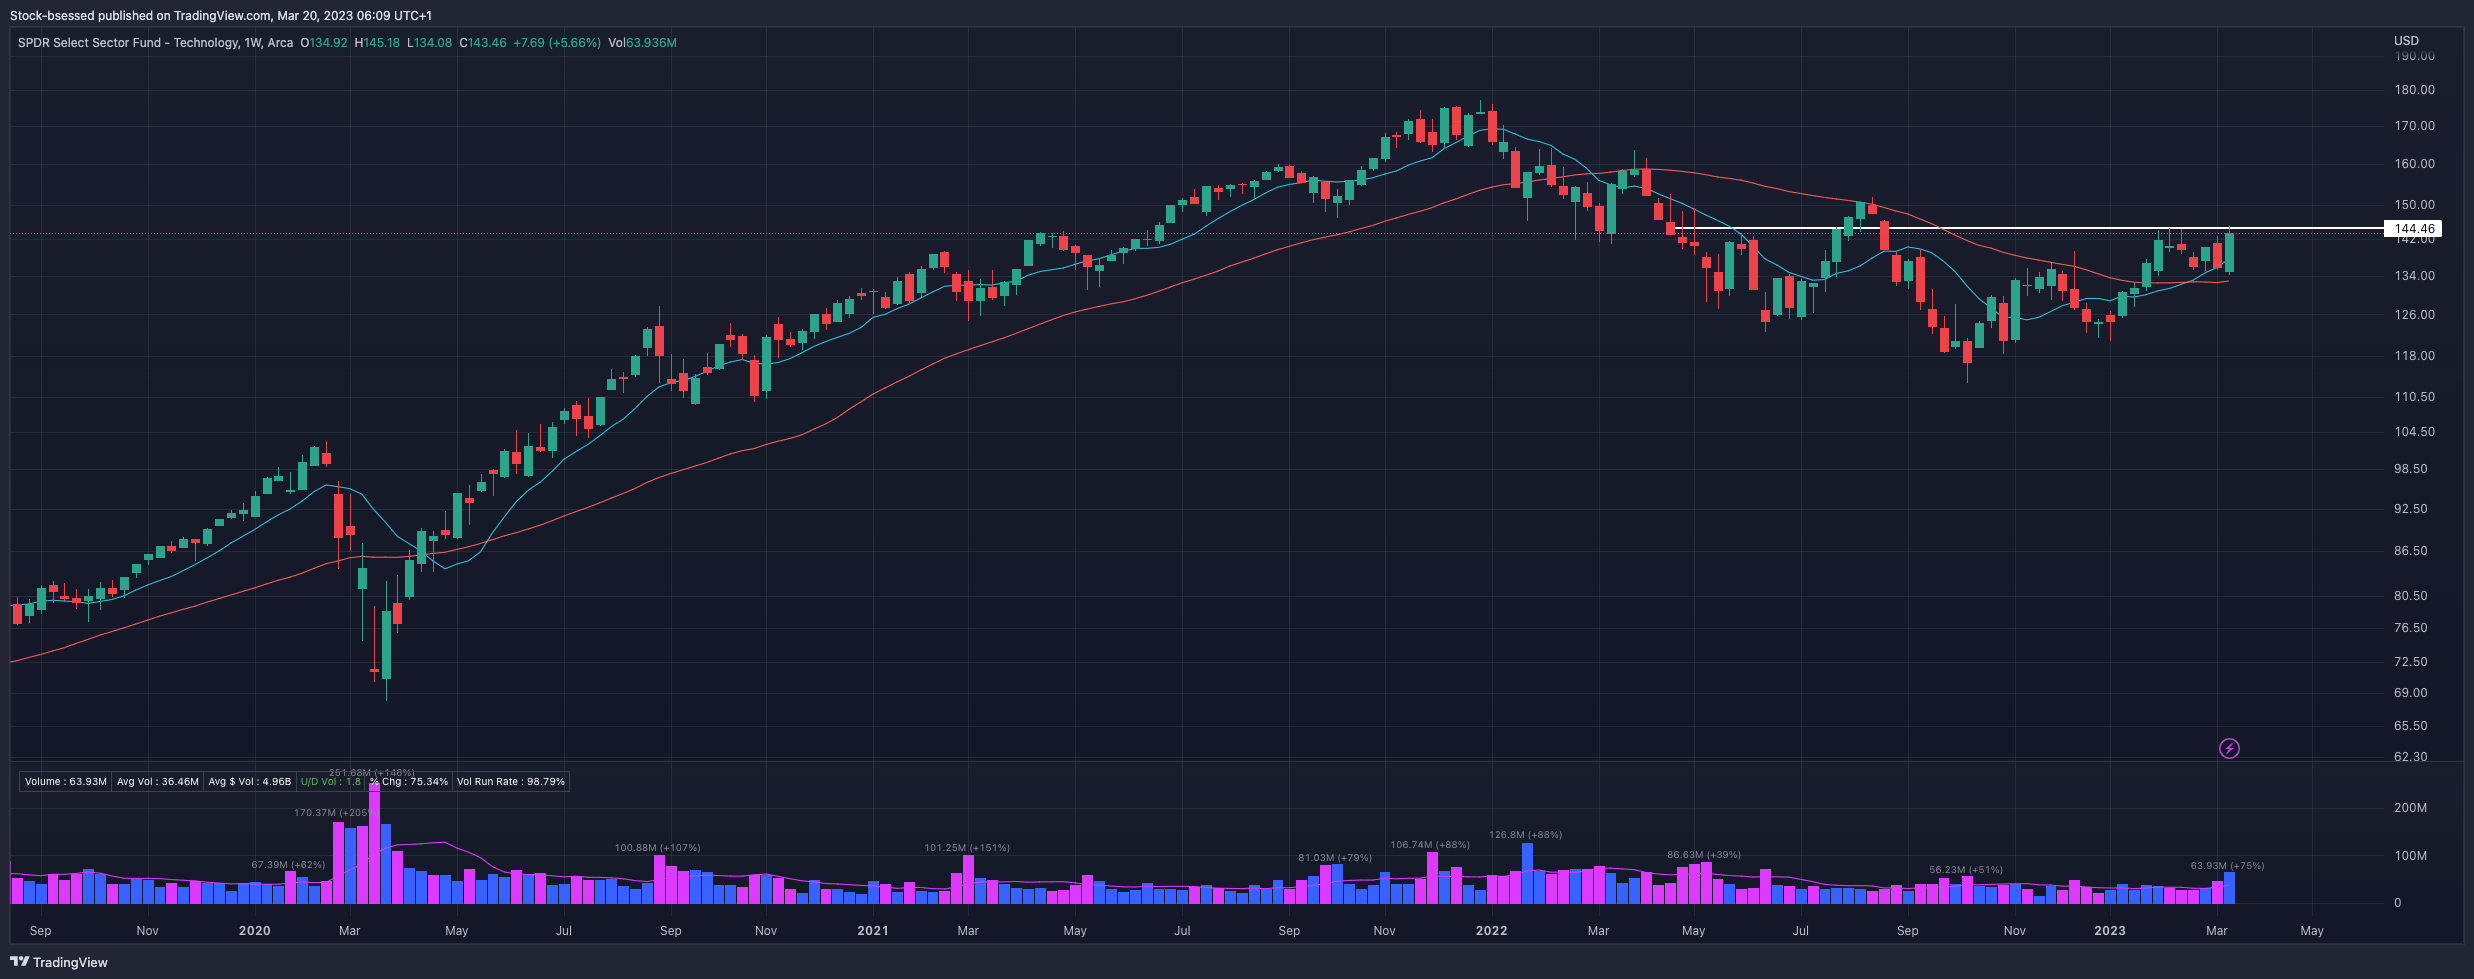
XLK 0.00%↑ Solid weekly base all around with strong closes and moving averages trending upwards along with price. Focus is on the action against the 145 area here to see if it can push through:
Scans
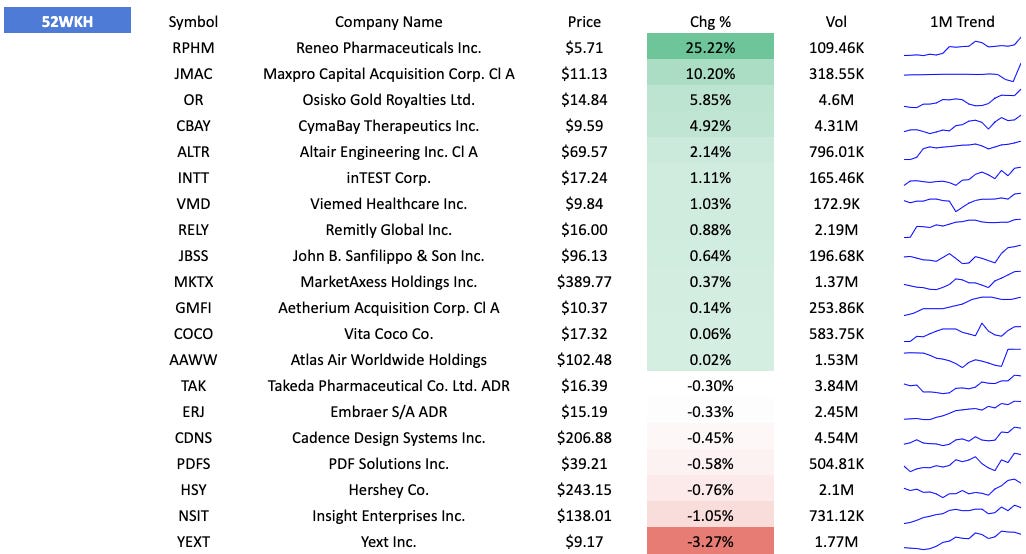
52 Week highs
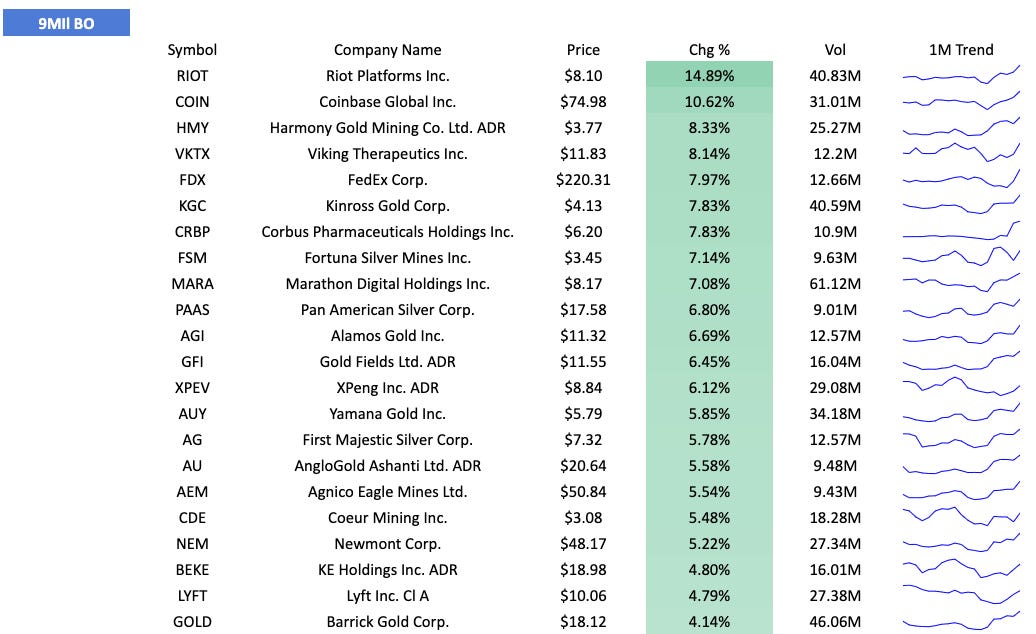
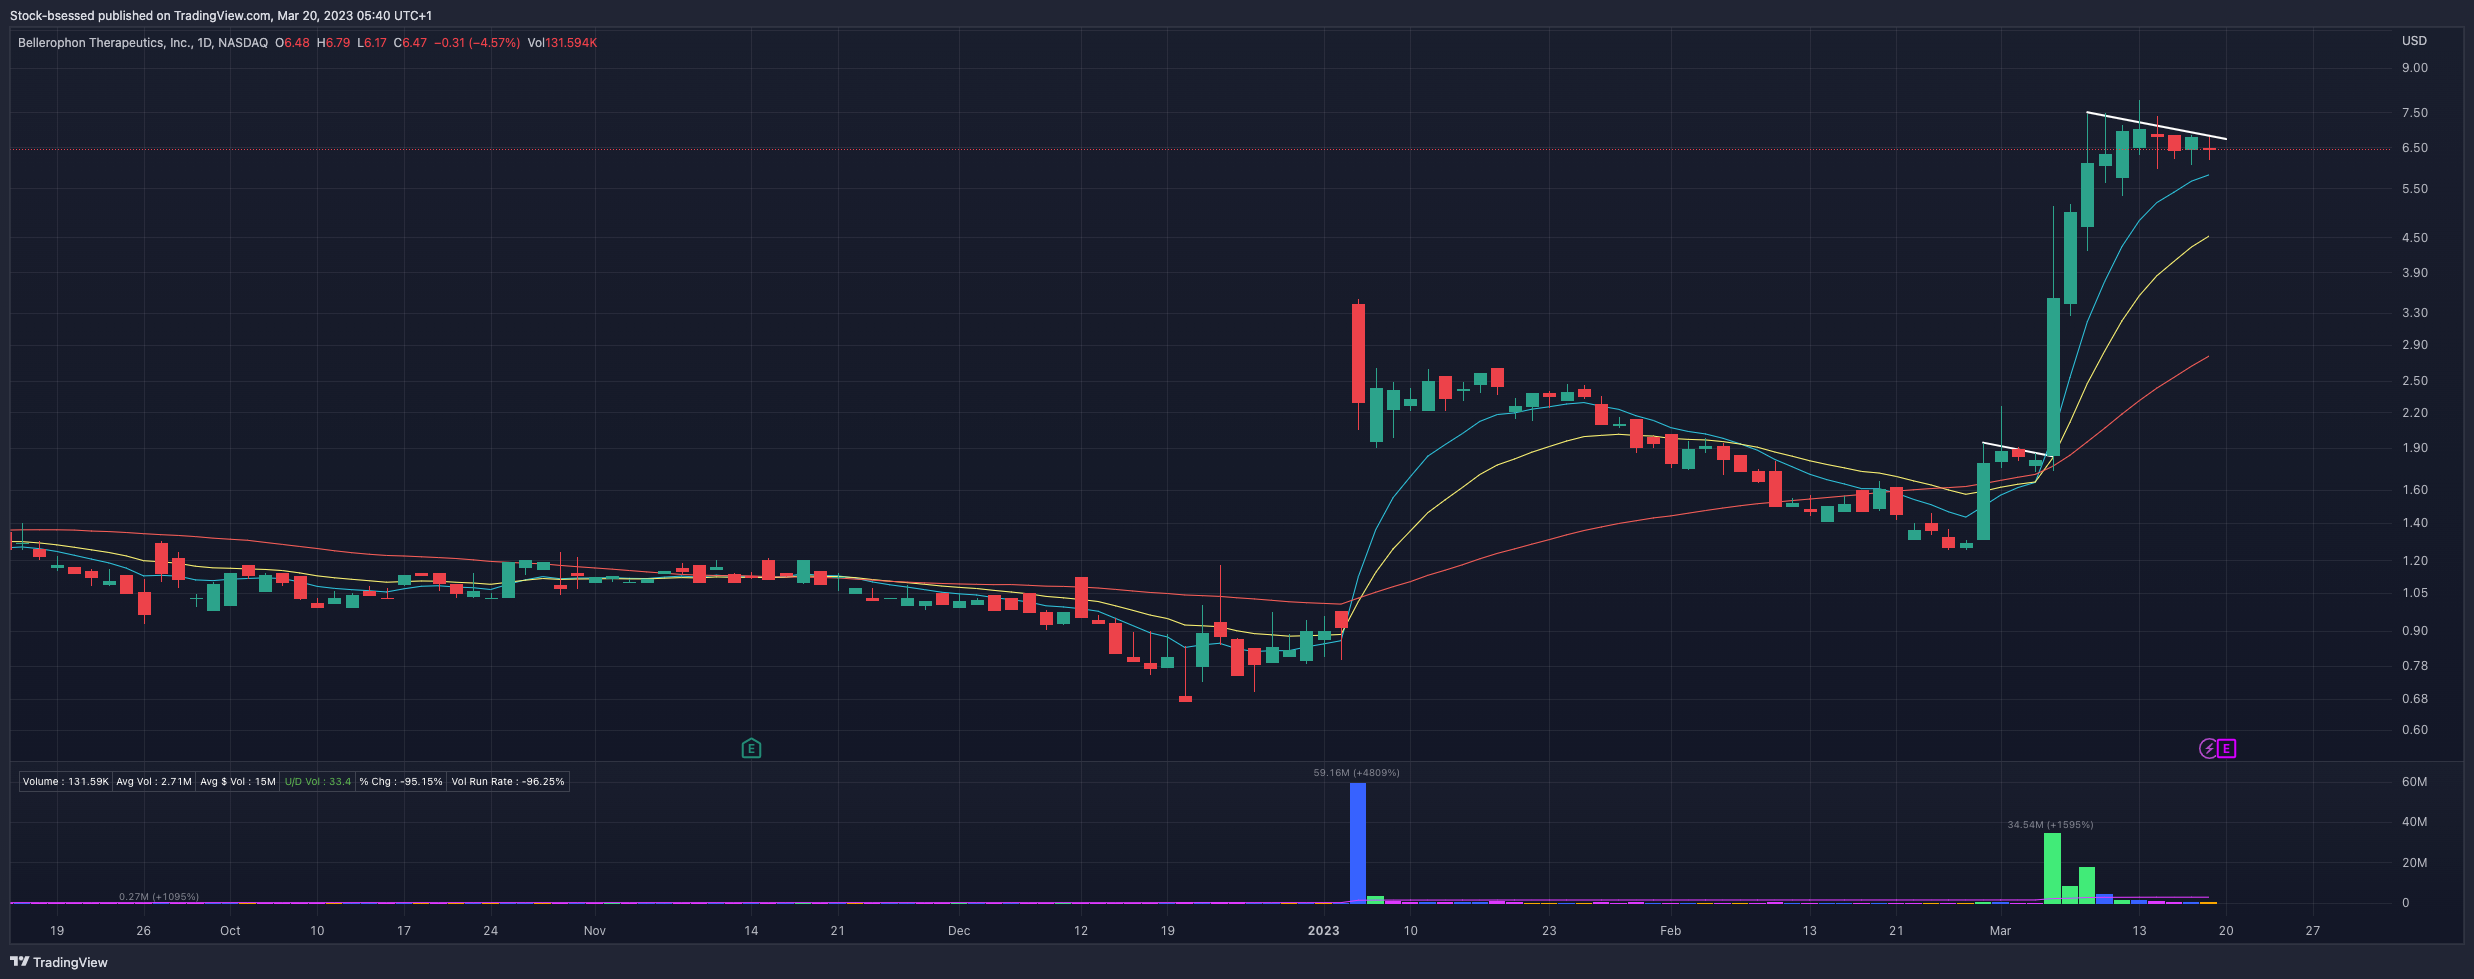
9 Million breakout
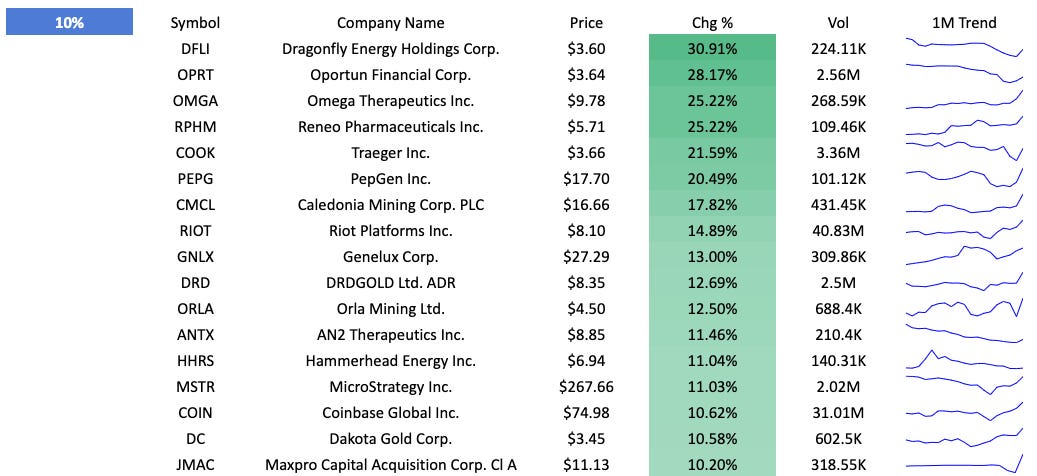
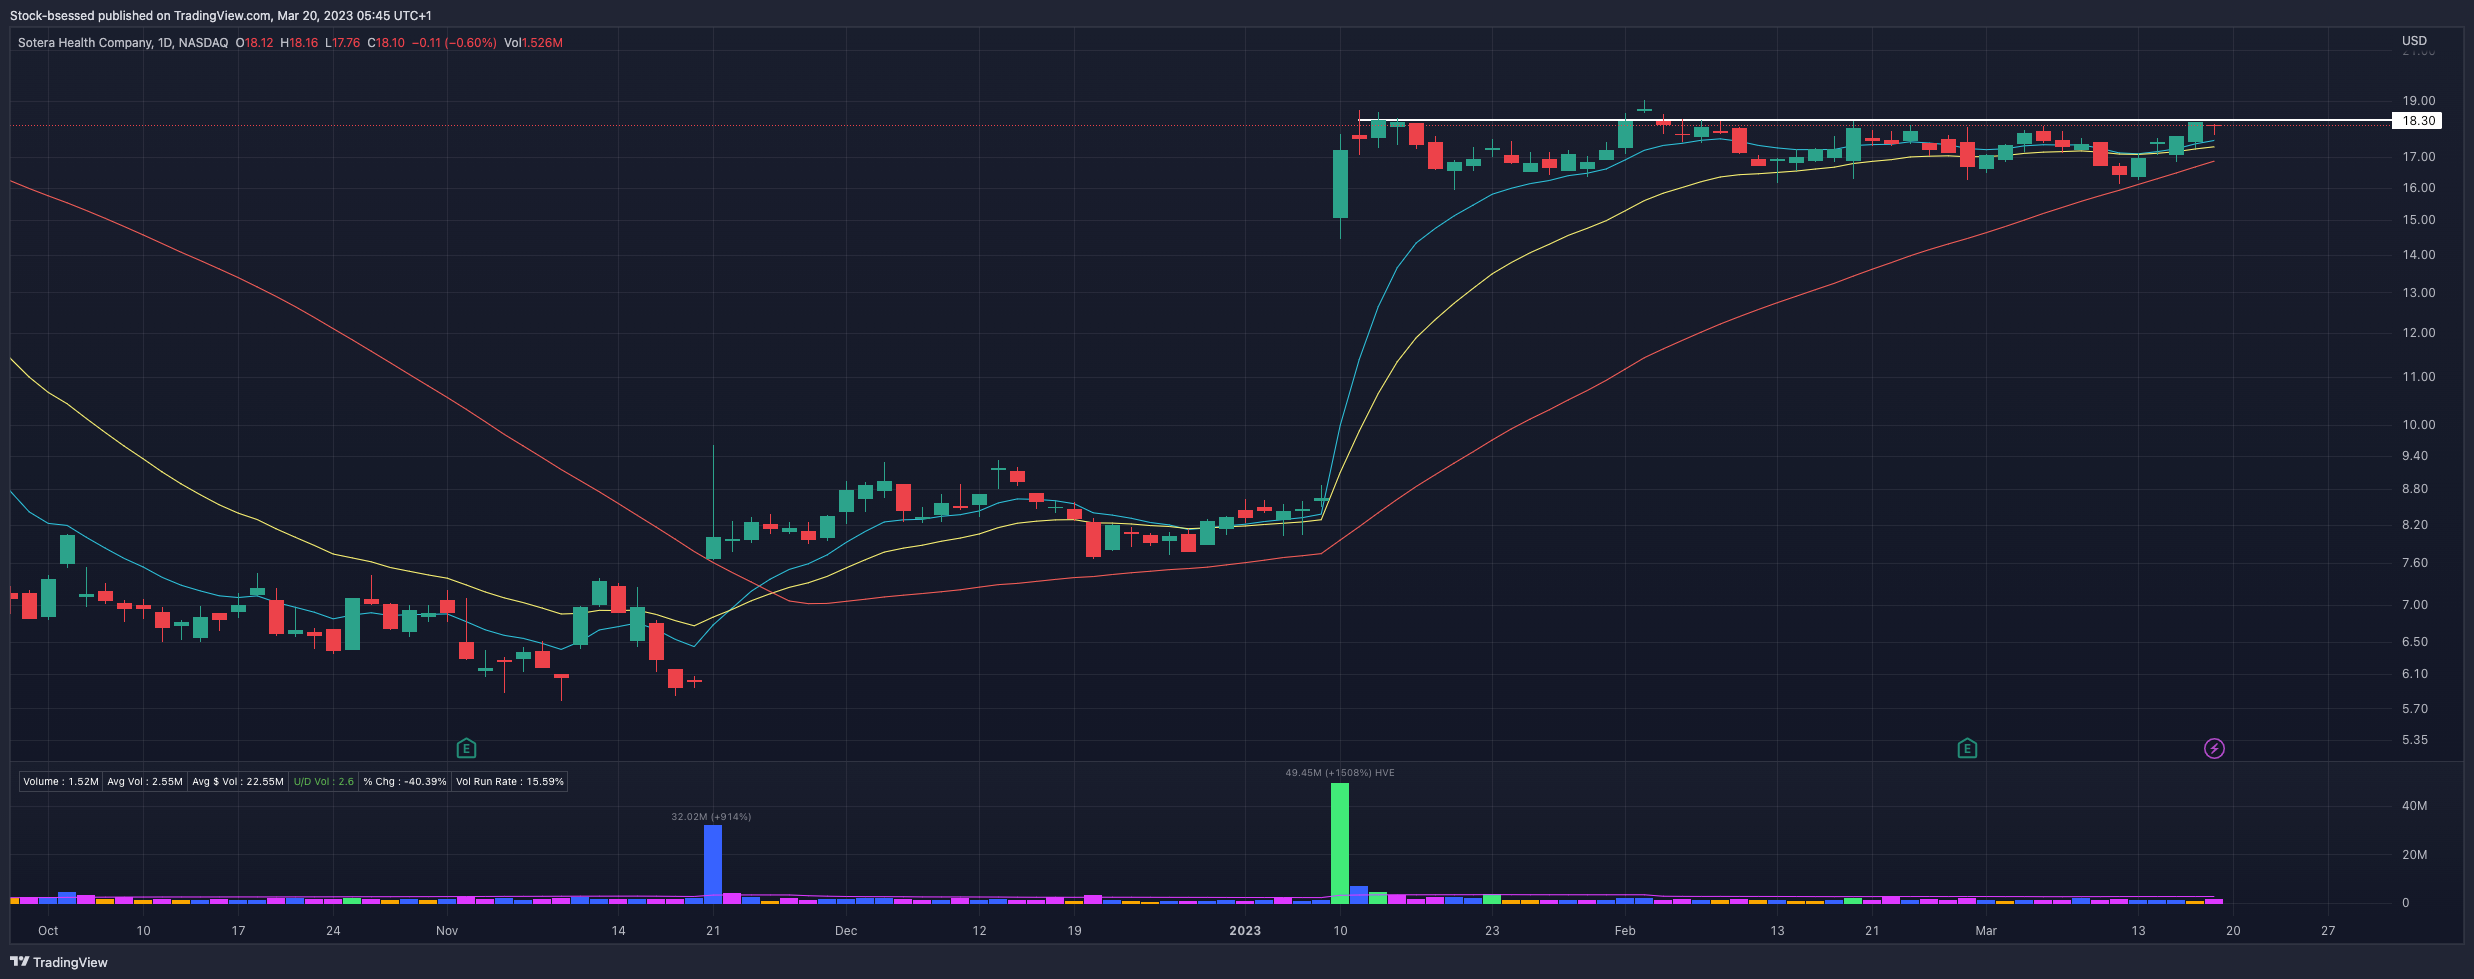
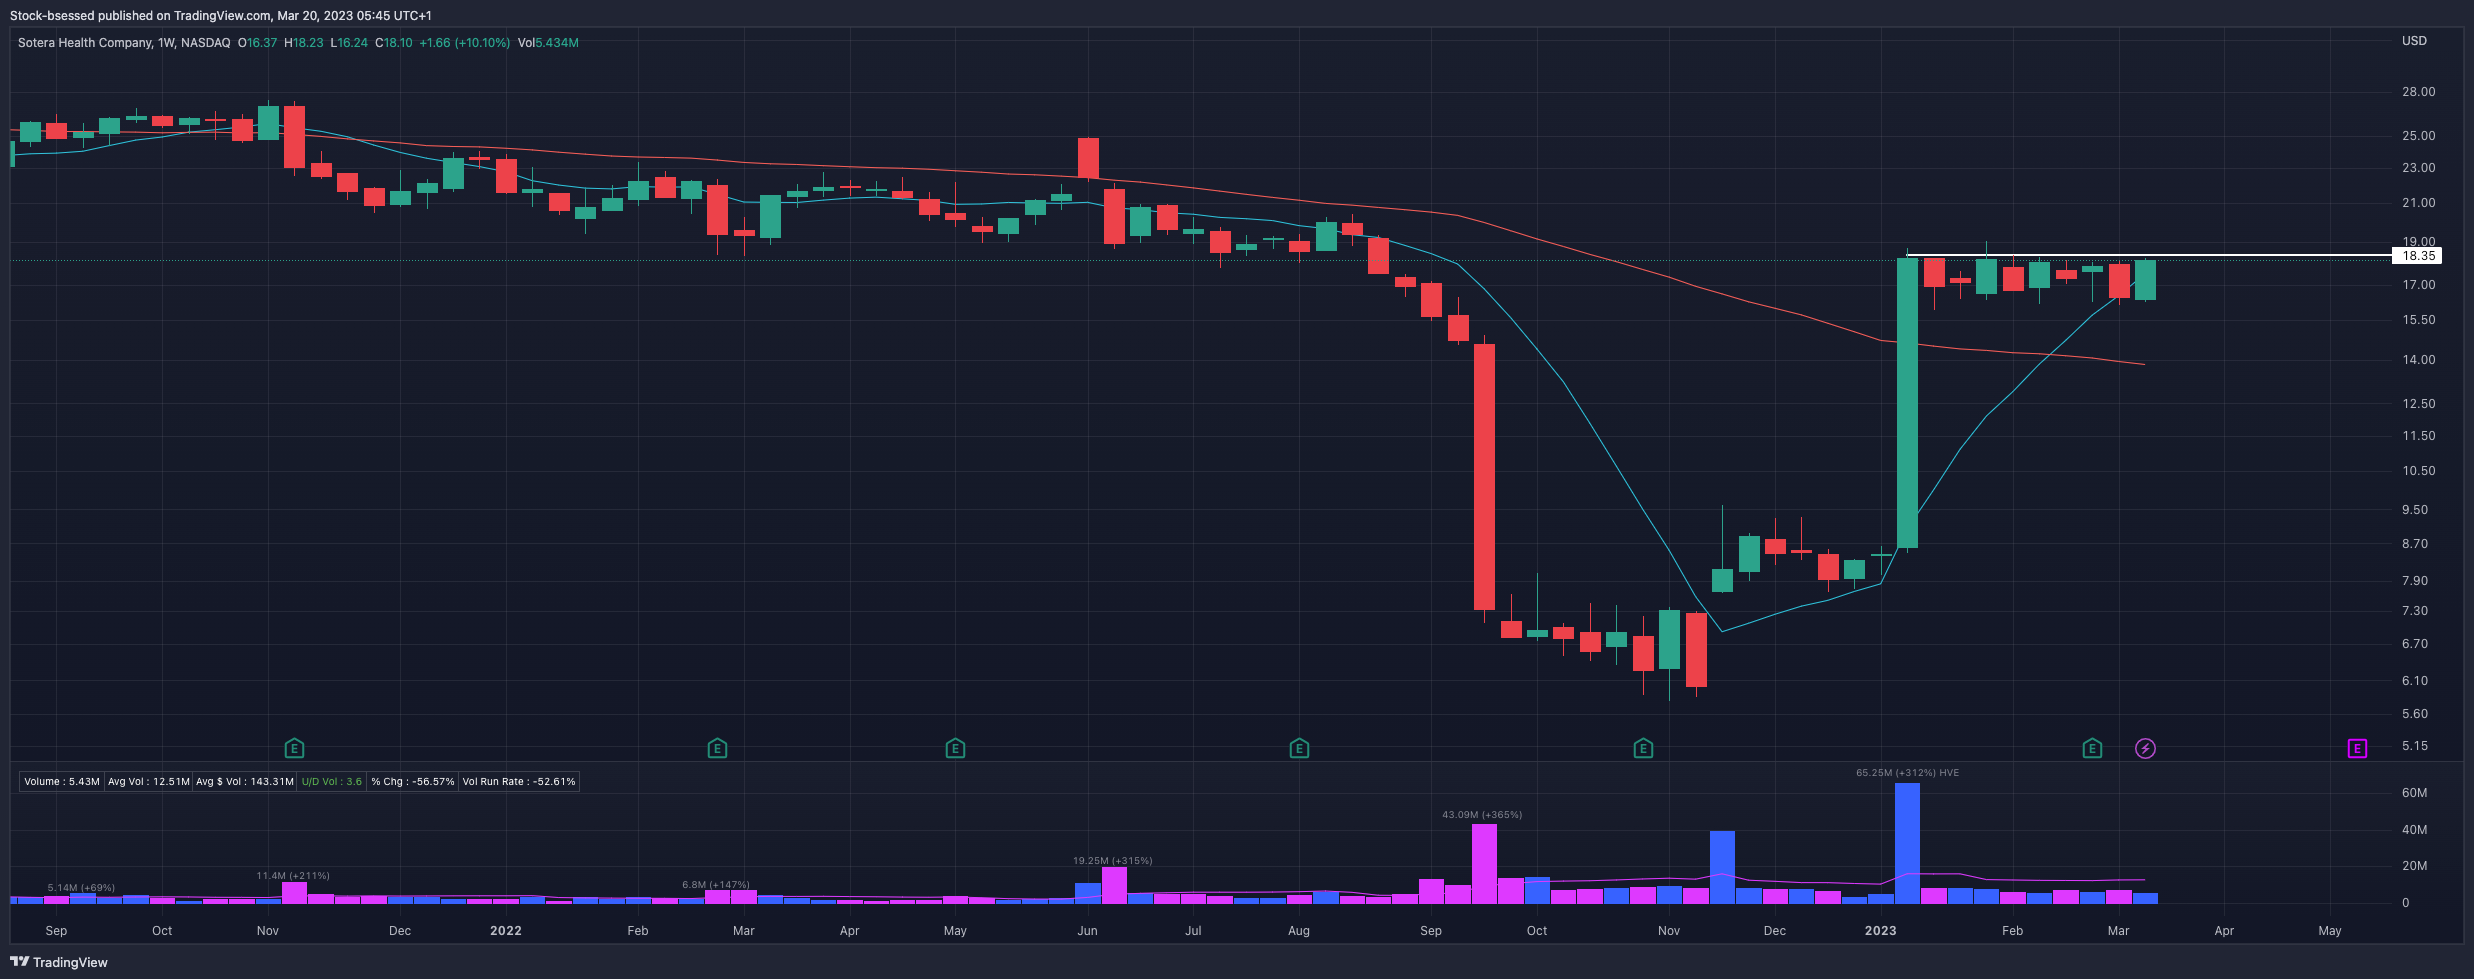
+10% Breakout
Upcoming Earnings For This Week

Personal Portfolio Update
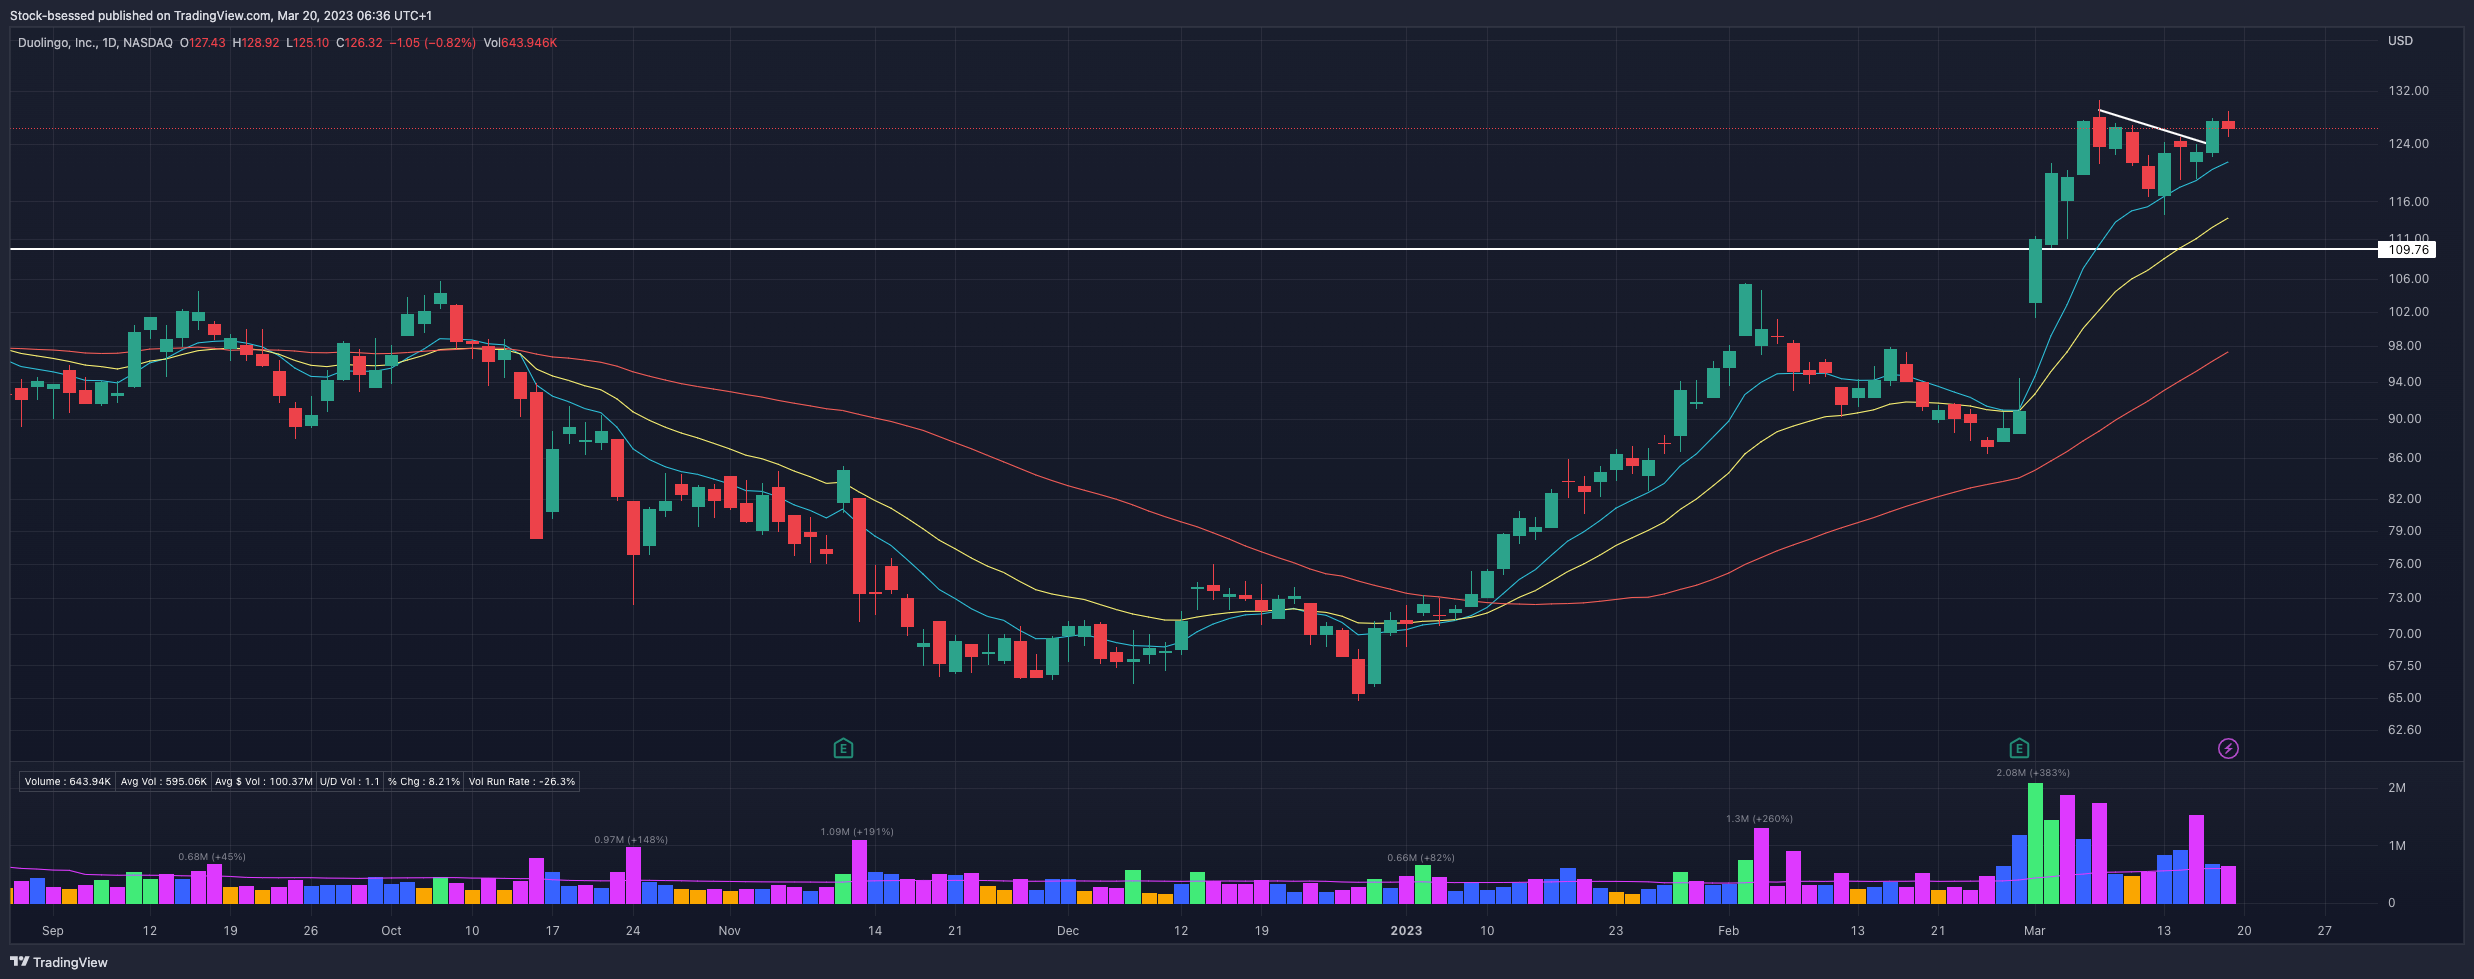
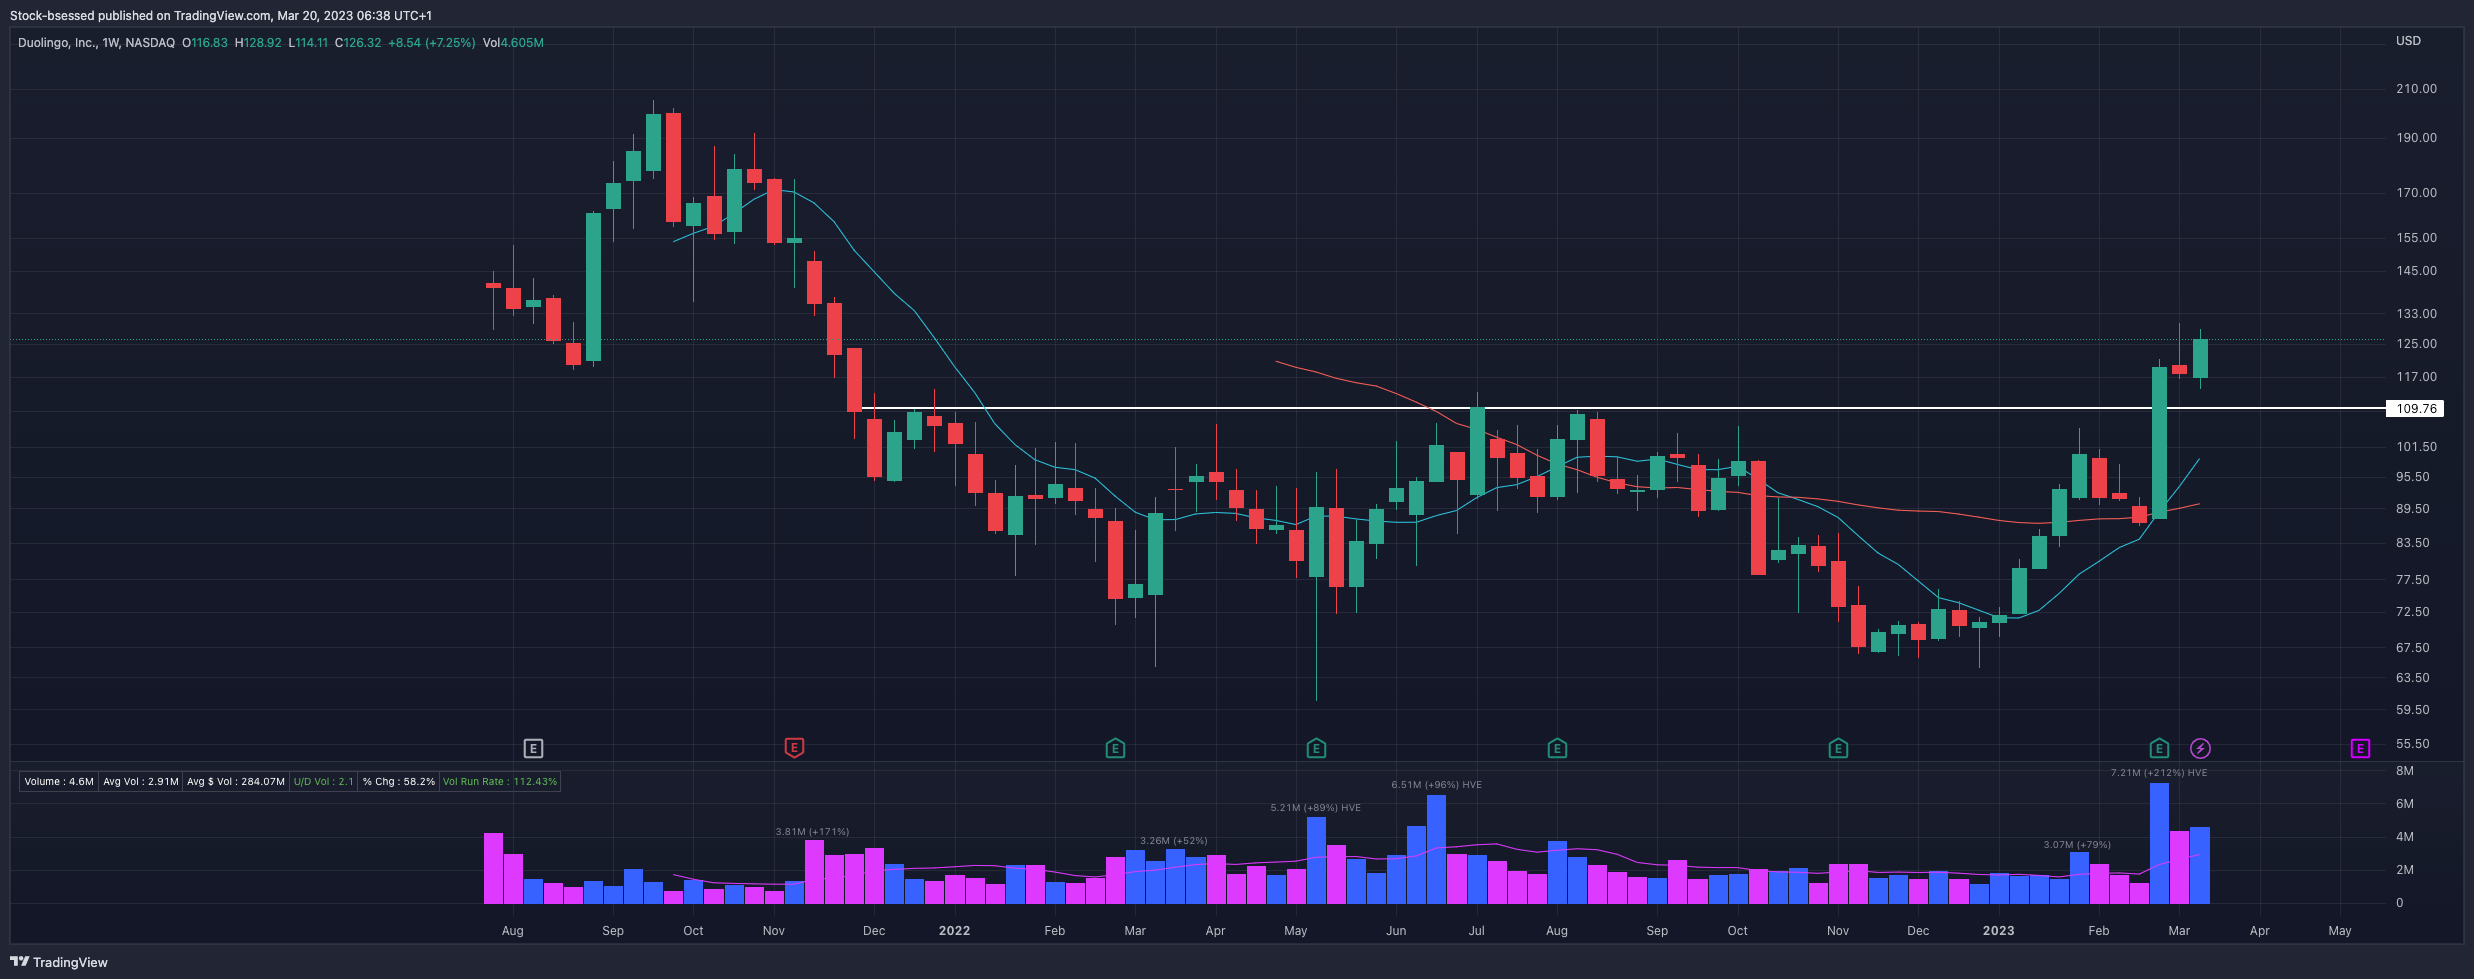
Still the only position I continue to hold after taking this descending trend line (DTL) setup on Thursday (124.67 cost basis), managing risk against the lows of that session as I like the strong push out of this initial IPO base fuelled by earnings, pullbacks to the 10EMA were supported with strong buying pressure showing up:
Watch List
Some potential setups that stood out:


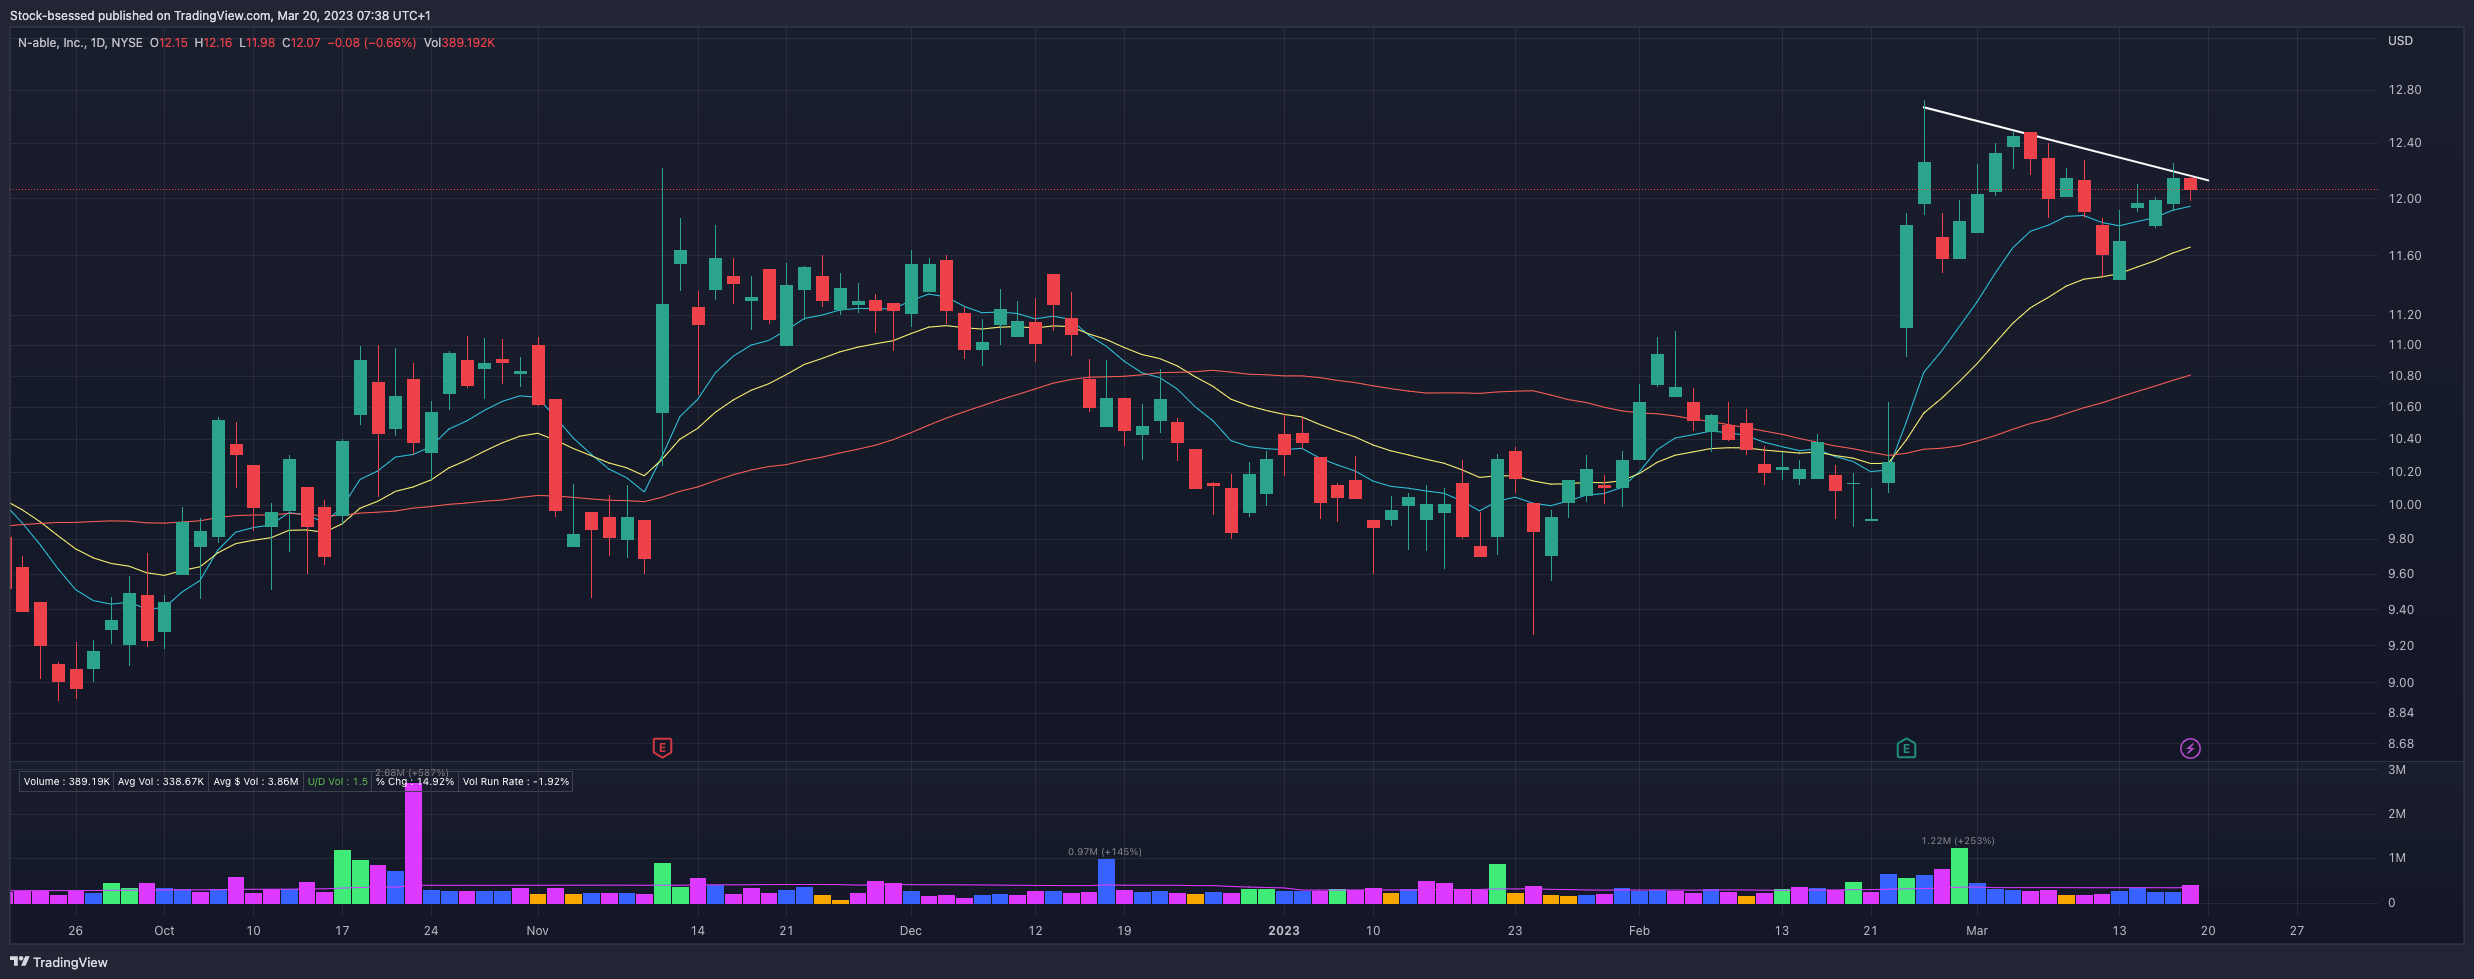
Weekly getting tight:


High Volume Close: