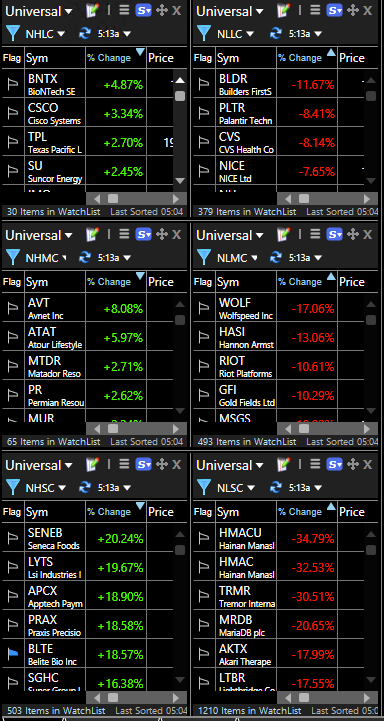
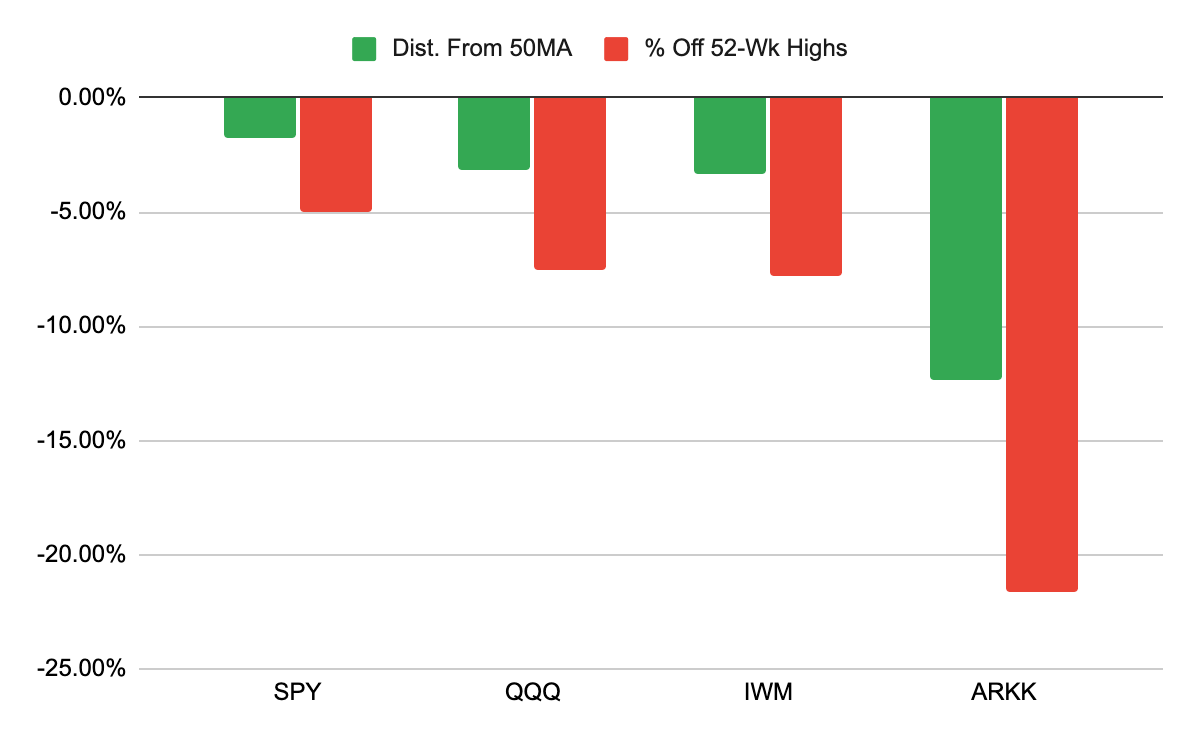
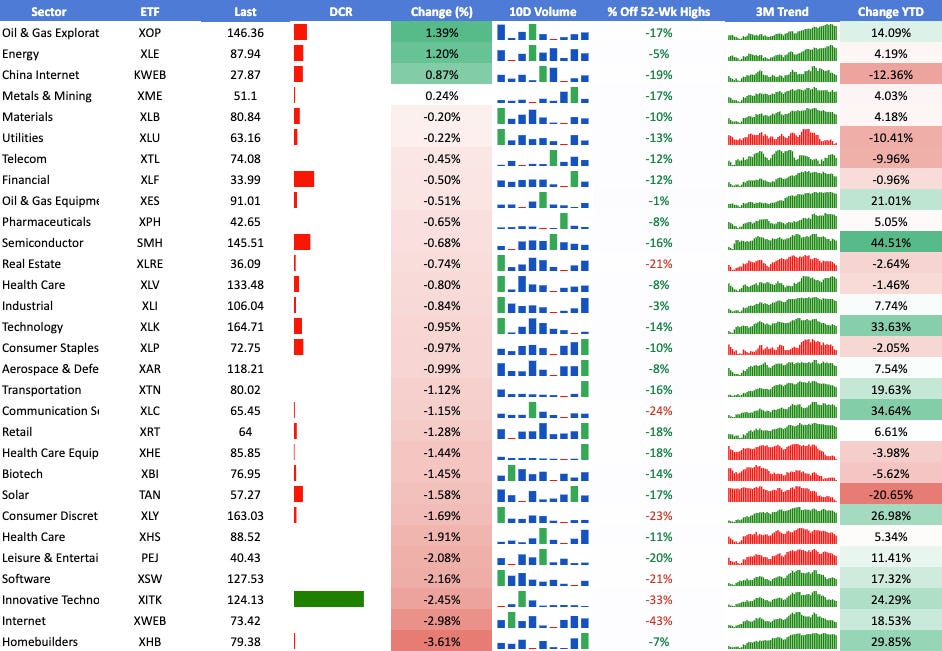
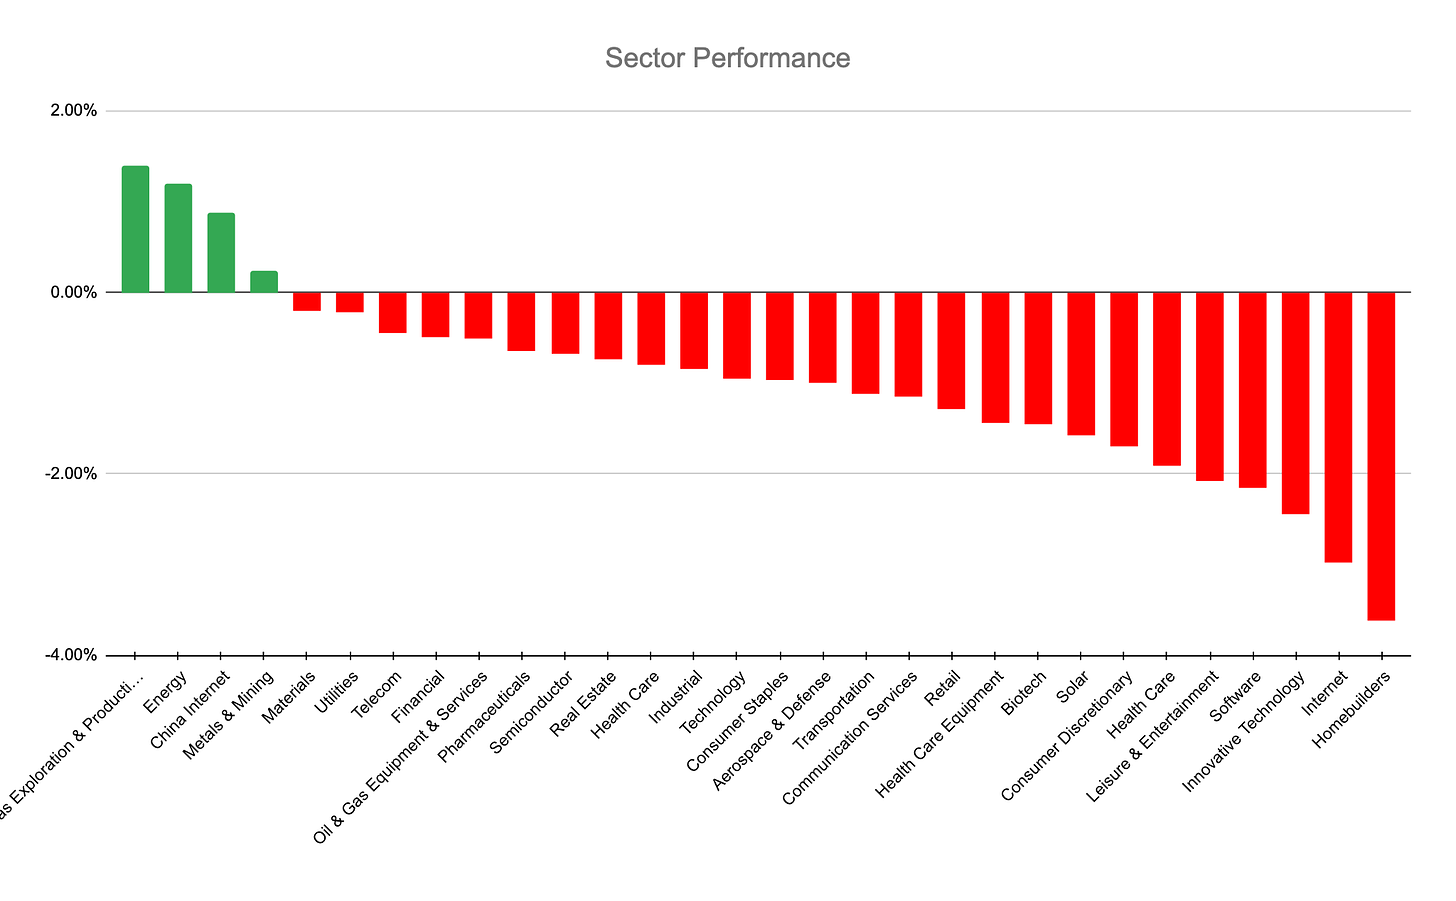
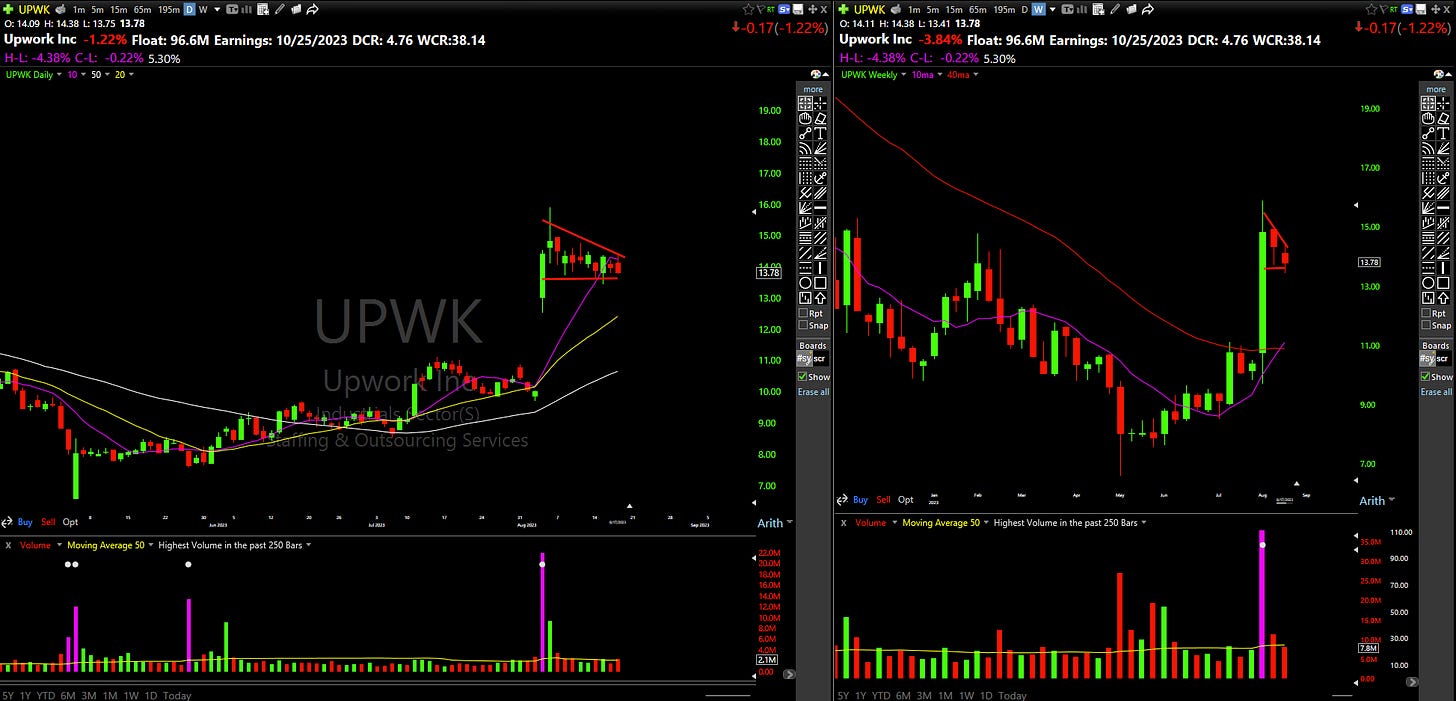
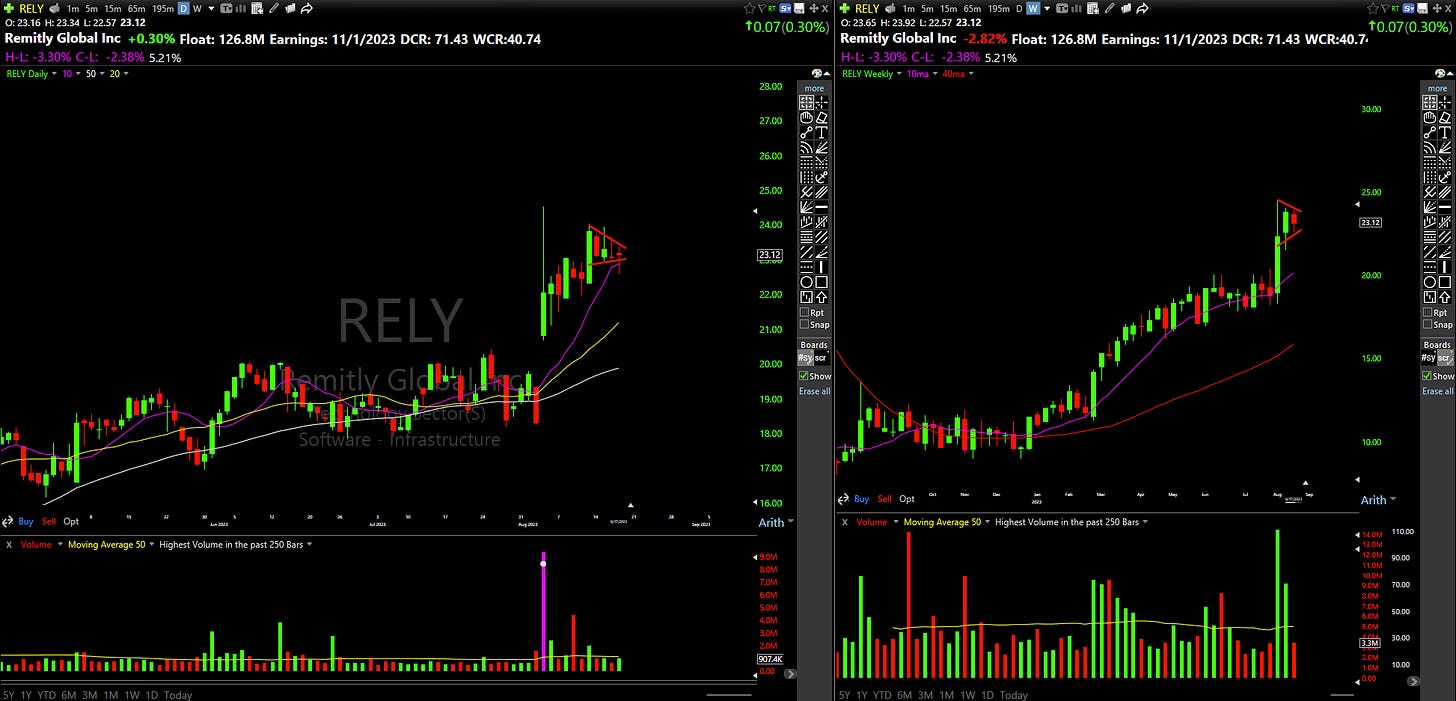
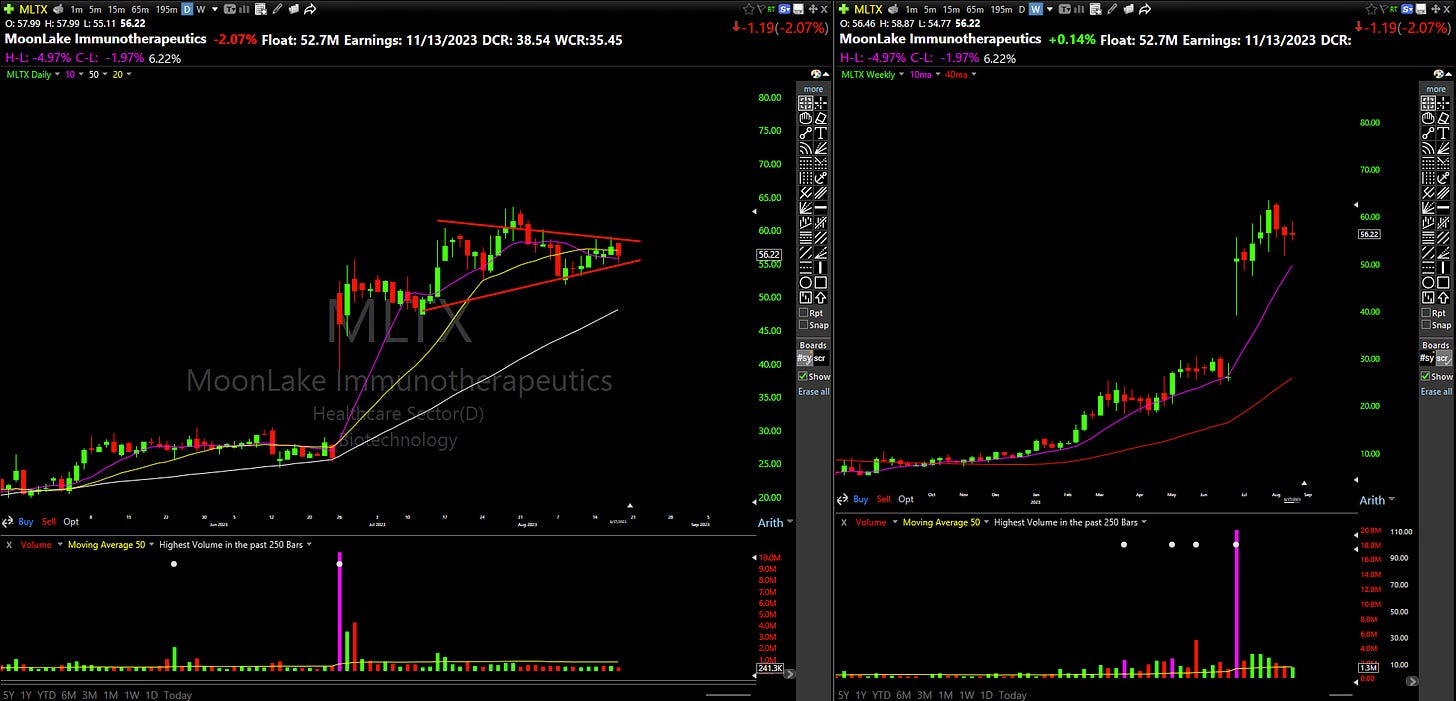
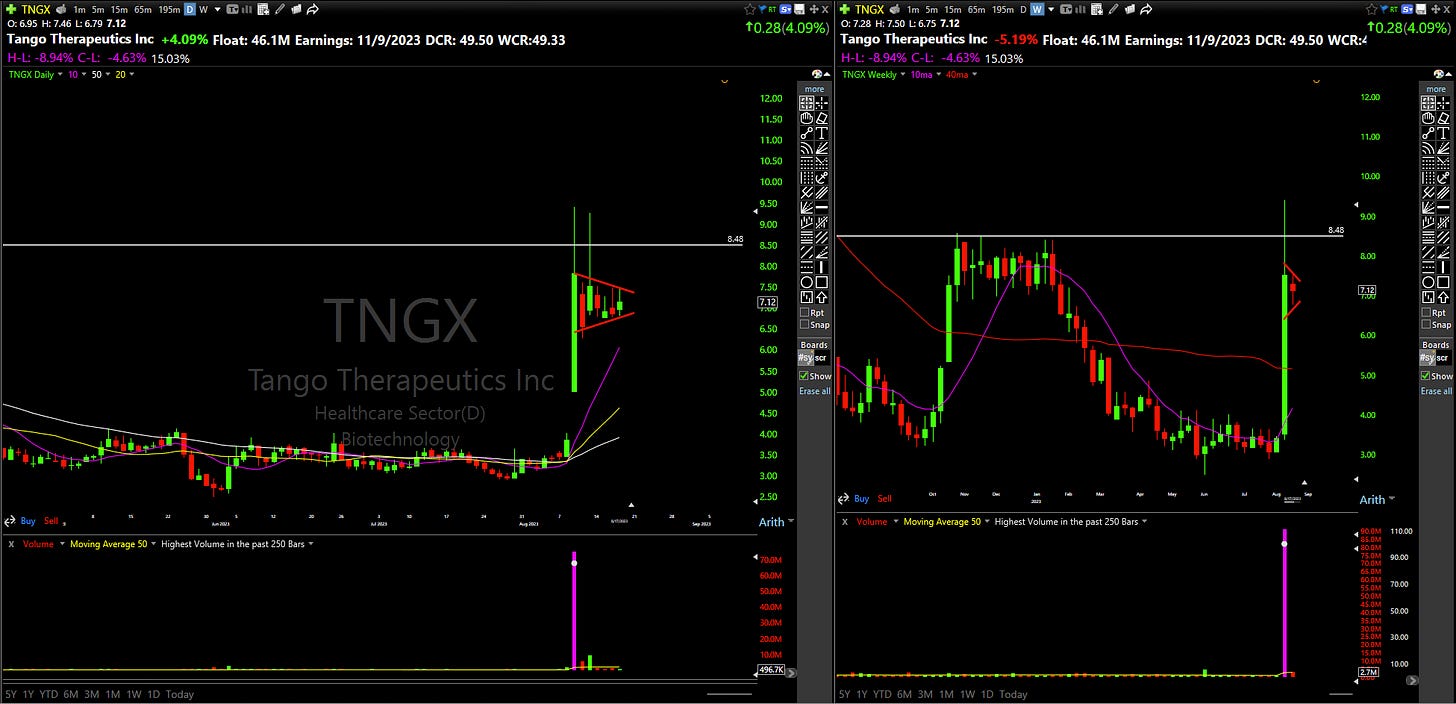
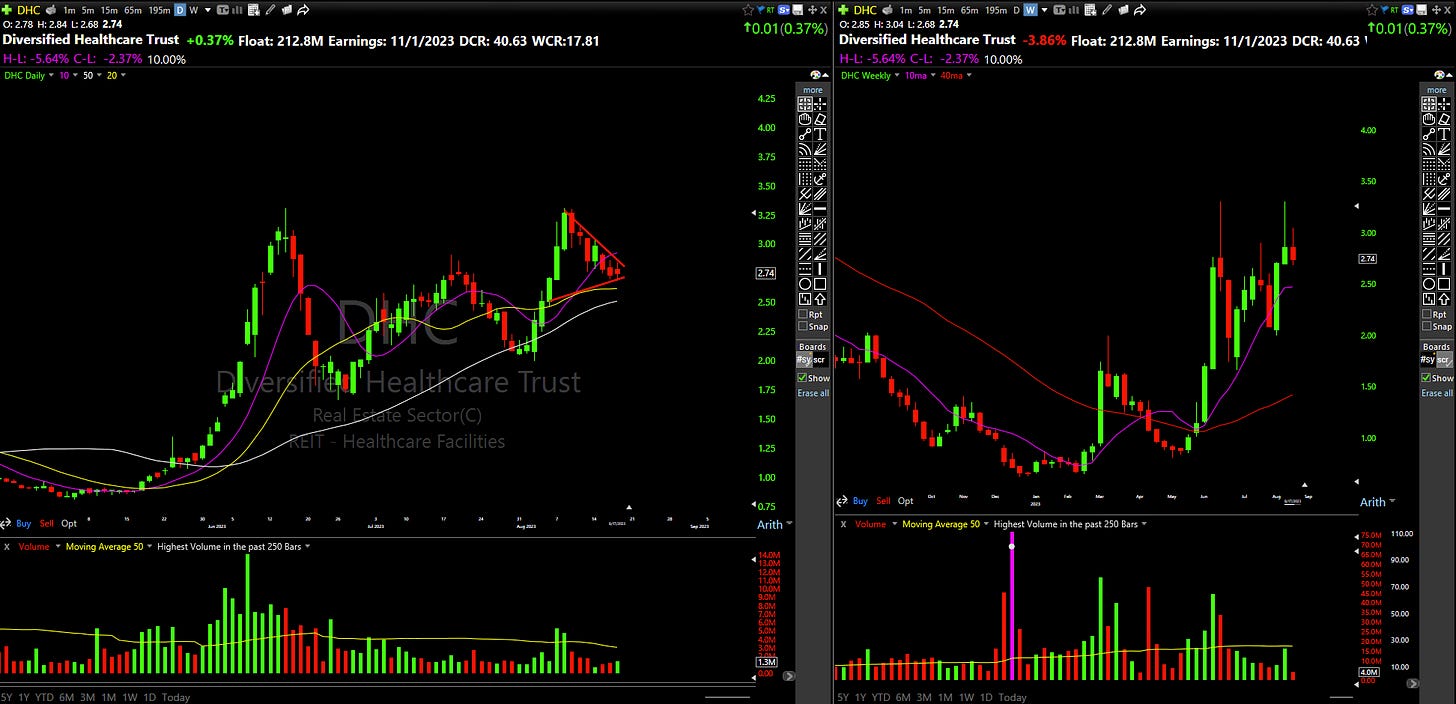
New lows continue to significantly outpace new highs - really not able to clearly identify my edge either way when the market looks like this and we are getting extended to the downside. For that reason, I have no desire to take on any risk heading into the weekend. Nonetheless I am tracking setups as always and still remaining in tune with the market:
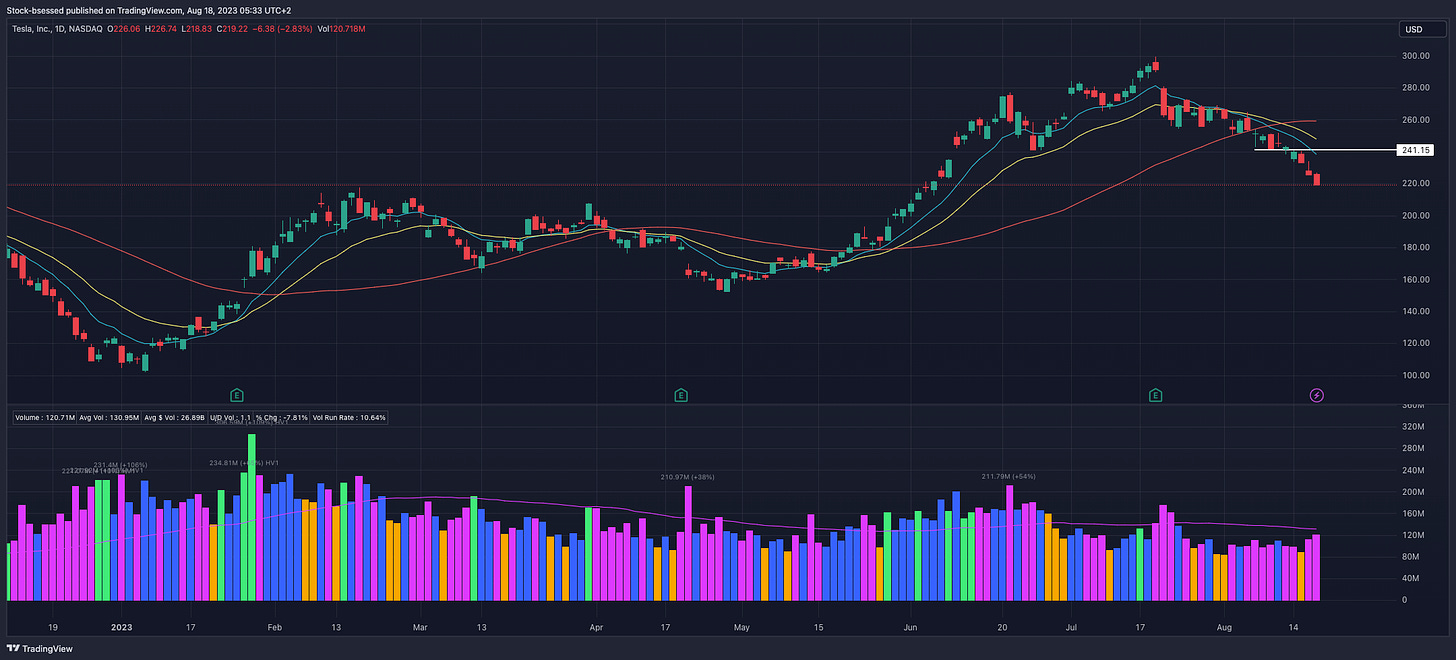
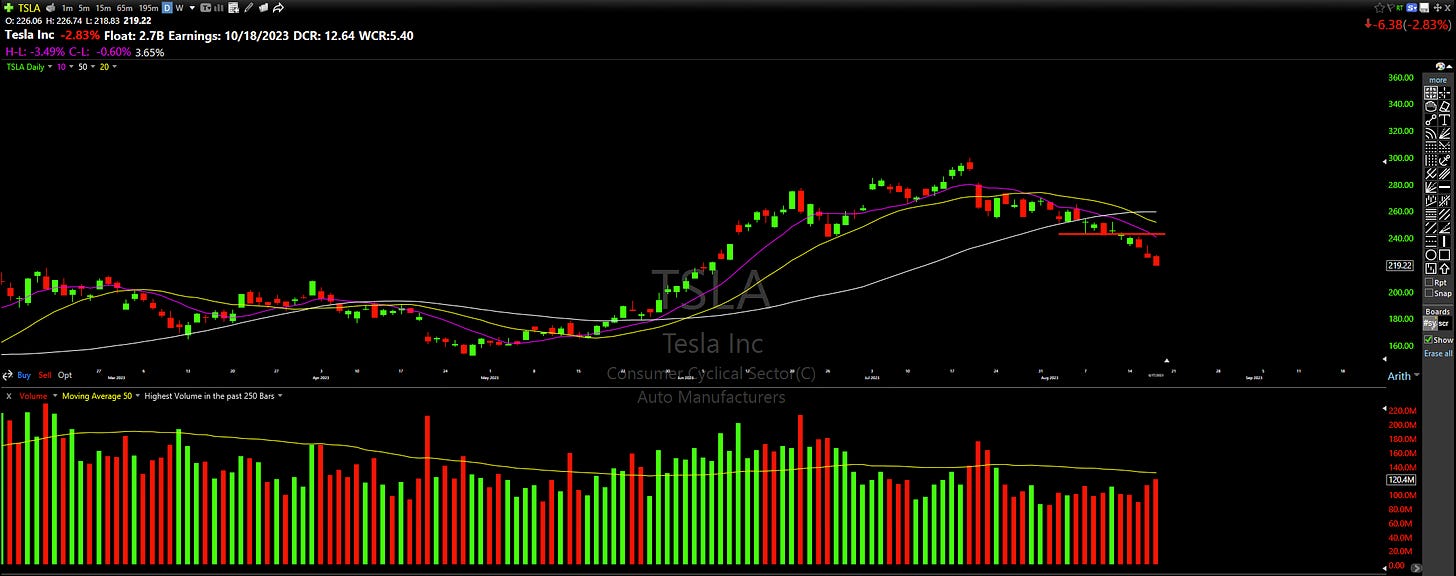
Please let me know which charts I post are more appealing to you guys:
Trading-view:
TC2000:
50 Free Charts 📈
Check out my website here for a FREE gift - stockbsessed.com
General Market Overview
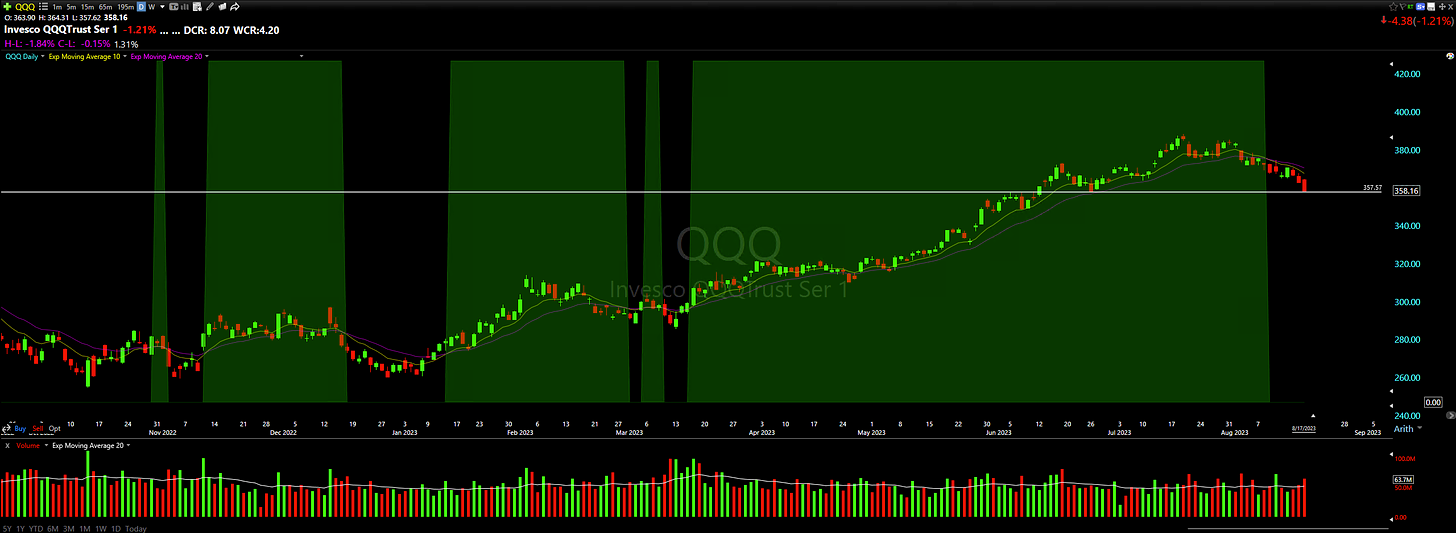
QQQ 0.00%↑ Showing that we may be approaching a relevant area for a potential bounce here as we are now 3 sessions down in a row and getting quite extended to the downside:
Leading Stocks Analysis
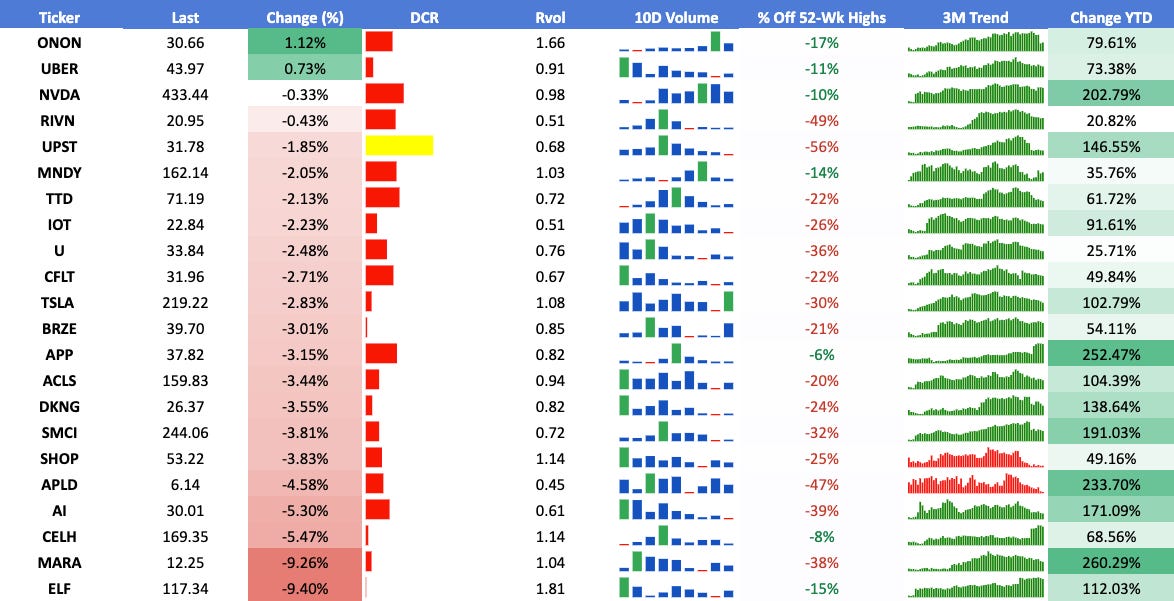
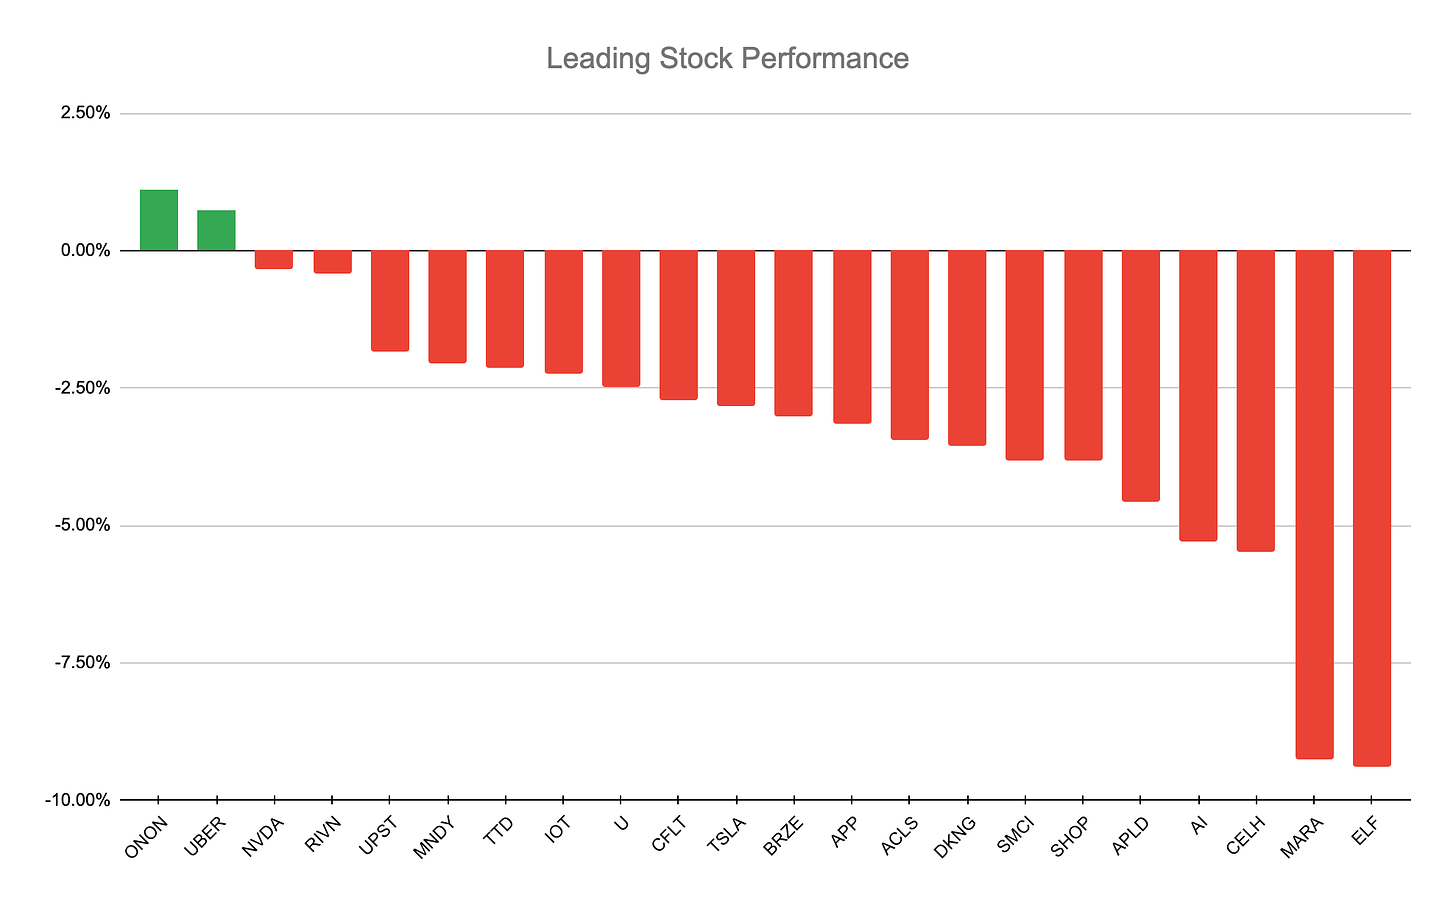
Very poor performance on the session with an average close of -3.18% for the below list - sellers remain in clear control for the time being with weak closes near the lows of the day:
I am linking the leaders watchlist in tradingview for your convenience, here
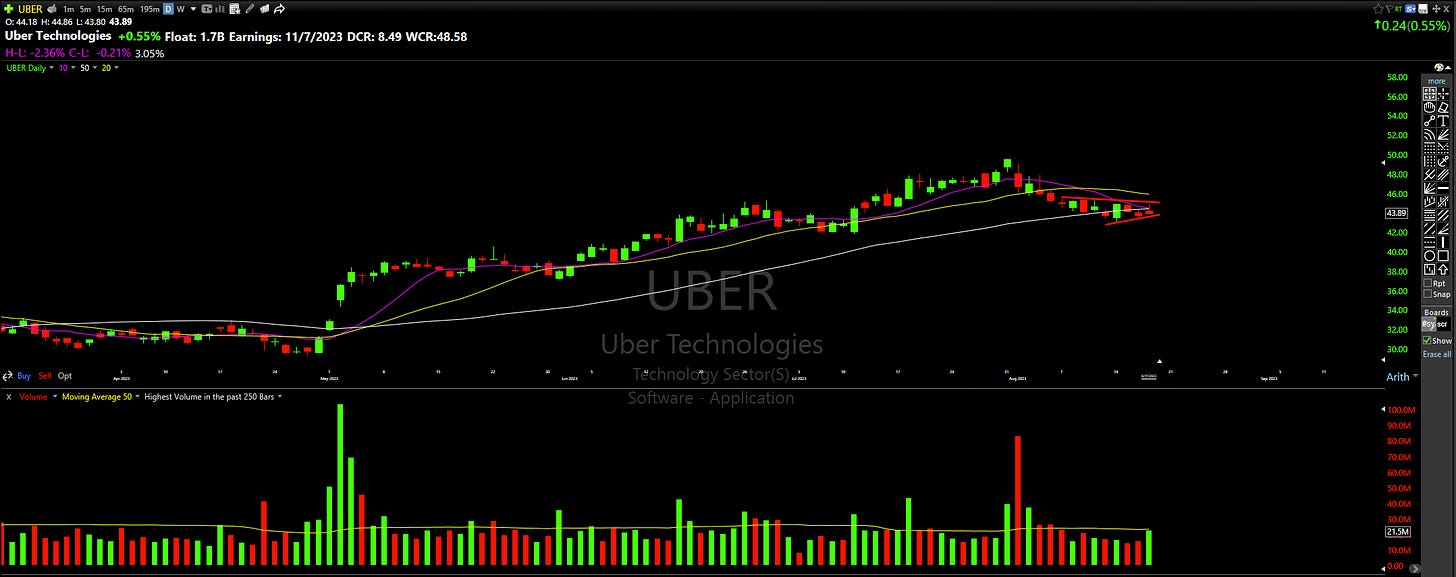
UBER 0.00%↑ Continued weakness since losing the 10-day which it tried reclaiming during today’s session but eventually got stuffed to close below it once more, going out right near the lows of the day as it tightens up in this recent range:
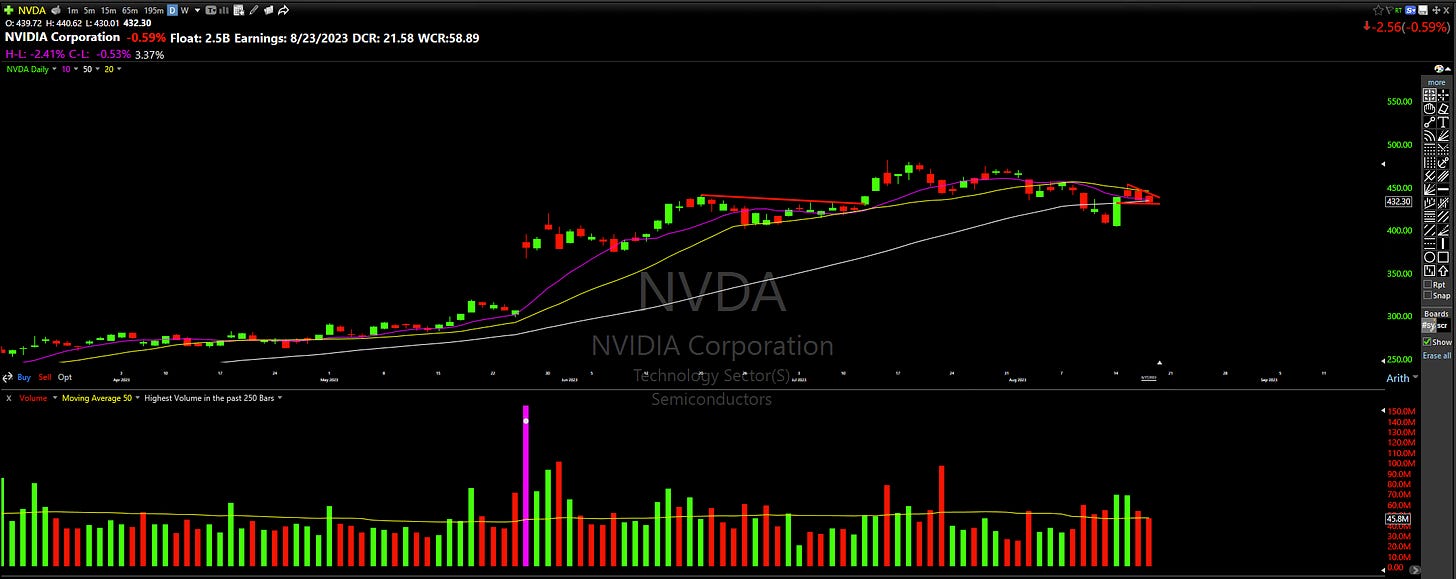
NVDA 0.00%↑ Pulling back in to the 50-day after a reclaim just a few sessions ago - may catch a pop if buyers are able to push this out of its little 3 day range here but all eyes seem to be waiting on this to report earnings on the 23rd:
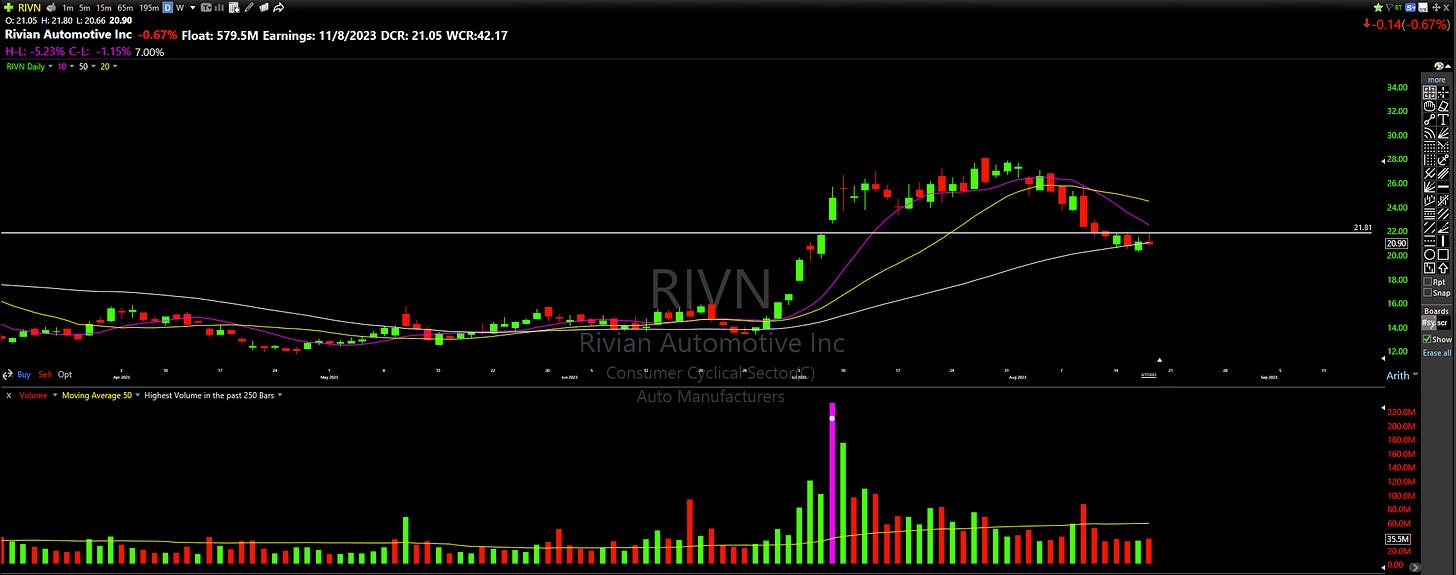
RIVN 0.00%↑ Attempting to tighten up over the last few session as this sits right on the 50-day MA. We are reaching oversold levels in the general market and a bounce soon would not surprise me - a push out of this recent range and through the 22 area could push this higher:
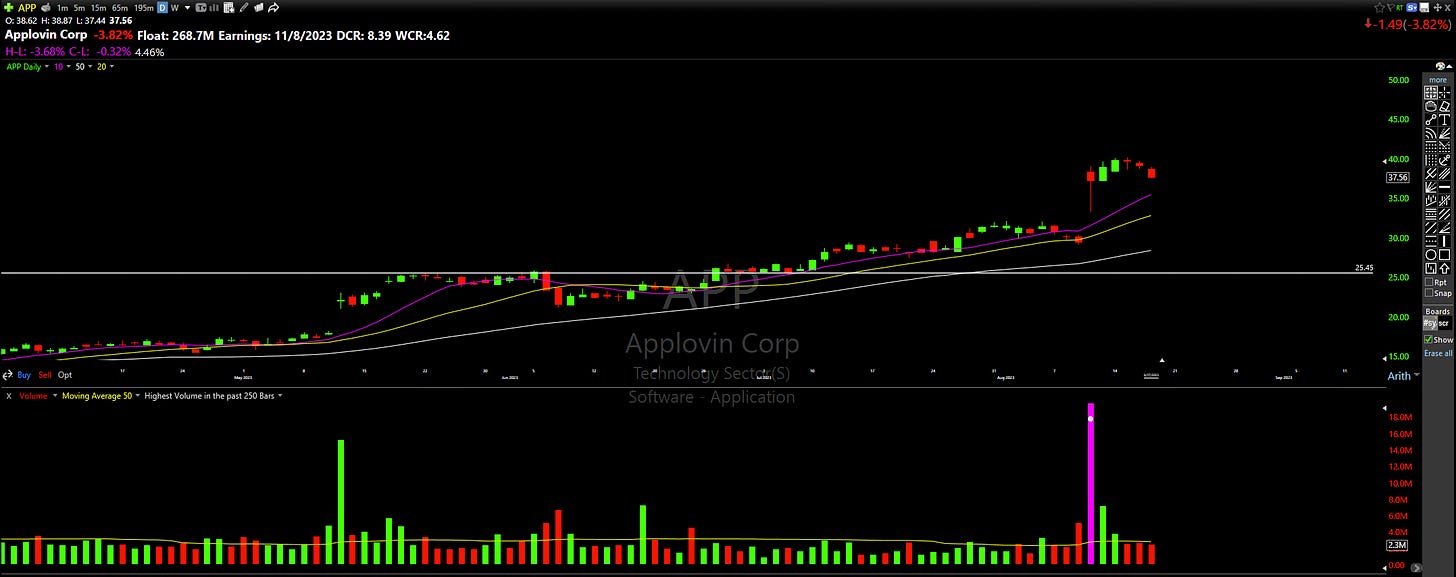
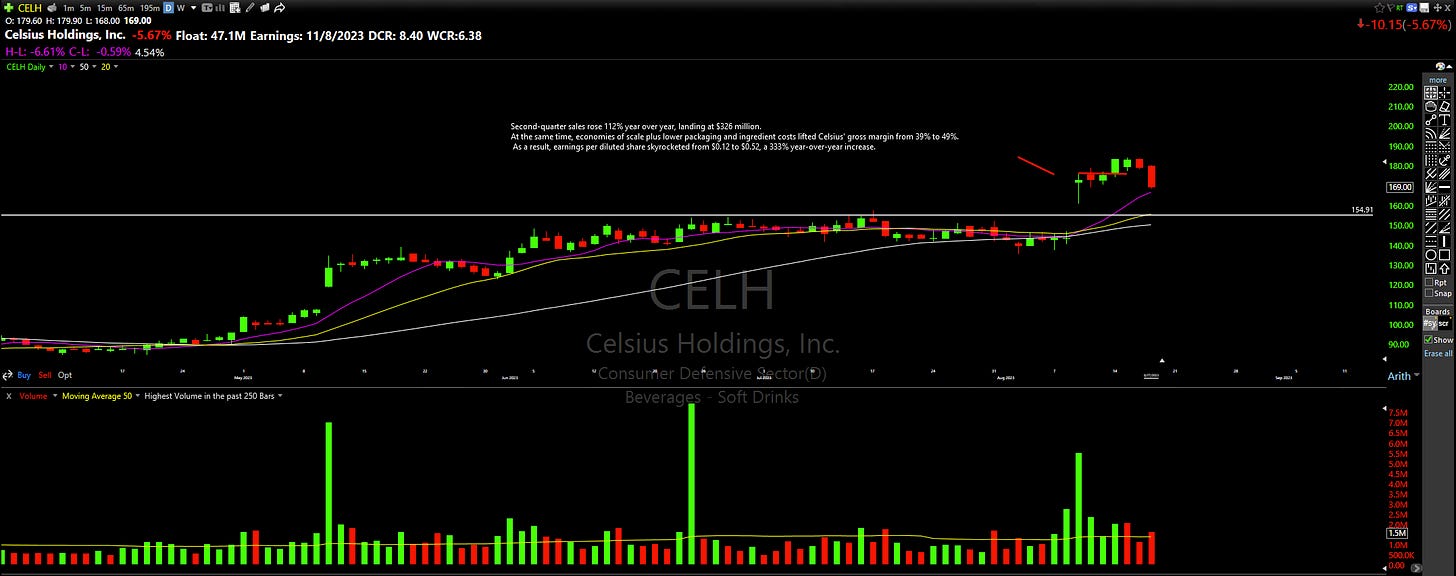
APP 0.00%↑ CELH 0.00%↑ 2 Strong names that are trying not to give too much back while allowing the KMAs to catch up to price:
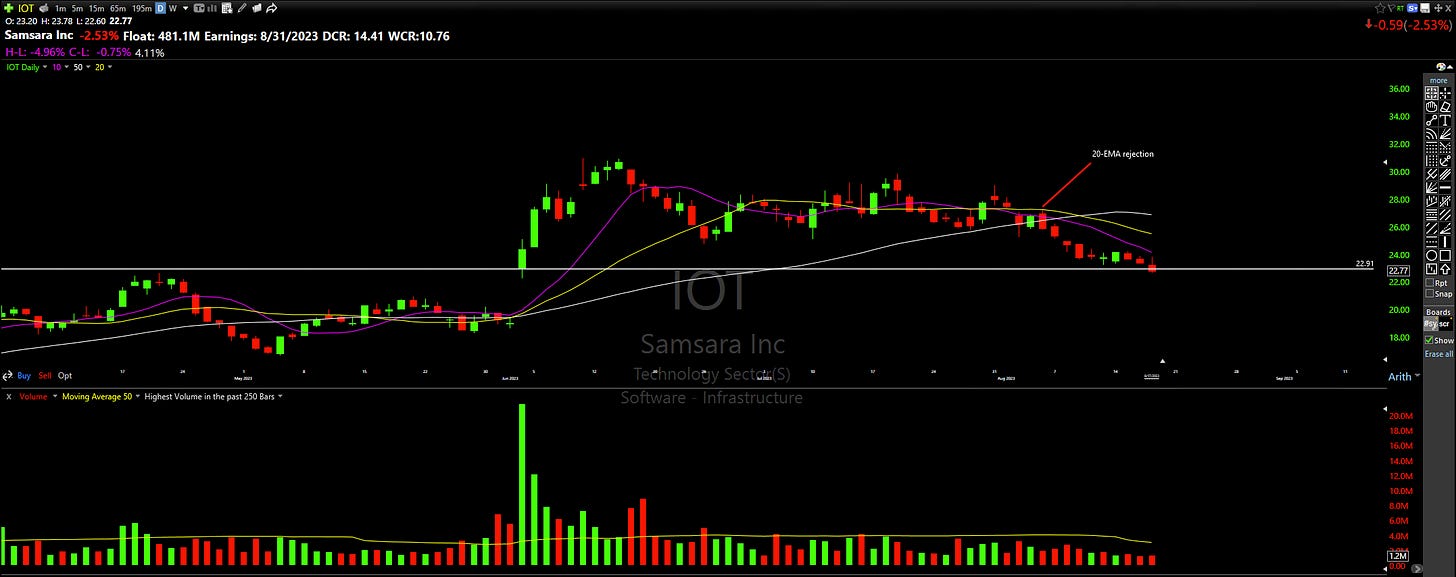
IOT 0.00%↑ Remains an avoid for me - continues acting poorly losing key areas of support, now heading towards the recent gap-up (HVE) day’s lows
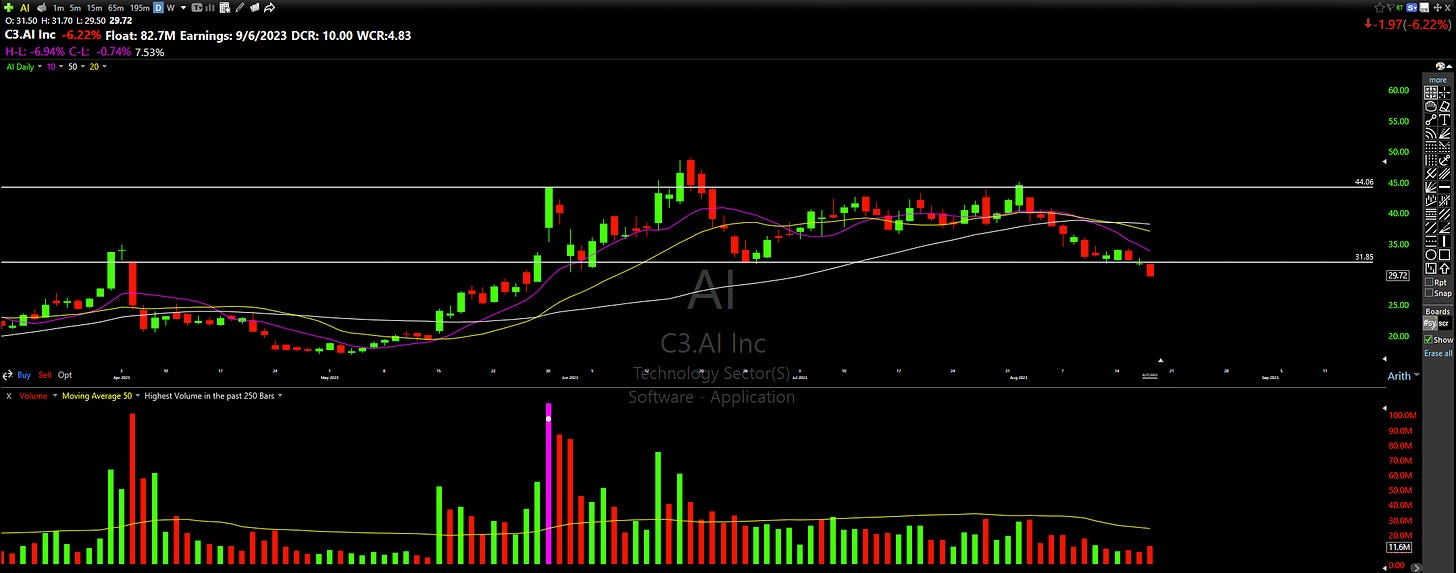
AI 0.00%↑ Continued distribution as we lose some more key areas of support that have held up until recently:
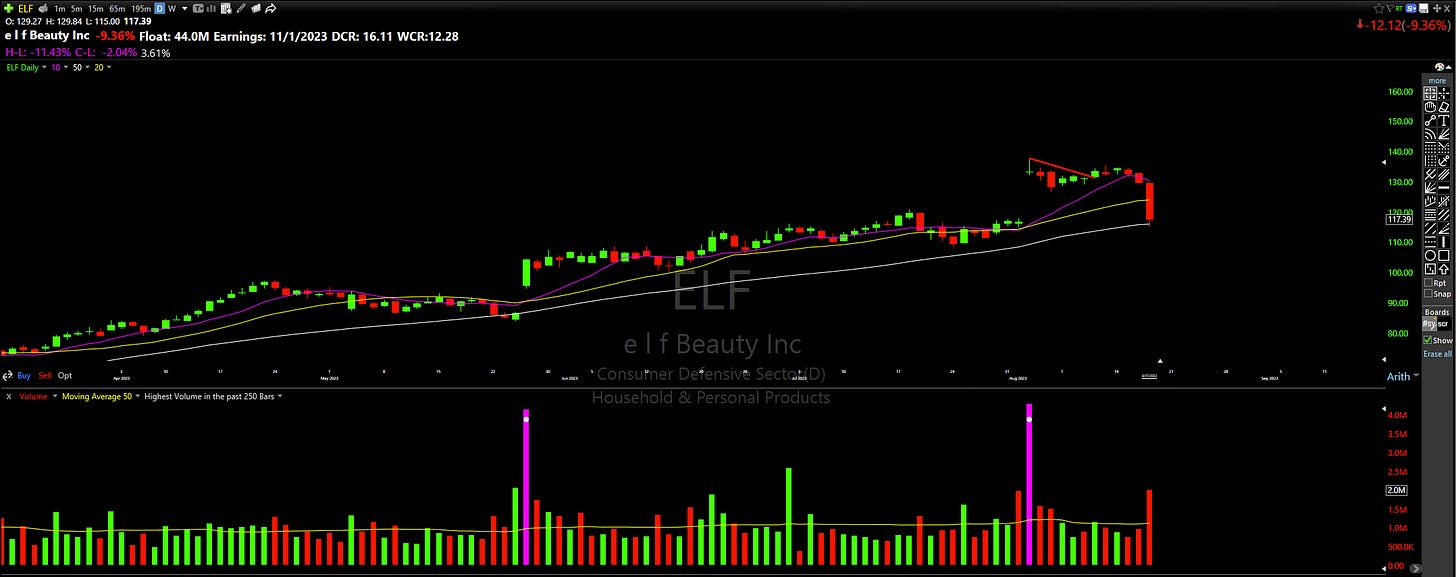
ELF 0.00%↑ More warning signs going off when one of the strongest trending names in the market has a wide-ranged distribution day on volume as it slips -9.3% on the session to close right above the 50-day:
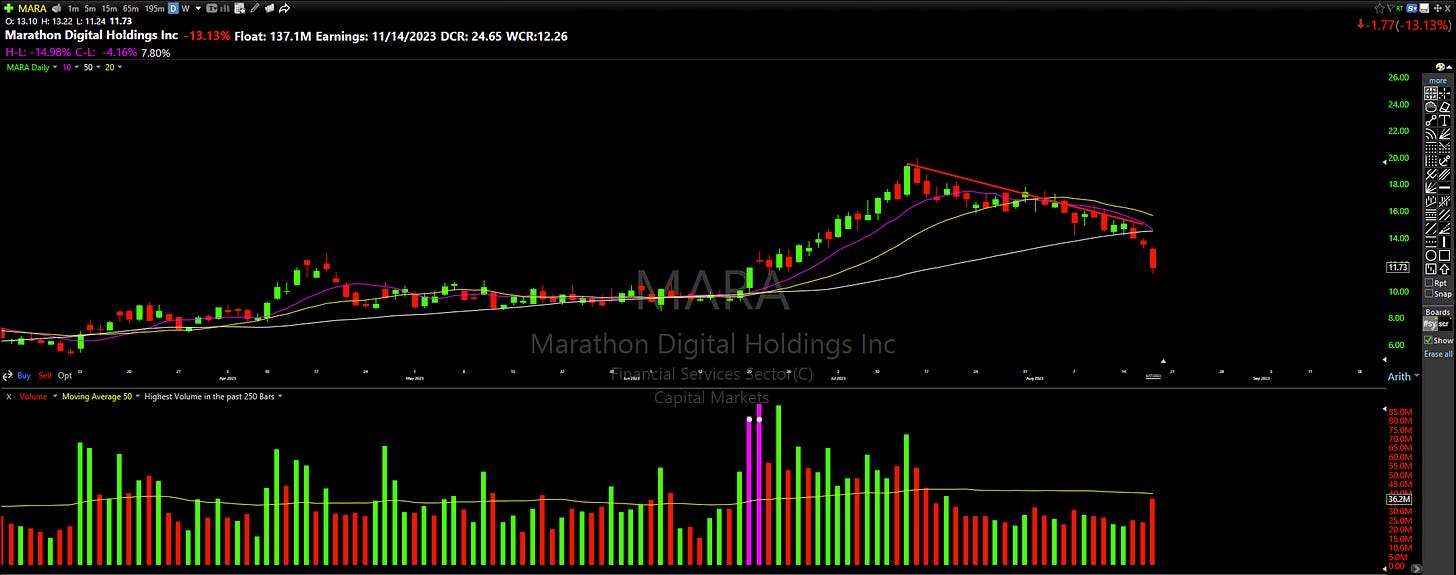
MARA 0.00%↑ Continued selling here in line with the recent weakness seen in bitcoin:
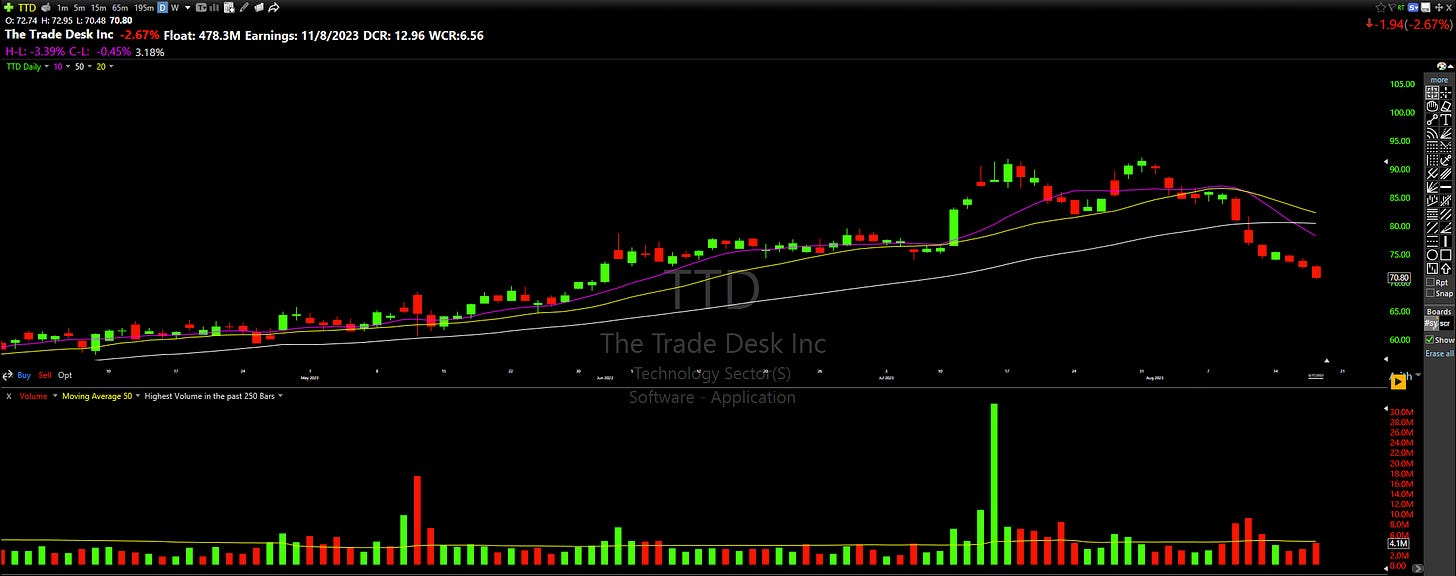
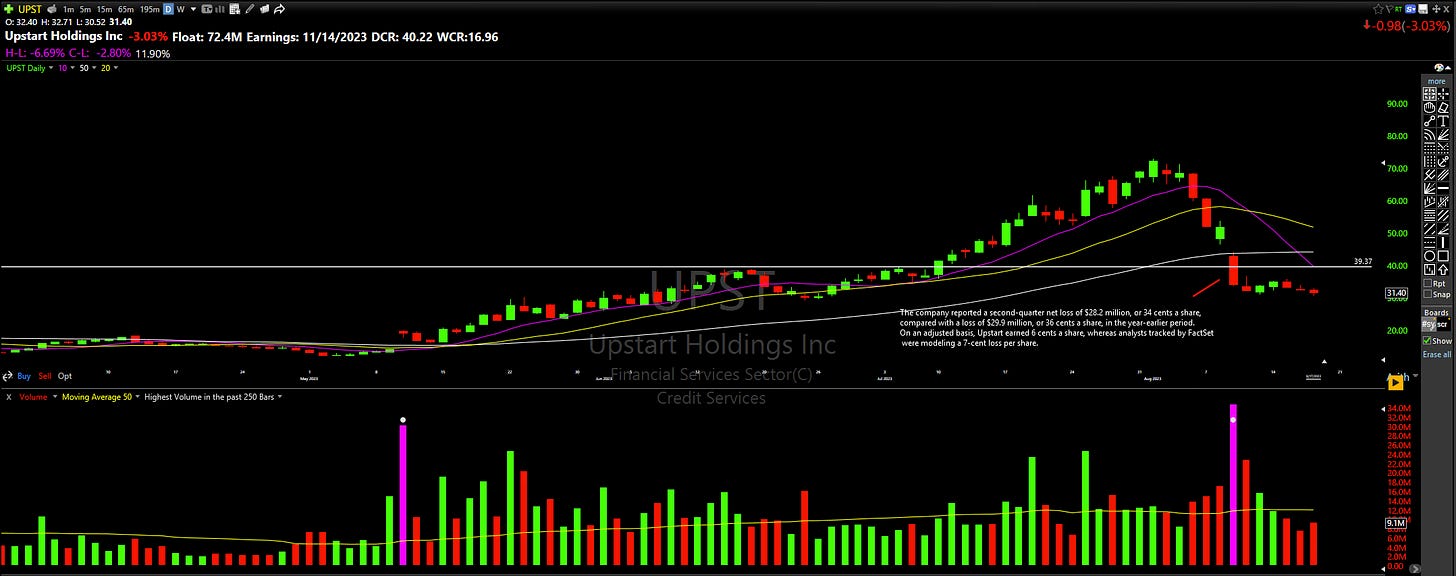
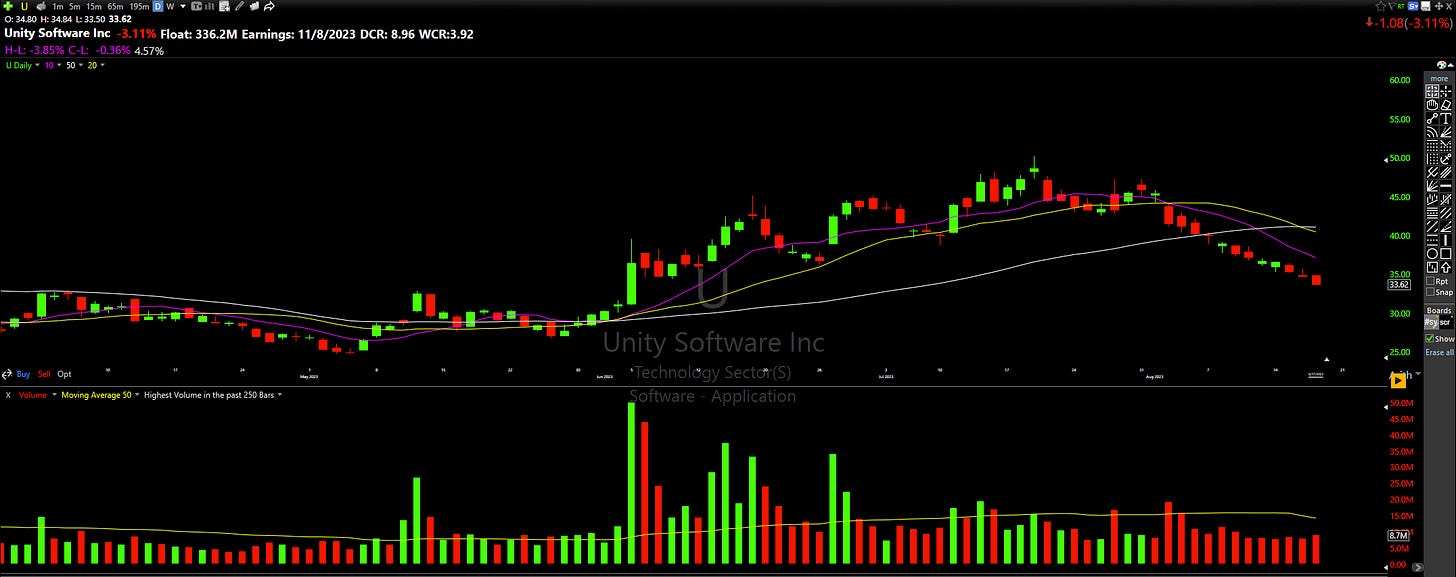
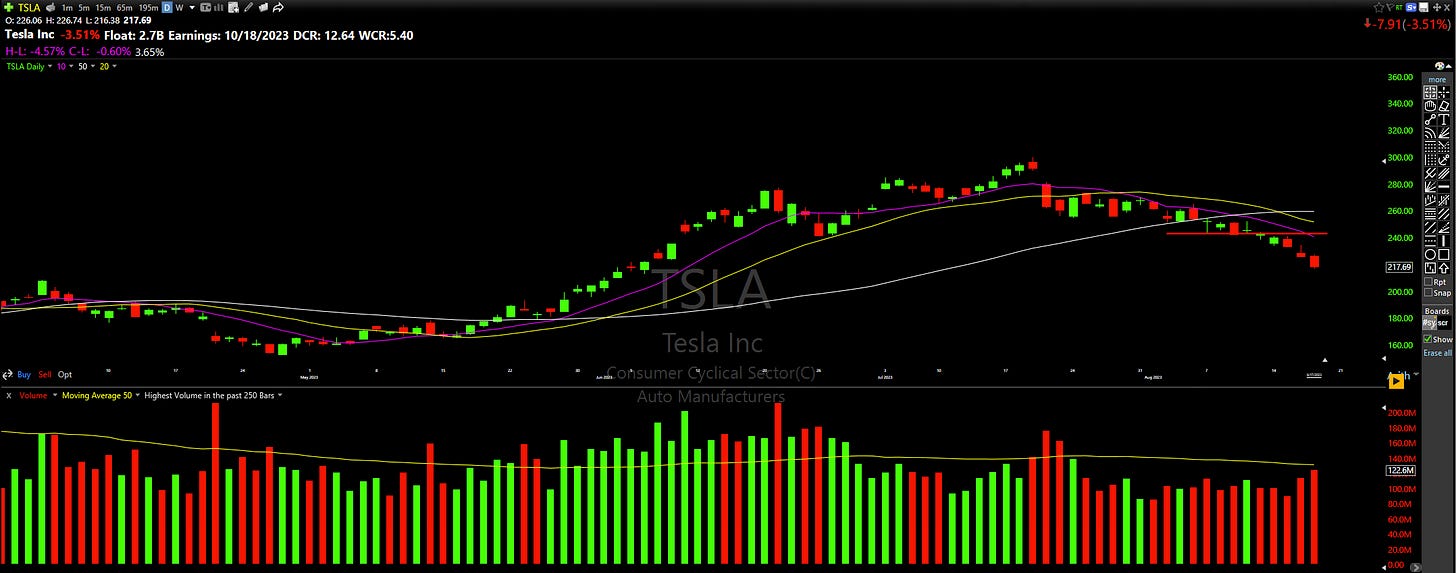
No reason to do anything with stocks that look like this - clear avoid until they stop getting rejected by the declining moving averages and prove themselves:
Individual Sector Analysis
I am linking the sectors watchlist in tradingview for your convenience, here
Most look terrible - below declining moving averages with several recent rejections. Energy is just about the only thing that does not look horrible right now and alone gives an indication for the type of environment we are in:
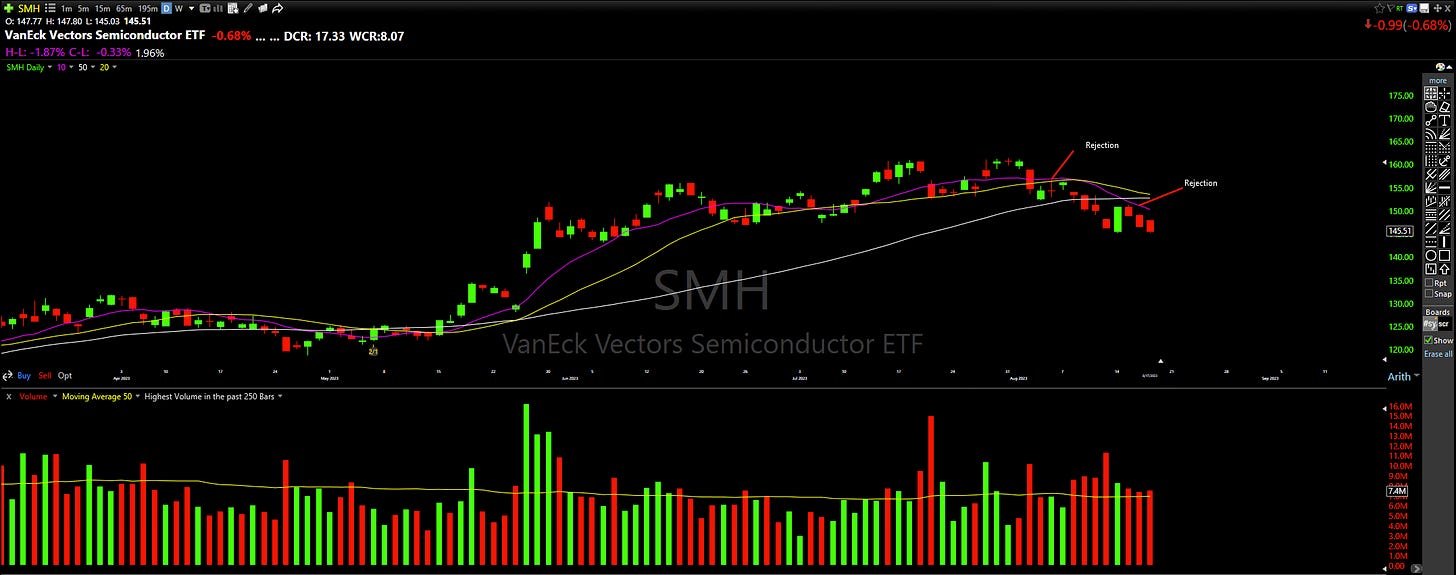
SMH 0.00%↑ Clear change in trend recently as this now continues undergoing distribution while encountering sellers at the declining moving averages:
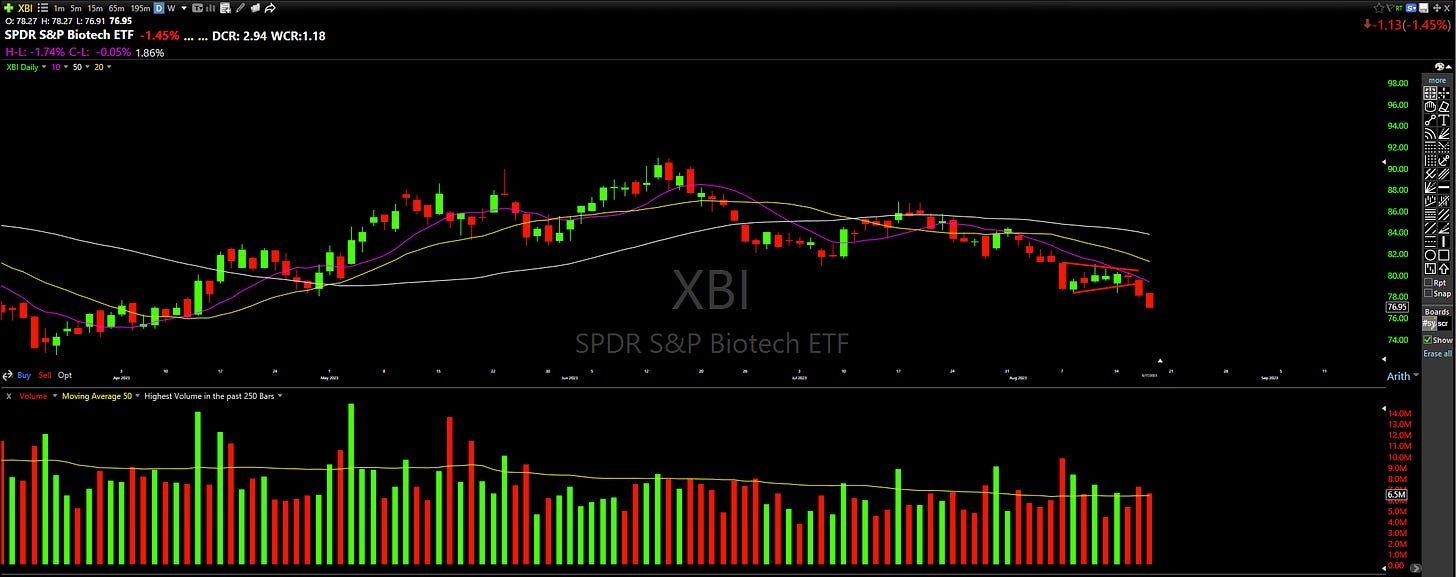
XBI 0.00%↑ Tightens up in this range it formed over a few sessions while coming in to the declining moving averages before breaking down lower once again:
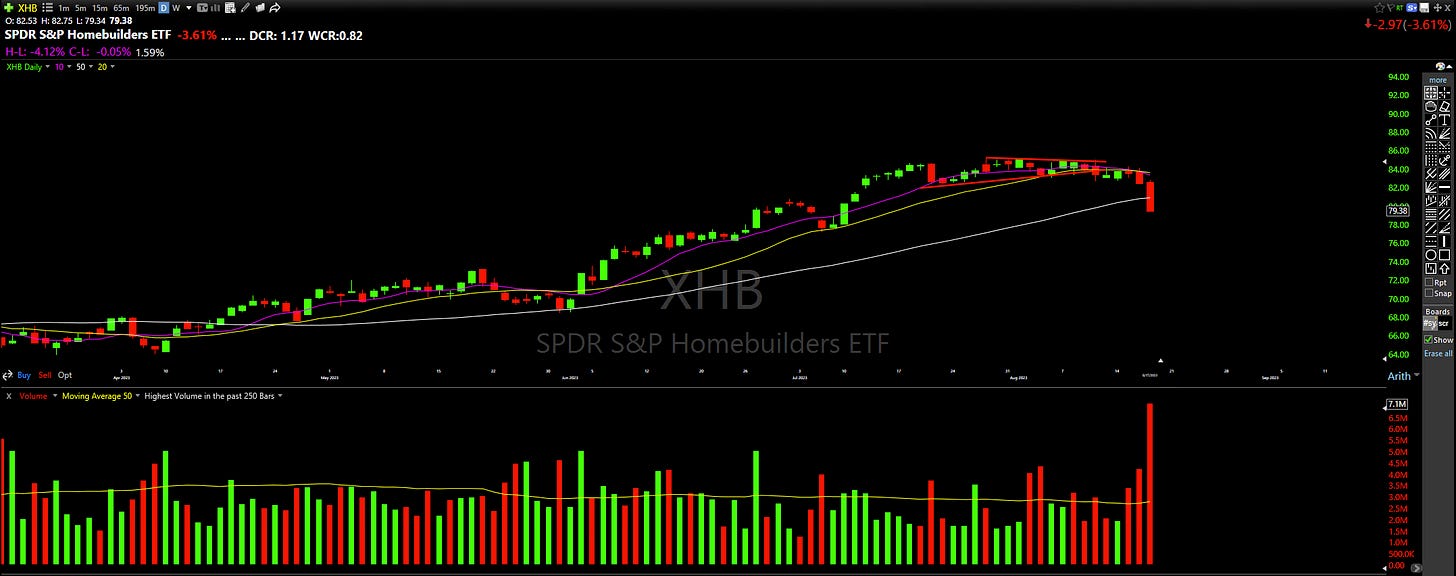
XHB 0.00%↑ Distribution in what was until recently a very strong sector showing relative strength:
Scans
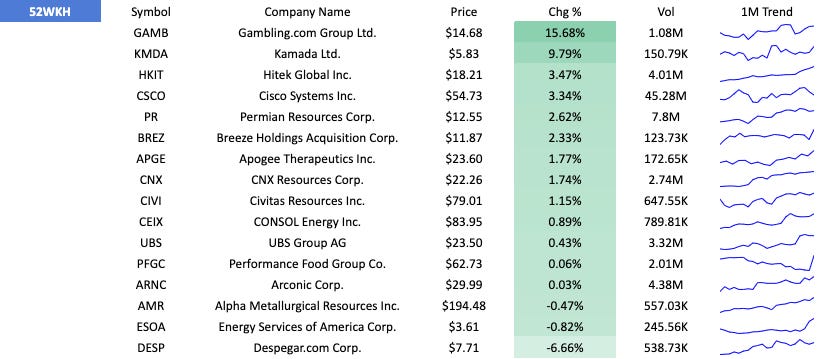
52 Week highs
9 Million breakout
Just 3 results here tells you what you need to know about this not being a favourable environment:
+10% Breakout
Personal Portfolio Update
Still 100% cash.


