

The Descending Trend Line Setup
The Descending Trend Line Setup
Key to trading momentum names

As a momentum trader - my main focus is identifying low-risk opportunities that could get me involved with momentum names at just the right moment
My go-to setup usually includes some variation of a descending trend line - I find this setup helps identify a key area where momentum may be shifting and allows you to get involved at the right time without taking on unnecessary risk
A trend line holds significance when it is connecting at least 3 areas of price, otherwise you could simply go full analysis paralysis and connect every 2 points on a chart
It simply shows that as of right now, momentum is currently to the downside in terms of forming lower lows and lower highs. And a break of this resistance may indicate that momentum is slowing to the downside while trying to shift upwards - which would indicate buyers showing up:

Image credits: Babypips
Now I do not simply buy every time I see a descending trend line - the setup I trade must include a:
Strong prior uptrend
Well-controlled pullback to the key moving averages
Low-risk spot to control risk against
Now while not a requirement, I also prefer it when the stock is setting up below its descending trend line with an inside day
This often lines up better as it typically gives you a narrow range day just below an area of resistance, allowing tight risk-management
The tightness I look for in setups is an indication of price contraction, which more often than not leads to a big move (in either direction):
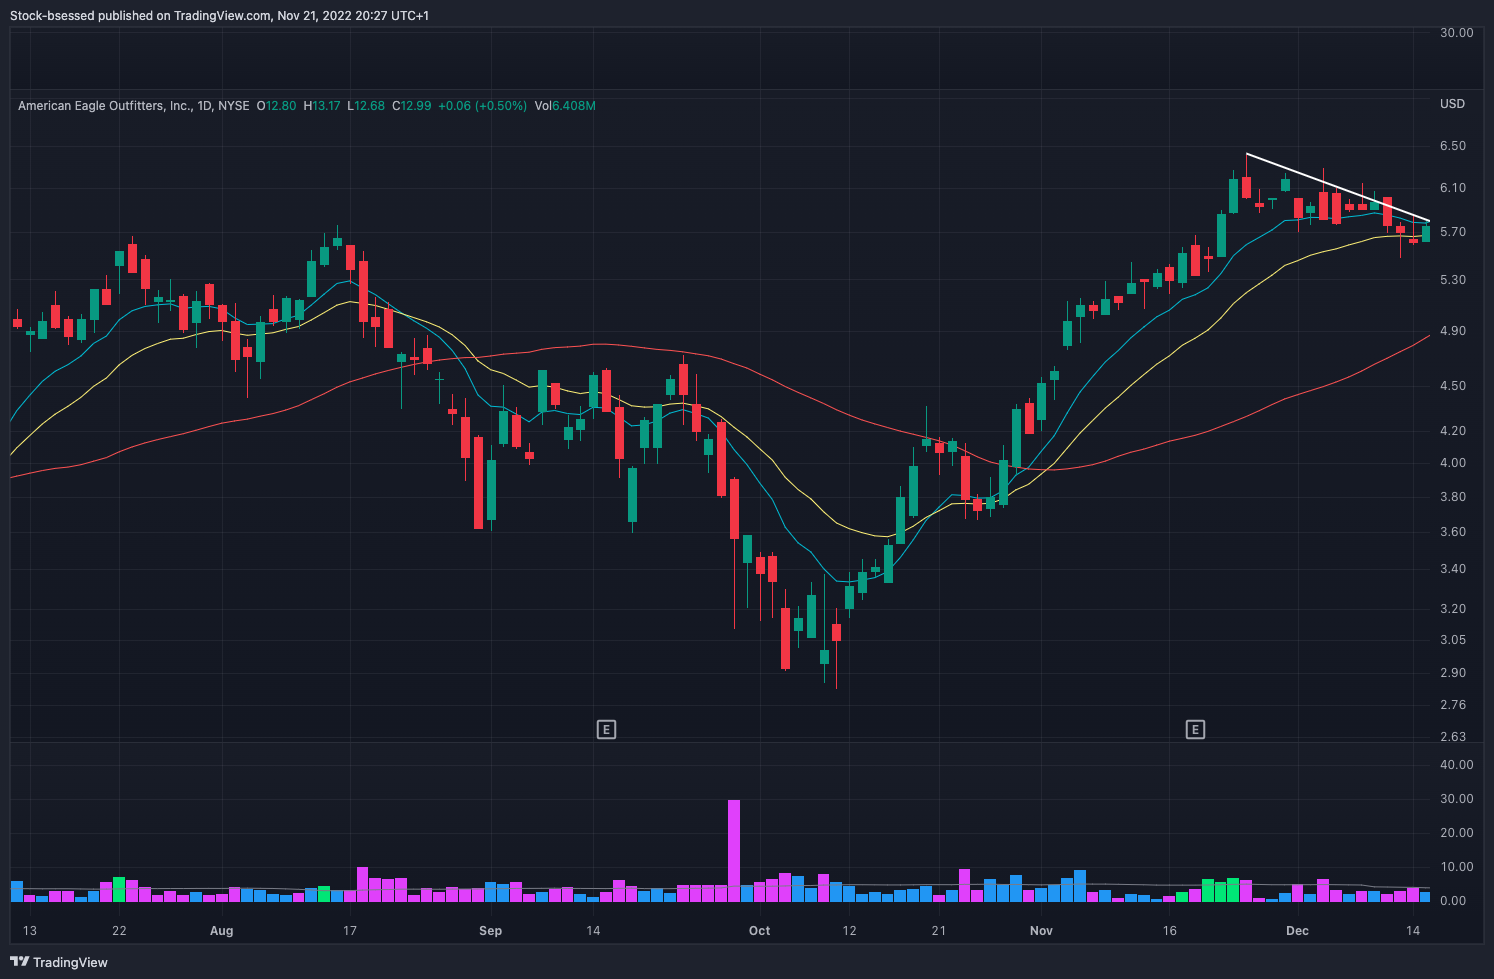
Example
AEO 0.00%↑ December 15, 1998
This is the kind of setup I look out for - something showing strong momentum after running +125% in 45 days, then pulls back in a controlled manner to the key moving averages as buyers show up at the 20EMA
Most importantly the inside day gives you an opportunity to manage risk well and get involved nearby on a break of this descending trend line - a break of the inside day’s high would be the point of entry and the low of that day would be the stop loss - allowing you to risk just -3.5% for a +20% run in just a few days
Strong prior uptrend
Well-controlled pullback to the key moving averages
Low-risk spot to control risk against


The key is then how you manage the trade according to your overall system and identifying the health of market at that point - the important thing is that you always stick to your plan and trading system
Recent DTL Trades
HIMS 0.00%↑ 17th April 2023
Strong prior uptrend
Well-controlled pullback to the key moving averages
Low-risk spot to control risk against
See if you can spot the requirements on this chart:

Clearly shows its momentum and ability to really get going with a strong prior uptrend after quickly doubling
Pulls back to the 50-day moving average in a controlled manner - if you look at the previous reactions it had these were also controlled and an area where buyers showed up quickly each time - if an area proves its relevance previously its likely to hold significance
Puts in a strong close right below its descending trend line and gives a low-risk area to manage against - using the low of the day would be just -3.3%, not bad for a +22% move in just a few days:


Had featured this in my daily market update after sharing it on my focus list the day before - shows how I approach using descending trend lines with minimal risk:

Some more recent examples - see if the same criteria apply here:

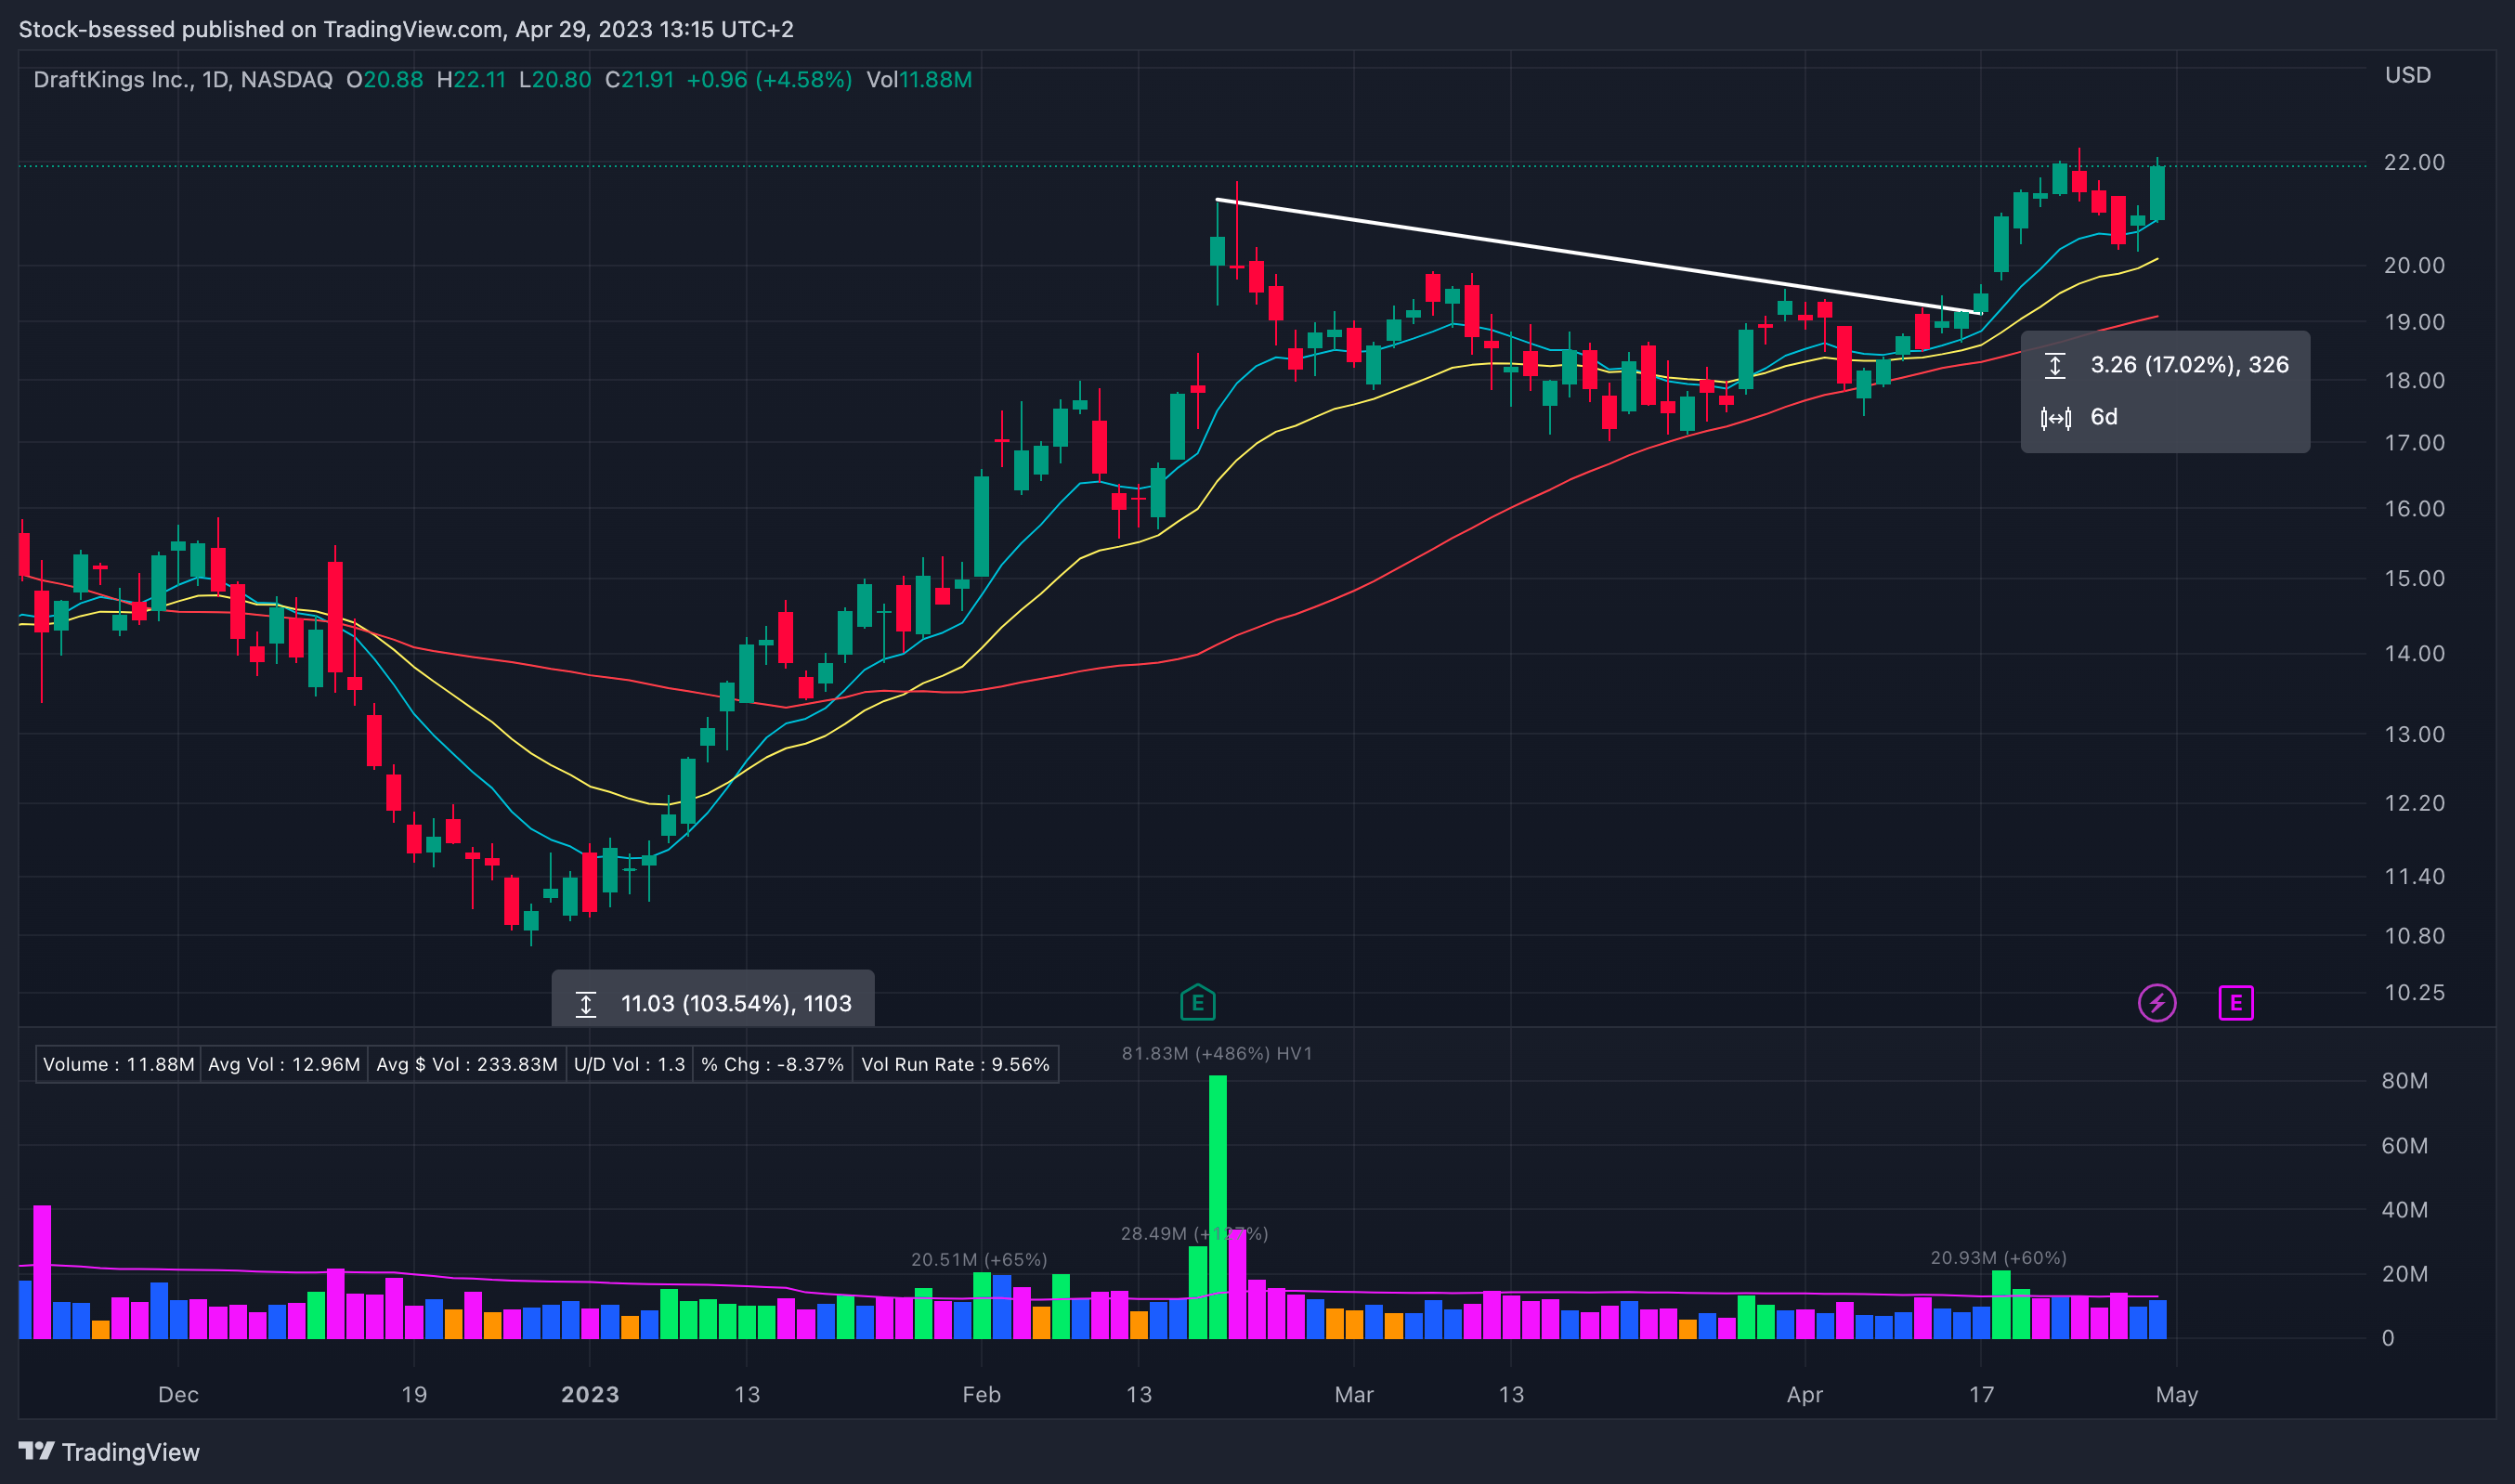
Shows momentum with a recent double off the lows
Pulls back to the 50-day moving average very well, responding positively each time and then tightens up below its descending trend line
Offers a low-risk spot to manage risk against - the entry is on a break of the previous session’s high, and using a stop just below that session’s low would only be risking -3%
Typically, in these names where I would expect clear directional movement if resistance is broken - I often try find an area above the low of the day to manage risk against - either an intraday consolidation or more commonly using the previous session’s close as a pivot
This allows me to size up my position while keeping the same amount of risk $ wise while getting involved at ideally just the right time
If a stock is not acting the way I want it to, with swift directional movement right after the break of resistance, why would I want to be involved? This lets me know quickly if I am right or wrong


They don’t all work!


The key is selling parts into strength and trailing a portion of your position for a potentially bigger move - something Oliver Kell says is that he wants to be in a position where you sell when you can not when you have to!
As with all setups, the way to form a system around this is by putting in the work and really studying the way stocks act throughout the history of the market, build you own database of historical examples and you will quickly learn what to look out for and what to avoid
Historical examples
ACB 0.00%↑ December 22, 2017

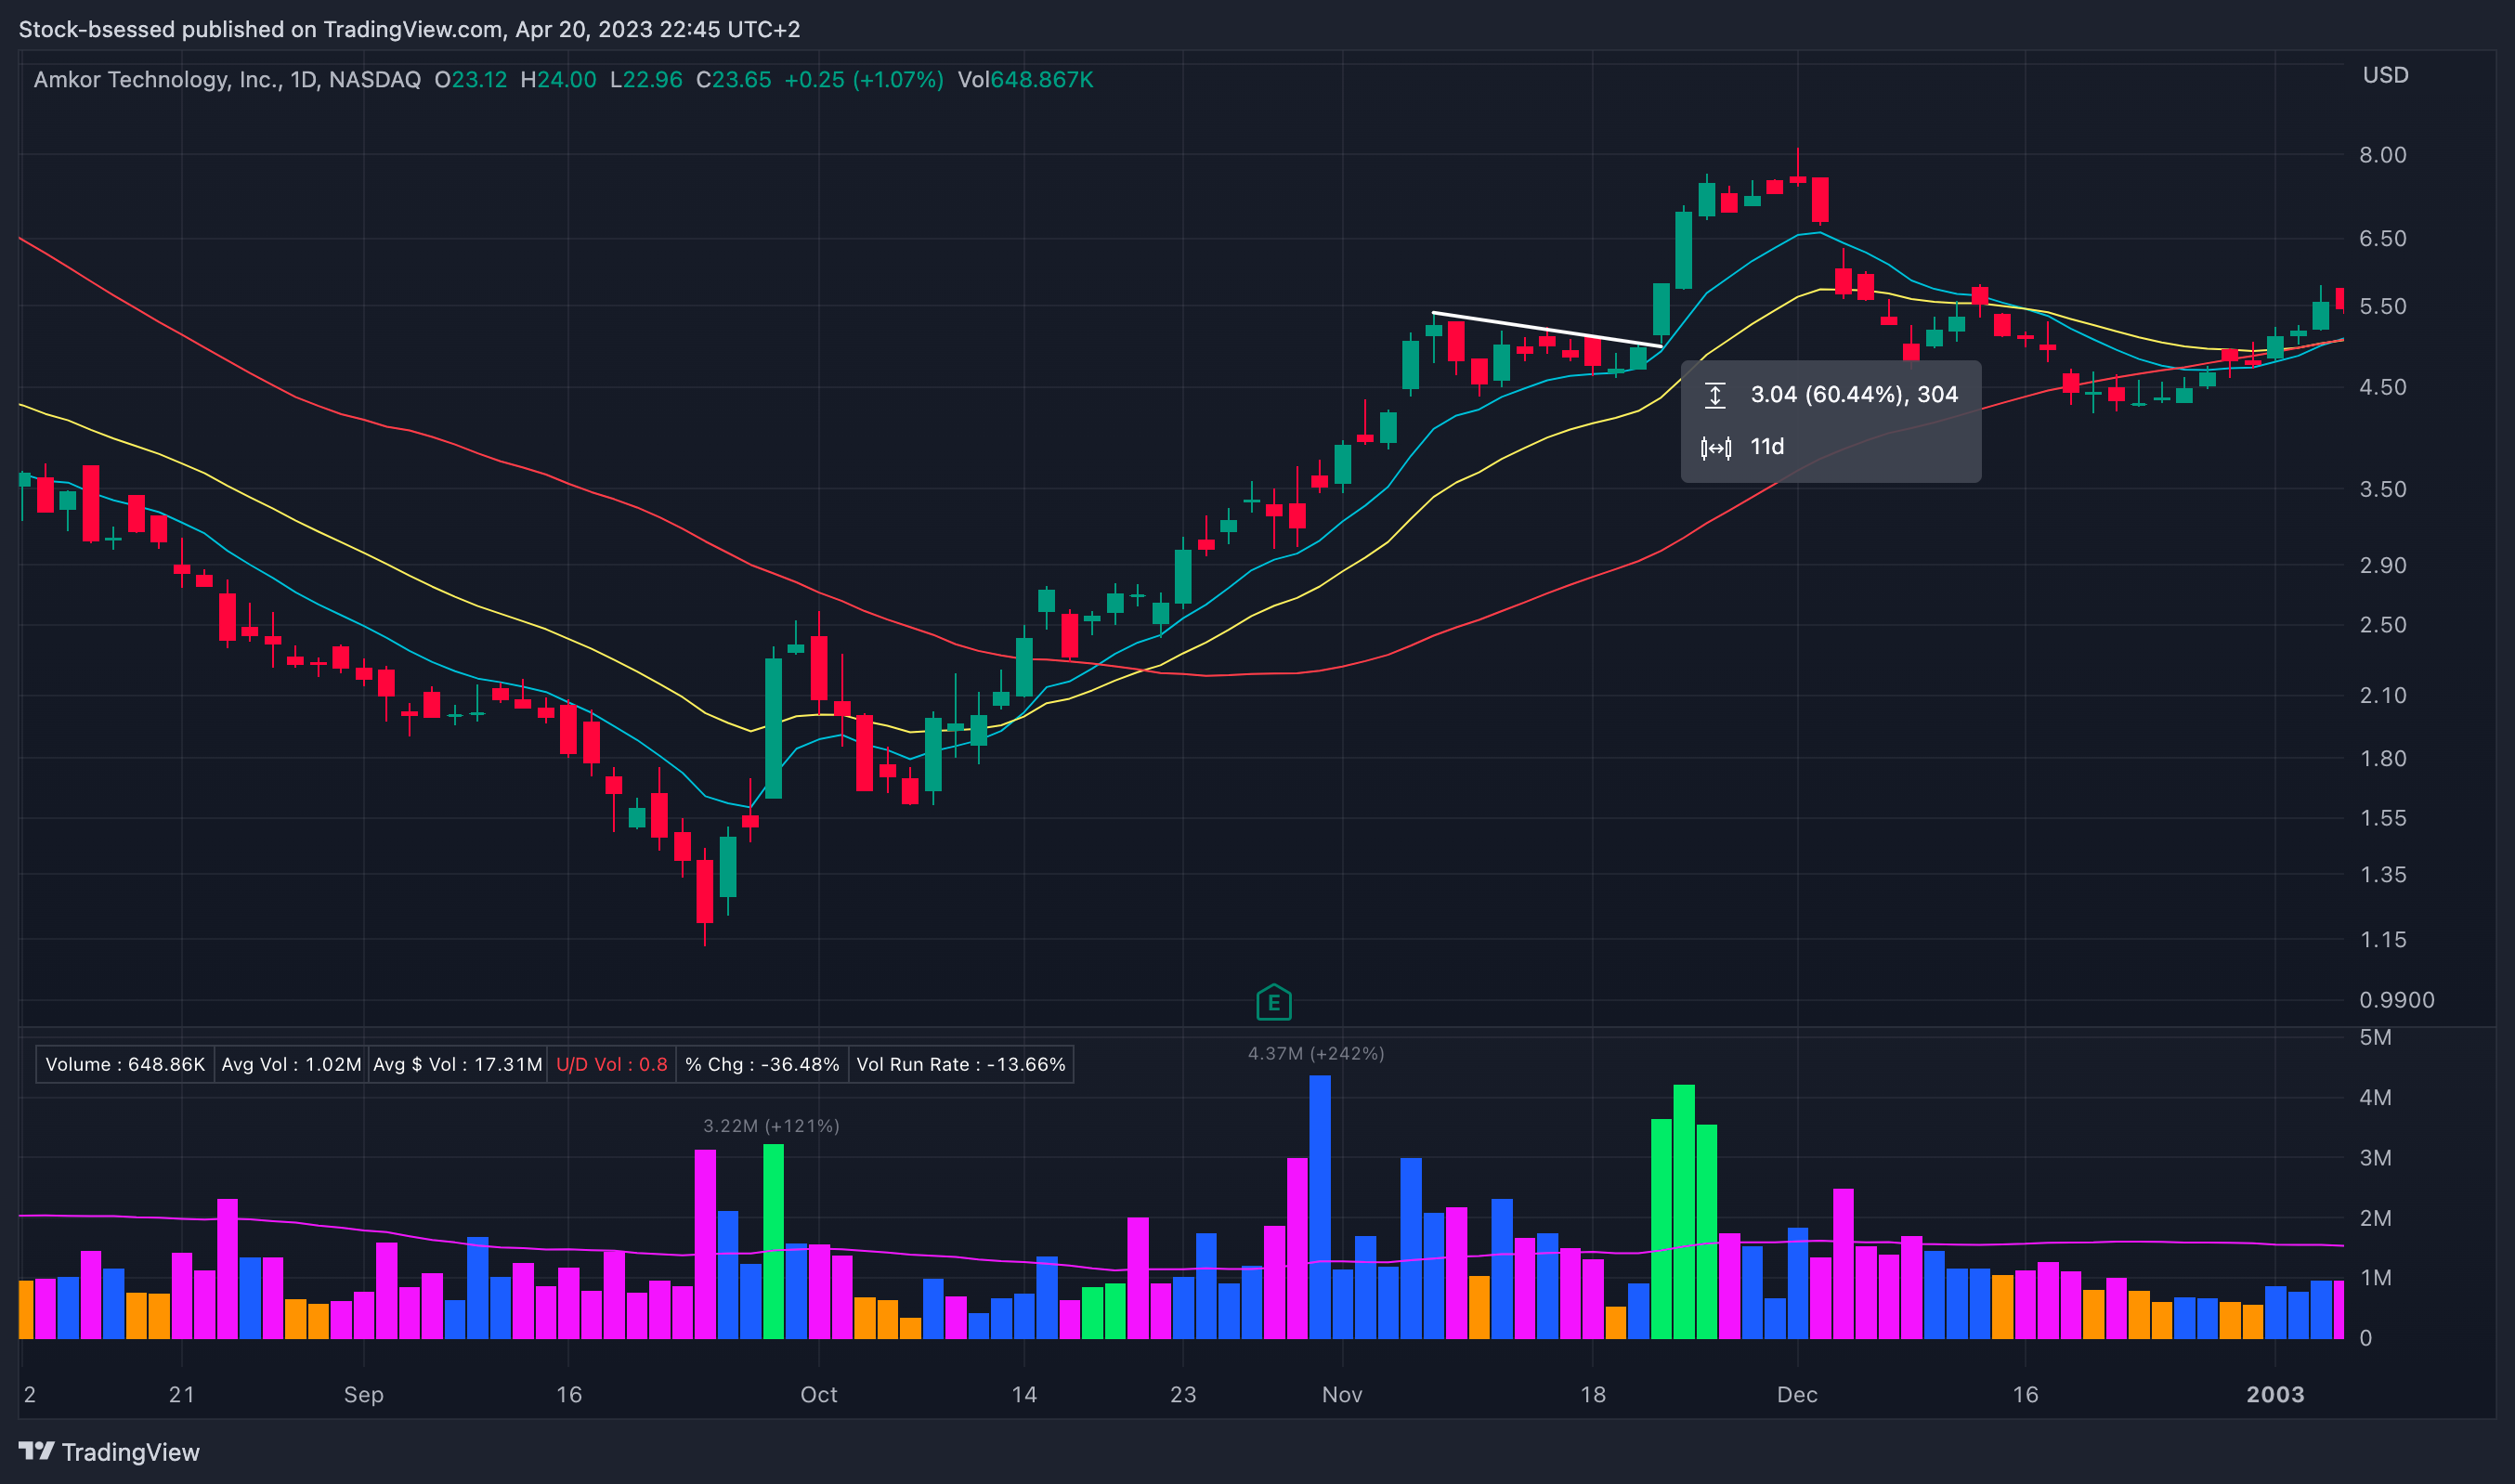
AMKR 0.00%↑ Nov 20, 2002

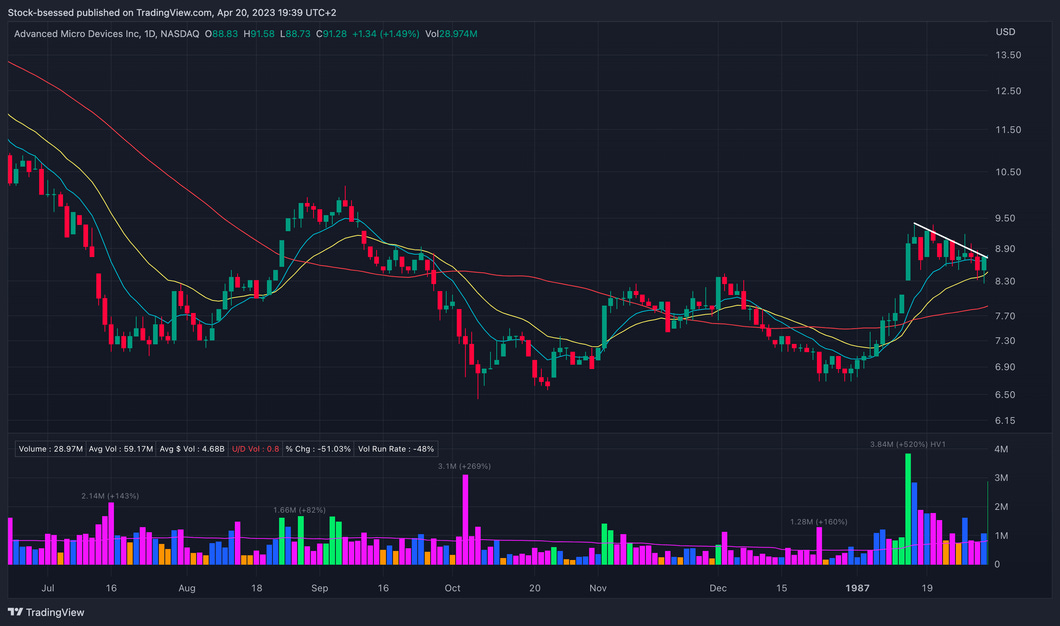
AMD 0.00%↑ Jan 30, 1987

ALKS 0.00%↑ Jan 5, 2000


AFIB 0.00%↑ Jul 19, 2022


AEO 0.00%↑ Dec 15, 1998

ADXS 0.00%↑ Dec 23, 2019
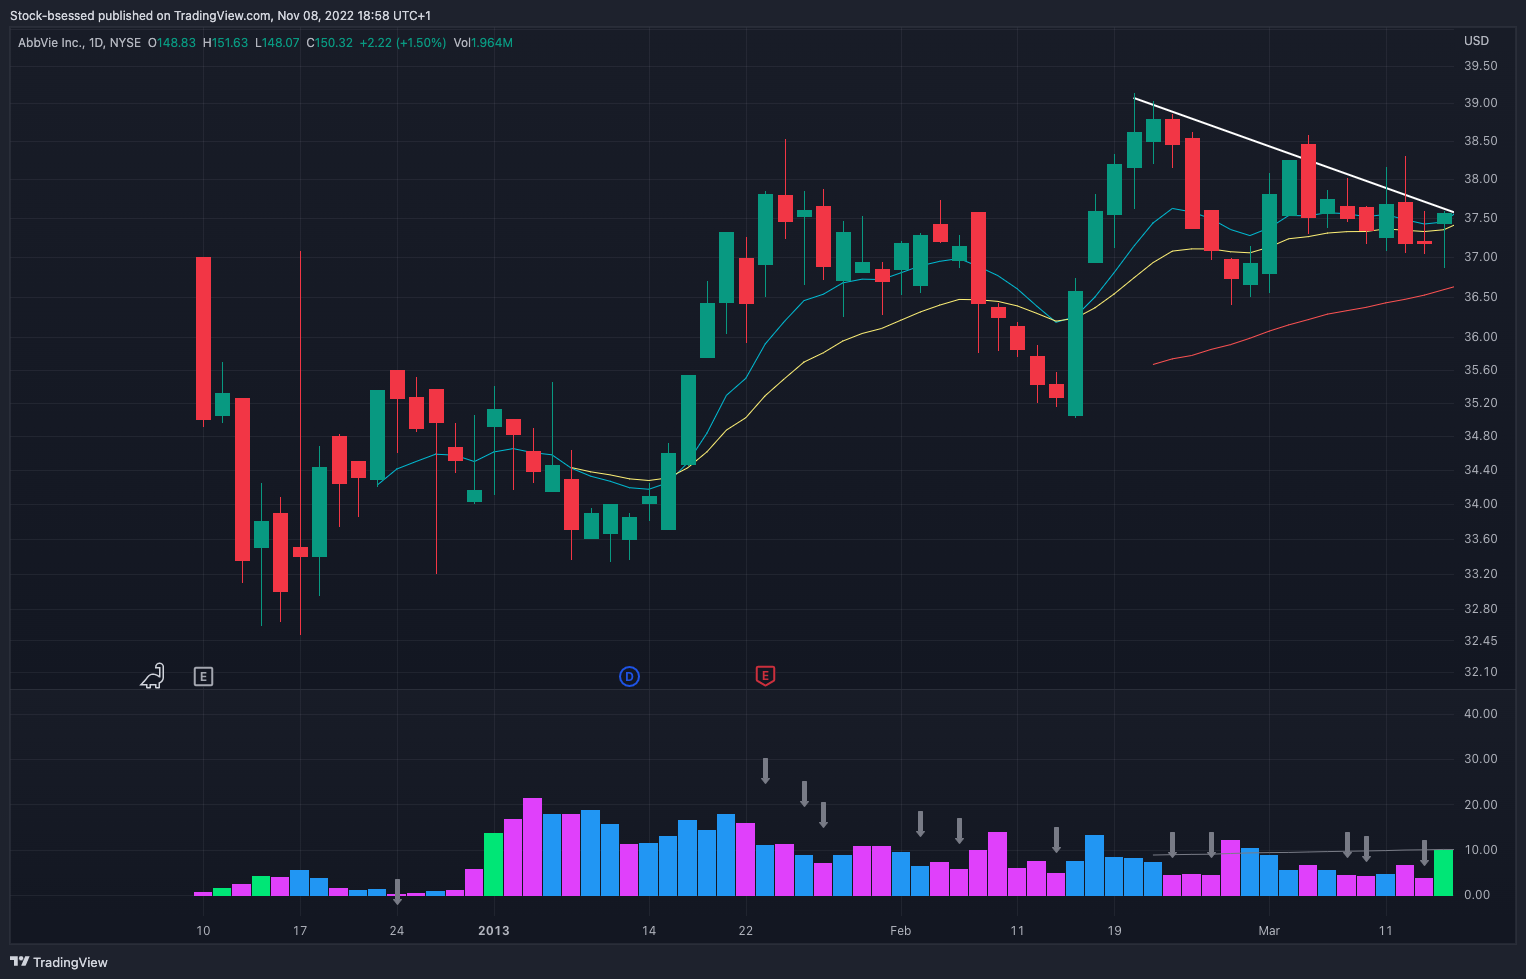
ABBV 0.00%↑ Mar 14, 2013

AMGN 0.00%↑ Dec 19, 1995


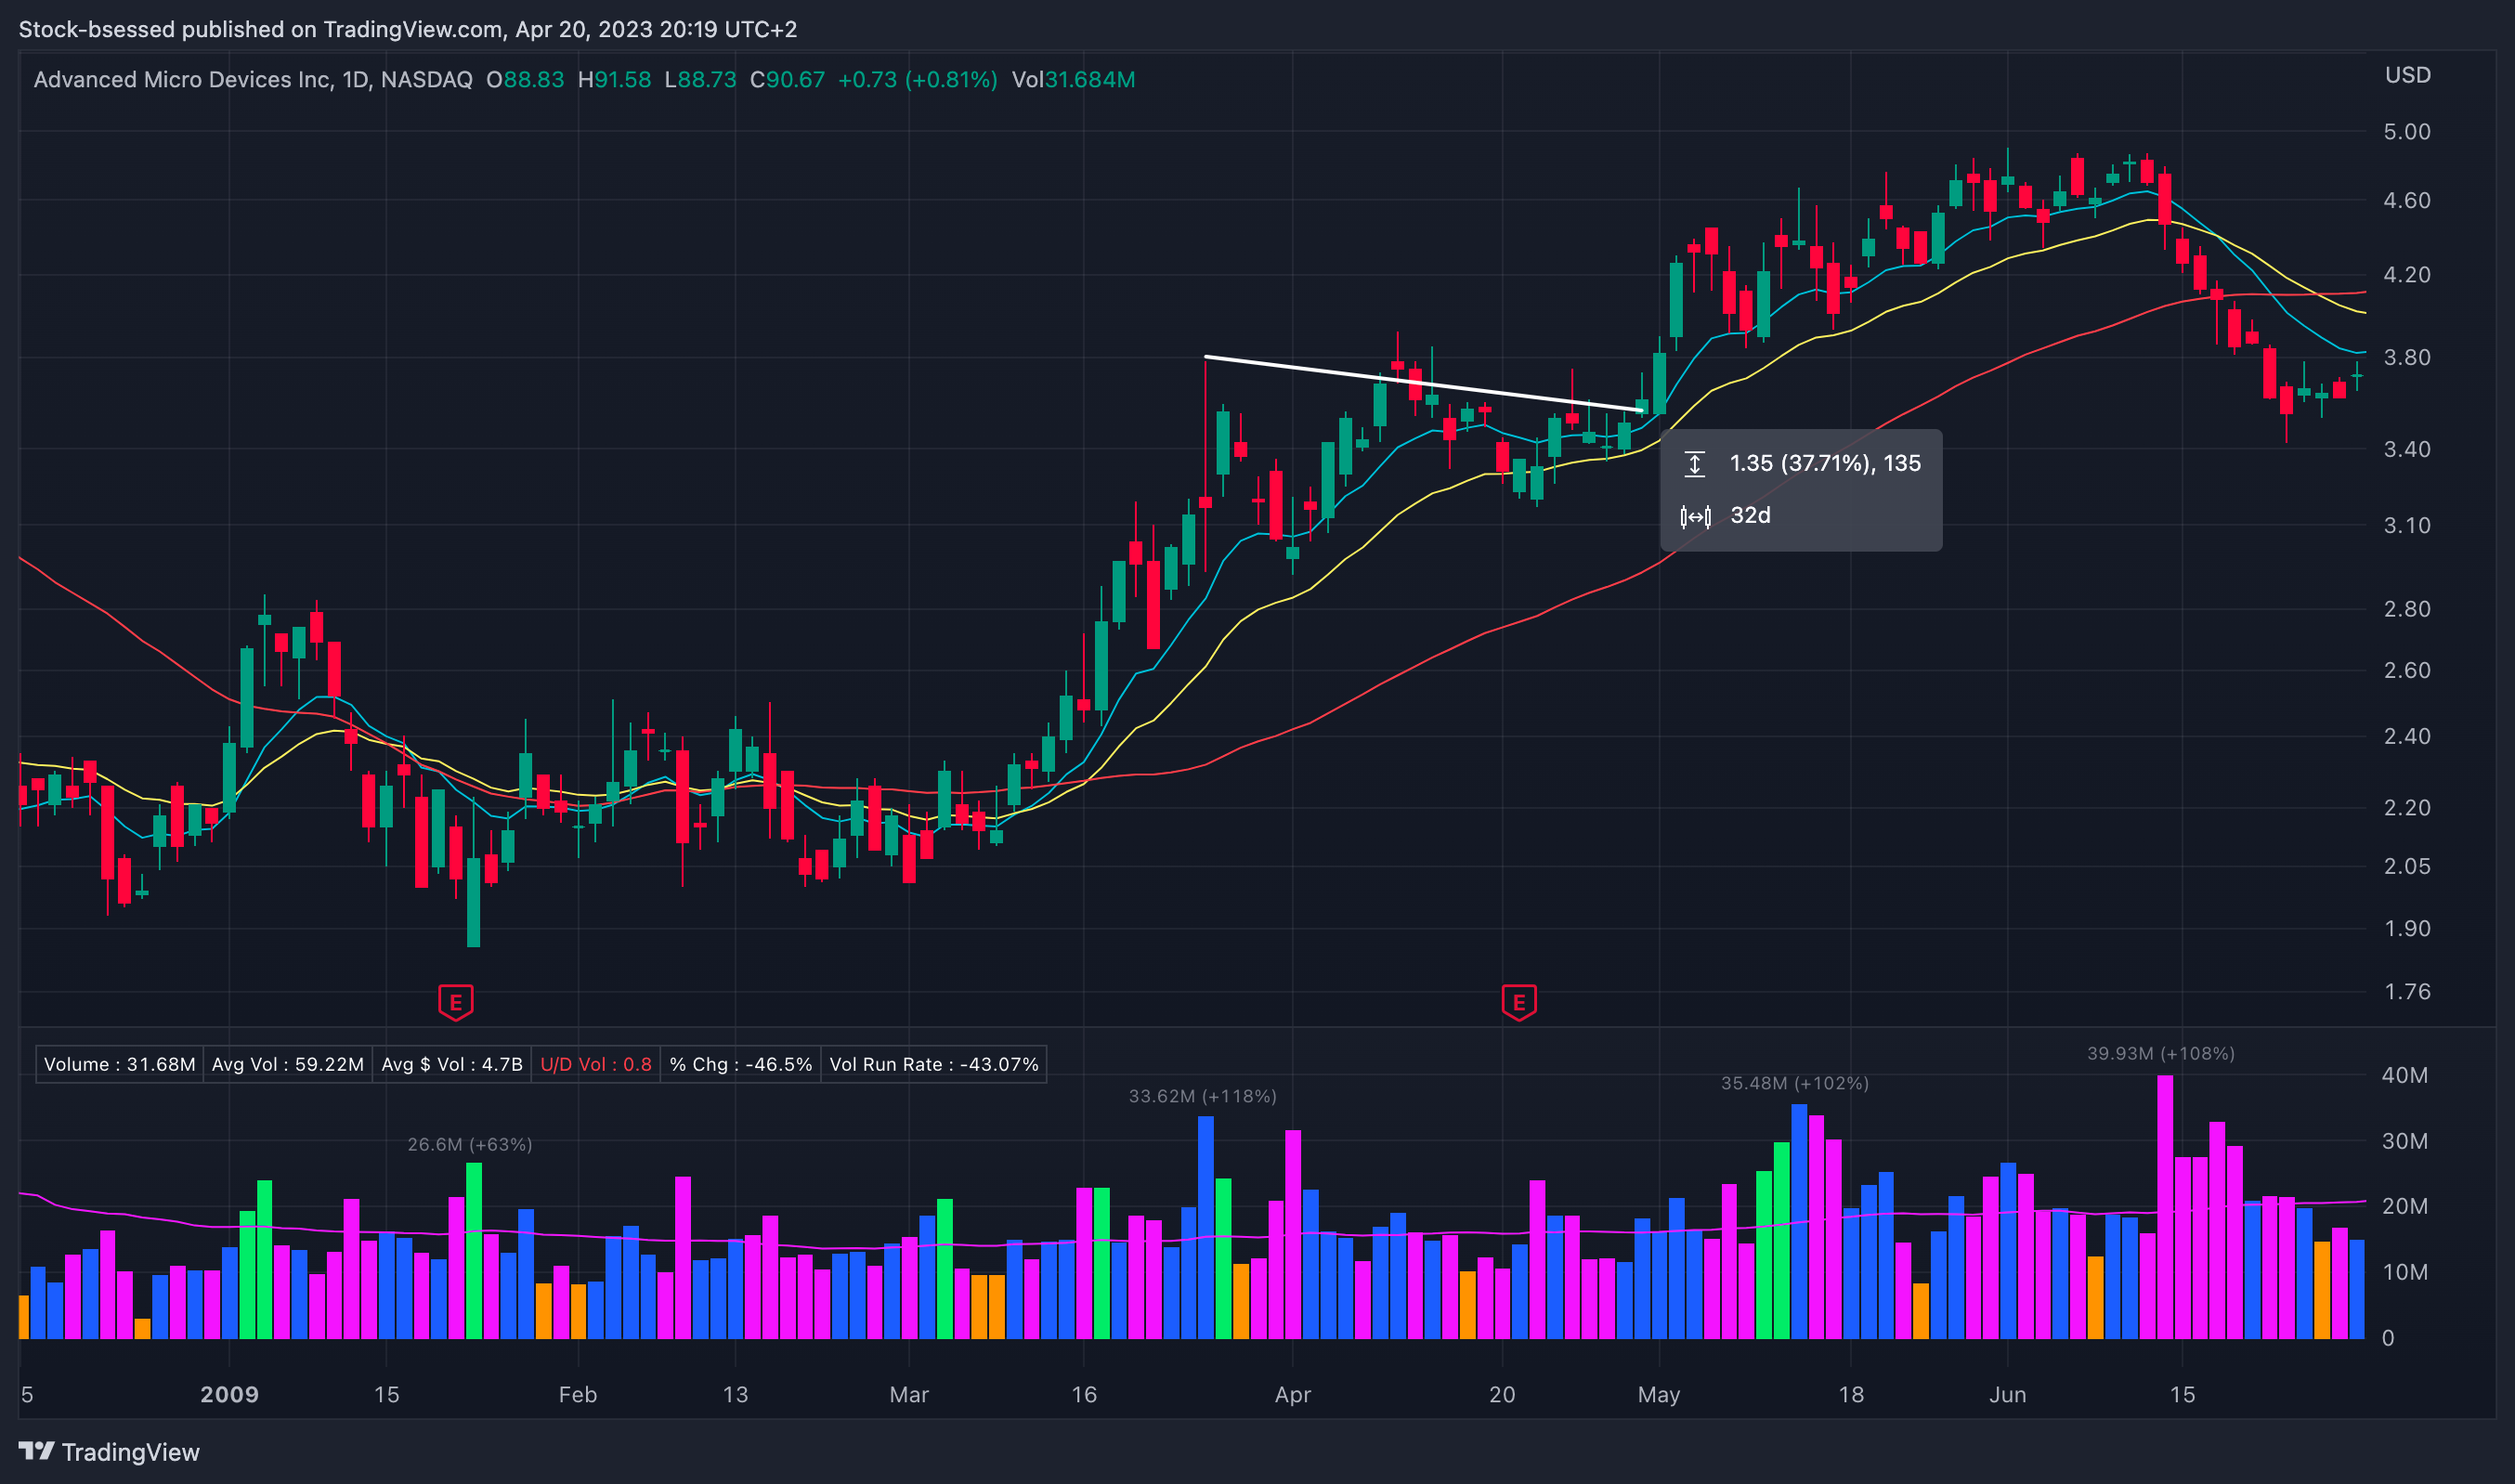
AMD 0.00%↑ Apr 29, 2009

As ever, an excellent exposition of your method. Thank you.
Nice examples, thanks, helps me understand your strategy better